


INTRODUCTION
The determination of pleural fluid adenosine deaminase (ADA) levels has acquired popularity as an adjunct diagnostic tool for the identification of tuberculous pleural effusions (TPEs), especially in tuberculous (TB) endemic areas [1,2]. High-ADA levels in TPEs are useful in the differentiation from malignant pleural effusions (MPEs), which usually have low ADA levels [3ŌĆō5]. However, some patients with MPE exhibit high-ADA levels [6,7], which may mimic TPEs. Routine microbiological and cytological tests from pleural fluid provide limited diagnostic yields [8,9]. Thus, MPEs with high-ADA levels may be clinically misdiagnosed as TPE and exposed to unnecessary toxic anti-TB drugs unless other confirmatory or appropriate evidences are provided [10,11].
Various biological markers have been determined in many studies to aid the differential diagnosis between overall TPEs and MPEs [3,5]. However, limited data are available regarding the differential diagnosis between TPEs and MPEs with high-ADA levels. This study aimed to identify predictors for discriminating MPEs with high-ADA levels from TPEs with high-ADA levels.
METHODS
Patients
This study was conducted at Kyungpook National University Hospital, a tertiary referral hospital in South Korea, in an area with intermediate prevalence of active TB [12]. We retrospectively reviewed the records of all consecutive patients who were diagnosed with MPEs between January 2010 and June 2019. Of these patients, those with confirmed MPE secondary to solid tumor and pleural fluid ADA levels Ōēź 40 IU/L, the most widely used cutoff value for a presumptive diagnosis of TPE [2], were included in the high-ADA MPE group. In the same study period, patients with confirmed and high-ADA TPE were classified as the high-ADA TPE group.
Following analysis with the initial study population, to validate a clinical prediction scale, patients with confirmed MPE and TPE with high pleural fluid ADA levels between July 2019 and February 2020 were consecutively retrospectively enrolled and comprised a validation cohort.
Diagnostic criteria
Diagnosis of MPE was confirmed if malignant cells were identified in the pleural fluid or pleural biopsy tissue [13]. TPE was confirmed if one of the following criteria was met in patients with pleural effusions: (1) positive culture or polymerase chain reaction (PCR) for Mycobacterium tuberculosis in the pleural fluid, pleural tissue, sputum, or bronchial aspirate and (2) pathologically chronic granulomatous inflammation with caseous necrosis in the pleural biopsy tissue and no evidence of other granulomatous diseases [14].
Data collection and determination of biological markers
Demographic, clinical, hematological, radiological, and pleural fluid data were obtained from patients in the respective groups. Blood and pleural fluid profiles performed on the same day were analyzed. Pleural fluid ADA activity was measured in a routine clinical setting using an automated calorimetric assay kit (Runpia Liquid ADA, Kyokuto Pharmaceutical Industrial Co. Ltd., Tokyo, Japan) as described in the package insert. Pleural fluid carcinoembryonic antigen (CEA) levels were determined using a radiometric immunoassay on the CEA-RIACT Model 10 (Cisbio Bioassays, Codolet, France). Radiological findings, including the amount and loculation of pleural effusion and presence of consolidation, lung nodule/mass, cavity, and pleural nodules, were evaluated. Chest radiography and conventional chest computed tomography (CT), which were routinely performed before diagnostic thoracentesis, were reviewed by a board-certified radiologist and pulmonologist who were blinded to the patientŌĆÖs clinical history and final diagnosis. Pleural nodules were defined as focal pleural thickening > 2 mm with nodular contour [15]. The study protocols were approved by the Institutional Review Board of Kyungpook National University Hospital (IRB No. 2020-05-007). Informed consent was waived because of the retrospective nature of the study.
Statistical analysis
Statistical analyses were performed using IBM SPSS Statistics for Windows version 22.0 (IBM Corp., Armonk, NY, USA). Continuous variables were expressed as median (interquartile range), and differences between groups were analyzed using the t test or Mann-Whitney U test. Categorical variables were expressed as absolute values and percentages and analyzed using the chi-square test or FisherŌĆÖs exact test. To identify independent predictive variables for high-ADA MPE, variables with p values < 0.05 in the univariate analysis were included in the multivariate logistic regression analysis. Receiver operating characteristic (ROC) curves were constructed to determine optimal cutoff values for the prediction of high-ADA MPE. Diagnostic accuracy was assessed using the area under the ROC curve (AUC). The correlation between pleural fluid biomarkers and pleural nodularity was assessed using PearsonŌĆÖs correlation coefficient.
RESULTS
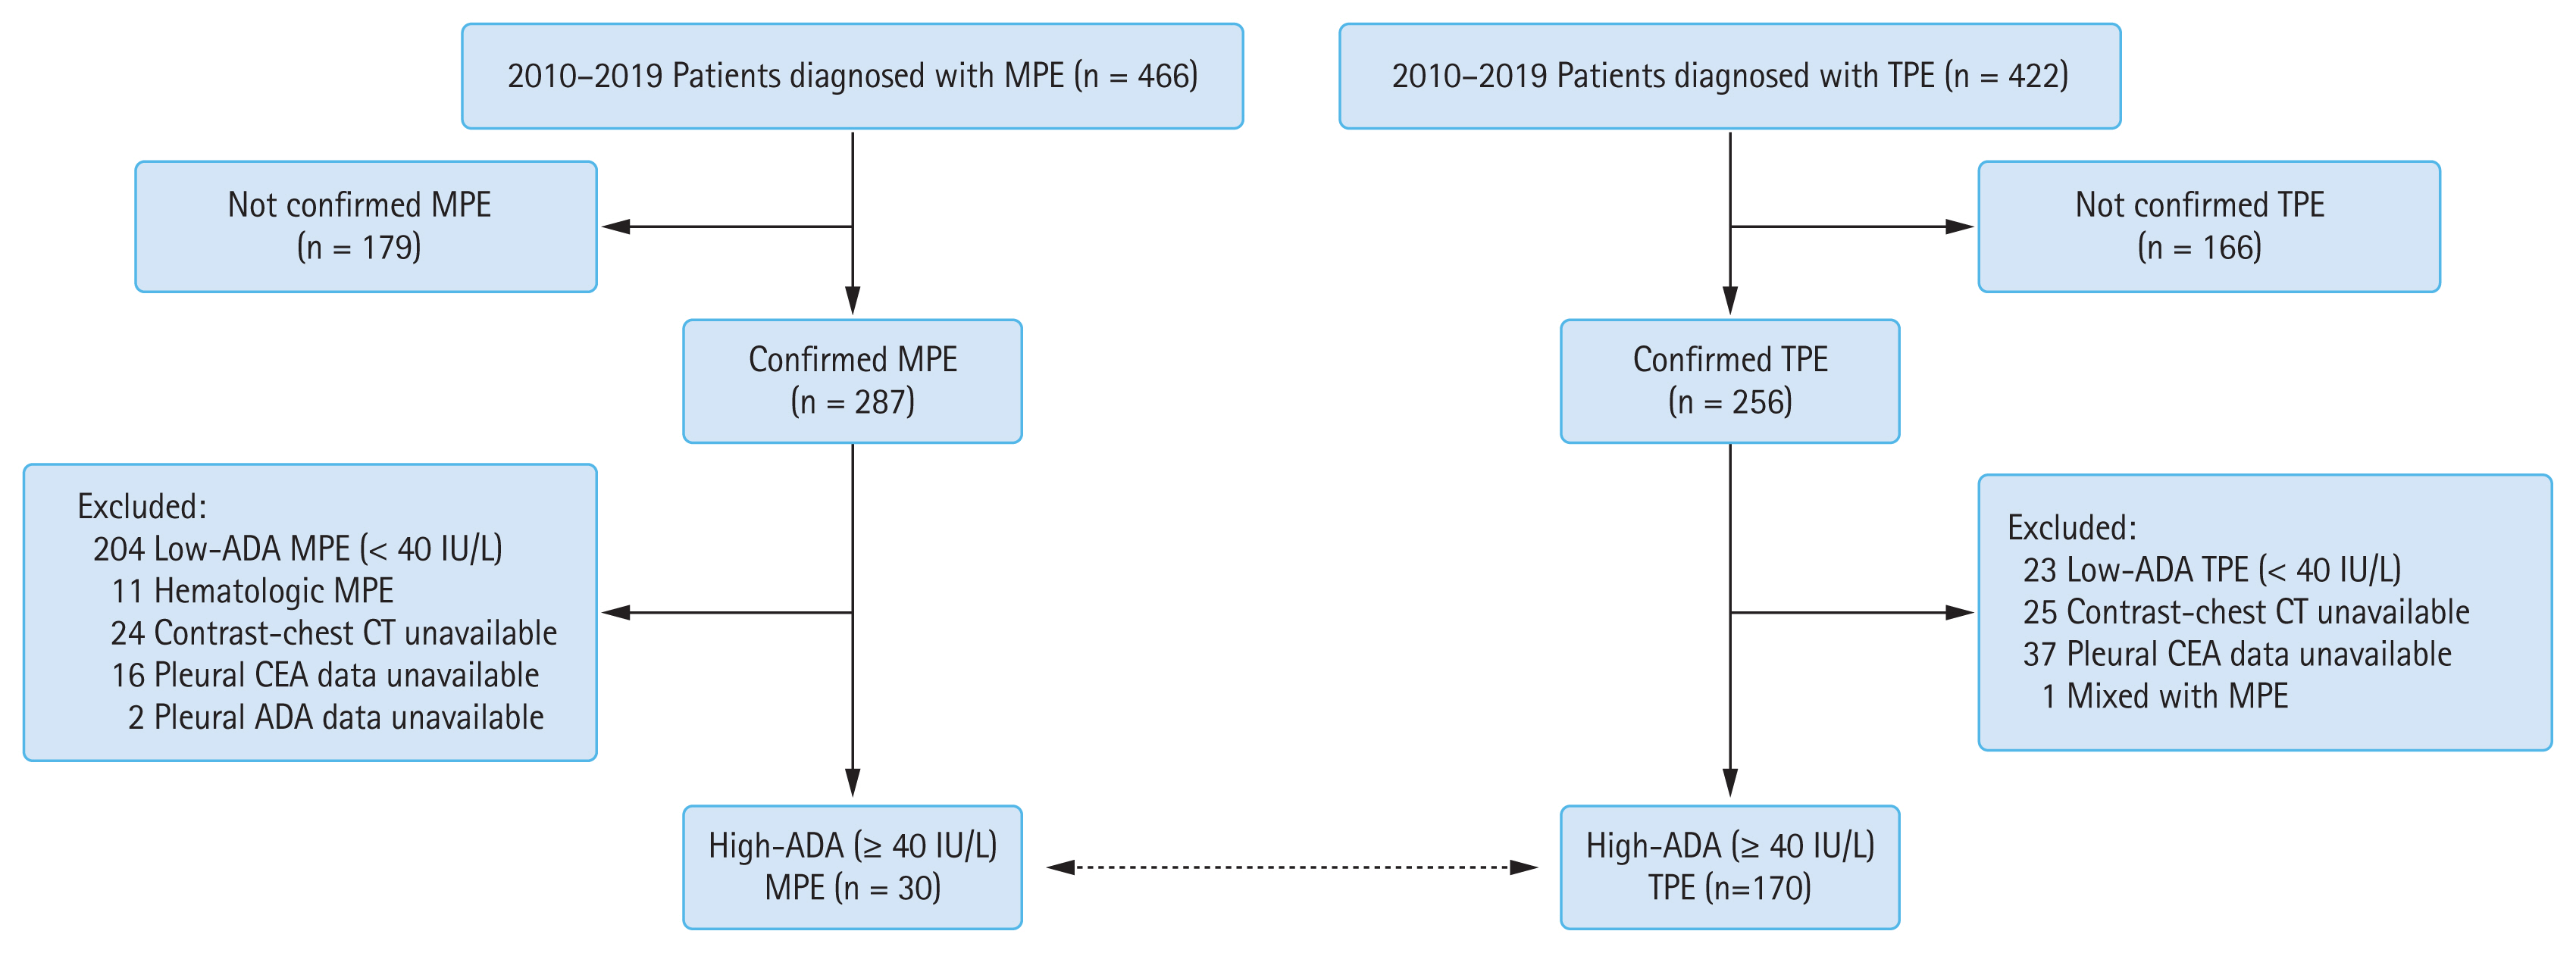
Of 466 consecutive patients diagnosed with MPE during the study period, 287 were confirmed to have MPE. Of these patients, those with low ADA levels (< 40 IU/L) (n = 204) and hematological malignancy (n = 11) and without available contrast-enhanced chest CT findings (n = 24), pleural fluid CEA level (n = 16), and pleural fluid ADA level (n = 2) were excluded. A total of 30 patients were assigned in the high-ADA MPE group (Fig. 1). These patients with MPE were diagnosed using cytology (n = 21) and pleural biopsy (n = 9). Most MPEs originated from lung cancer (n = 27): adenocarcinoma (n = 20), squamous cell carcinoma (n = 3), large cell carcinoma (n = 1), and non-small cell carcinoma (n = 3). Remaining three cases of MPEs included one malignant mesothelioma, one hepatocellular carcinoma, and one unknown primary site.
In the same study period, 170 patients with confirmed TPE (positive M. tuberculosis culture [n = 157], positive TB-PCR [n = 7], and pleural tissue histology [n = 6]) who had available pleural fluid data and contrast-enhanced chest CT were included in the high-ADA TPE group (Fig. 1).
Comparison of clinical, laboratory, and radiological data between the high-ADA MPE and high-ADA TPE groups
The median age in the high-ADA MPE and high-ADA TPE groups was 74 and 67 years, respectively, with significant difference (p = 0.001) and 67% of the patients in both groups were men. The frequency of fever > 37.5┬░C was higher in the TPE group than in the MPE group (50% vs. 10%, p < 0.001), while past TB history and weight loss were not significantly different between the two groups (Table 1).
Serum C-reactive protein levels were significantly higher in the TPE group than in the MPE group (6.2 mg/dL vs. 3.2 mg/dL, p = 0.002). Conversely, serum albumin levels were significantly lower in the TPE group (3.4 g/dL vs. 3.7 g/dL, p = 0.018). Pleural fluid lactate dehydrogenase and CEA levels were significantly higher in the MPE group than in the TPE group (lactate dehydrogenase, 1,338 U/L vs. 612 U/L, p = 0.021; CEA, 39 ng/mL vs. 1 ng/mL, p < 0.001), whereas pleural fluid ADA levels were significantly higher in the TPE group than in the MPE group (93 IU/L vs. 49 IU/L, p < 0.001).
In the radiological findings, loculated effusions and consolidative and cavitary lesions were significantly higher in the TPE group than in the MPE group (loculation, 27% vs. 3%, p = 0.005; consolidation, 41% vs. 13%, p = 0.004; cavity, 14% vs. 0%, p = 0.029). However, the number of pleural nodules was significantly larger in the MPE group than in the TPE group (73% vs. 11%, p < 0.001).
Multivariate analysis and weighted score for predicting MPE between the high-ADA MPE and high-ADA TPE groups
Clinical, laboratory, and radiological parameters presenting significant difference between the two groups (Table 1) were further analyzed by logistic regression test. Continuous variables were converted to categorical variables using cutoff points determined by ROC curves. The multivariate analysis selected three as being predictive of malignancy (Table 2). Using the magnitude of the ╬▓-coefficient, the weighted score of three parameters was established as follows: pleural fluid ADA level of 40 to 56 IU/L (3 points), pleural fluid CEA level Ōēź 6 ng/mL (6 points), and pleural nodularity (3 points). Fig. 2 shows the distribution of pleural fluid ADA and CEA levels and presence of pleural nodularity in the two groups. In the correlation analysis between predictors of malignancy, there was no significant correlation between these factors in the two groups (Table 3).
Diagnostic performance of scoring system using independent predictors
Table 4 shows the diagnostic performance based on the sum of predictive scores. At the best cutoff value of Ōēź 6 points, the scoring system yielded 90% sensitivity (95% confidence interval [CI], 72 to 97), 96% specificity (95% CI, 92 to 99), 82% positive predictive value (PPV) (95% CI, 64 to 92), and 98% negative predictive value (NPV) (95% CI, 94 to 100). The ROC curve had an AUC of 0.965 (p < 0.001). The AUC using single predictor or any combination of two predictors was lower than that using this scoring system (data not shown). A score Ōēź 6 was related to the following: (1) pleural fluid CEA level Ōēź 6 ng/mL, regardless of other predictors, and (2) presence of pleural nodularity and pleural fluid ADA level of 40 to 56 IU/L, in conjunction with pleural fluid CEA < 6 ng/mL. Cases with all three predictors showed 100% specificity and PPV. Two-thirds of patients with high-ADA MPE had at least 9 points (67% sensitivity), whereas those with none or either pleural nodularity or ADA level of 40 to 56 IU/L alone were less likely to have high-ADA MPE (PPV Ōēż 43%).
The small validation cohort comprised 20 patients with confirmed high-ADA MPE (n = 4) and high-ADA TPE (n = 16). Using the cutoff of Ōēź 6 points by our scoring system, diagnostic performance showed 100% sensitivity (95% CI, 40 to 100) and 94% specificity (95% CI, 68 to 100).
DISCUSSION
The main findings of the present study were as follows: (1) pleural fluid ADA level, pleural fluid CEA level, and pleural nodularity were independent discriminators between high-ADA MPEs and high-ADA TPEs; (2) using a scoring system, a sum score Ōēź 6 points yielded a sensitivity of 90%, a specificity of 96%, a PPV of 82%, and a NPV of 98% in discriminating high-ADA MPEs from high-ADA TPEs. These findings may be helpful in making clinical decisions regarding the differential diagnosis between TPEs and MPEs with high-ADA levels.
Pleural fluid ADA levels Ōēź 40 IU/L were found in approximately 10% of patients with MPE secondary to solid tumor [6,7]. However, specific characteristics of patients with MPE associated with high-ADA levels have not been identified. High-ADA levels in lymphocytic exudates may lead to presumptive misdiagnosis for TPE, especially in TB endemic areas. In fact, six of our 30 patients with high-ADA MPE were initially misdiagnosed as TPE because of delayed cytology results and early discharge on the day of thoracentesis in the emergency room. In the application of our scoring system, 27 of 30 patients with a high-ADA MPE had at least 6 points and four of six patients with MPE misdiagnosed with TPE had also at least 6 points. One patient with score < 6 points was finally diagnosed with malignant mesothelioma.
Several studies have discovered pleural abnormalities on CT suggesting malignancy [15ŌĆō19]. Pleural abnormalities are more direct findings than lung lesions associated with pleural effusions. Of these CT findings, pleural nodularity is a sensitive and specific feature similar to or better than other pleural CT findings in the diagnosis of MPE [16ŌĆō18]. Our results confirmed that pleural nodularity was a useful finding in the prediction of MPE. Additionally, the addition of pleural nodularity to pleural fluid ADA and CEA predictors for high-ADA MPE increased the AUC from 0.942 to 0.965. However, 11% of patients with TPE also showed pleural nodularity. Our findings in the largest population with confirmed TPE are in line with a previous study [15]. Thus, these results suggest that cautious interpretation of pleural nodularity should be conducted [19]. The present study did not include other pleural CT features suggesting malignancy, such as circumferential pleural thickening, parietal pleural thickening > 1 cm, and mediastinal pleural involvement [15ŌĆō19]. Although combining other pleural CT findings may provide better discrimination between malignant and benign diseases, this may be more complex and more dependent on subjective radiological findings.
In contrast to pleural nodularity, pleural fluid high-ADA levels generally suggest TPE [20,21]. The present study revealed that most patients in the high-ADA MPE group showed modest increase in ADA levels, whereas most patients in the high-ADA TPE group had relatively higher ADA levels (Fig. 2A). Thus, differential diagnosis between MPE and TPE patients with modestly increased ADA levels may be more challenging and requires more attention. However, our results showed that patients with MPE would more likely have additional predictors (i.e., increased CEA levels or pleural nodularity), whereas patients with TPE are less likely to have other predictors (Table 3 and Fig. 2B and 2C). Thus, patients with ADA predictor alone would be more likely to have TPE (Table 4).
Multivariate analysis showed that pleural fluid CEA level increase was a stronger predictor for MPE than modest pleural fluid ADA level increase (40 to 56 IU/L) and pleural nodularity, resulting in assigning a high score (6 points). The presence of any additional predictor in conjunction with increased CEA levels strongly suggests MPE. This may be partly explained by TPE showing lower false-positive rates for the increase in CEA level than other benign effusions, such as complicated parapneumonic effusion or empyema, which are the main causes of the false-positive increase in CEA level in non-MPEs [22,23]. In fact, in this study, only five (3%) patients with TPE exceeded a CEA level of 6 ng/mL (Fig. 2B). However, pleural fluid CEA levels show little or no elevation in malignant mesotheliomas, lymphomas, and some histological types, including squamous or small cell carcinomas [13,24,25]. Pleural nodularity and ADA levels may play a role in such cases. In this study, six of nine patients with high-ADA MPE with a CEA level < 6 ng/mL had concurrent modest ADA level increase and pleural nodularity.
The present study had several limitations. First, it was a retrospective study performed in a single center with a small population of patients with high-ADA MPE. The results should be fully validated in other large populations. However, our results suggest that clinician should be on the alert to the potential of MPE in lymphocytic exudates with high-ADA levels. Although there were few patients with misdiagnosis of MPE and wrong treatment, these patients might be more frequent than the number represented, considering that only confirmed patients with MPE were included in this study and those cases may not be less frequent in general hospitals other than tertiary referral hospitals, particularly in TB-prevalent countries. Our scoring system may reduce the risk of misdiagnosis as false TPE in patients with high-ADA MPE. Second, this study was performed on patients with only TPE and MPE. Other benign diseases and hematological malignancies can also show high-ADA levels. Thus, our results should be cautiously interpreted and cannot extrapolate to the general population with high-ADA pleural effusion.
In conclusion, pleural fluid ADA levels Ōēź 40 IU/L were often observed in MPEs secondary to solid malignancy, and simple scoring system, which includes pleural fluid ADA level, pleural fluid CEA level, and pleural nodularity, may be useful in guiding the differential diagnosis between high-ADA MPEs and high-ADA TPEs.
KEY MESSAGE
1. Lymphocytic exudates with pleural fluid adenosine deaminase (ADA) levels Ōēź 40 IU/L often existed in malignant pleural effusion (MPE) cases secondary to solid tumor.
2. Pleural fluid ADA level of 40 to 56 IU/L (3 points), pleural fluid carcinoembryonic antigen level Ōēź 6 ng/mL (6 points), and the presence of pleural nodularity (3 points) were independent predictors in the differentiation of high-ADA MPEs from high-ADA tuberculous pleural effusions.
3. Using a scoring system, a sum score Ōēź 6 points yielded a sensitivity of 90% and specificity of 96%, with an area under the ROC curve of 0.965.


 PDF Links
 PubReader
 ePub Link
 Full text via DOI
 Download Citation
 Print
Print


