


INTRODUCTION
Helicobacter pylori is an important cause of gastritis and peptic ulcer diseases, and associated with diseases other than the gastrointestinal tract such as neurological disorders, cardiovascular diseases, asthma, immunologic impairment and nonalcoholic fatty liver disease [1]. Several studies have explained a relationship between H. pylori infection and insulin resistance (IR), metabolic syndrome (MS), diabetes mellitus (DM) [2–4], and considerable data support that H. pylori infection can induce pathogenic mechanisms of DM, such as IR and inflammation [5], that H. pylori infection is associated with the occurrence of DM and the level of glycated hemoglobin A1c (A1C) [6,7].
Recently, studies on the connection between the eradication of H. pylori and the improvement of metabolic parameters including A1C are being conducted, and several studies have reported decreases of fasting plasma glucose (FPG) and A1C levels after 3 or 6 months after H. pylori eradication [8–11]. However, the long-term effect of H. pylori eradication on the MS or DM has not been established yet. Thus, the aim of this study was to evaluate the long-term effect of H. pylori eradication on the glycemic control. As there are differences in sex and age in the incidence and development of MS and DM [12], additional subgroup analysis by sex and age was performed.
METHODS
Study participants
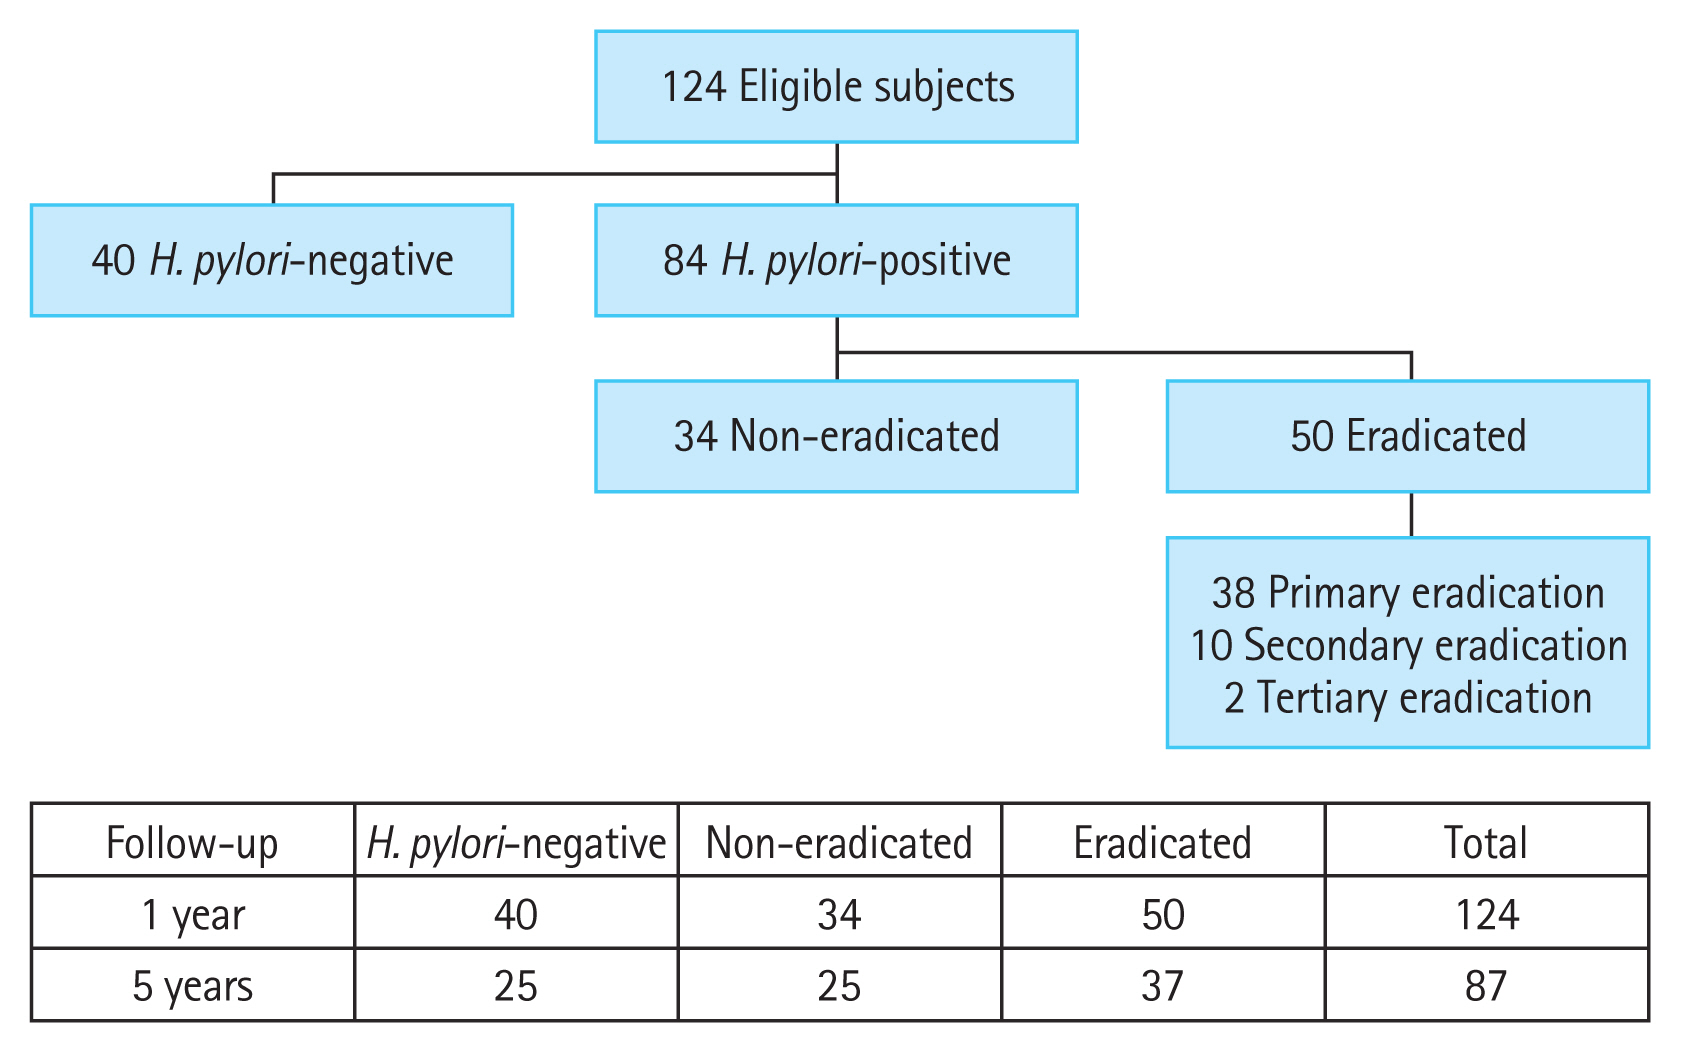
Total 124 asymptomatic subjects with type 2 diabetes mellitus (T2DM) or prediabetes mellitus (preDM) who underwent esophagogastroduodenoscopy (EGD) were selected and analyzed. They came from a cohort prospectively built for 5 years from May 2010 to February 2015 at the Seoul National University Bundang Hospital (SNUBH) (Fig. 1), after excluding the following criteria: (1) subjects with a history of gastric surgery and/or gastric cancer, esophageal cancer, type 1 DM, other major diseases including systemic inflammation or advanced malignant diseases; (2) subjects unsure whether they had previously received H. pylori eradication therapy; or (3) subjects whose A1C levels at baseline or at first year of follow-up are missing. Medical data of these subjects including sex, age, levels of FPG, A1C, total cholesterol (TC), triglyceride (TG), low-density lipoprotein cholesterol (LDL-C), high-density lipoprotein cholesterol (HDL-C), blood pressure (BP), and the prescription records (including changes) were collected using the Clinical Data Warehouse (CDW) in SNUBH, which has been widely used for medical research [13]. All participants completed a self-administration questionnaire under the supervision of the interviewer, which includes questions about smoking, alcohol consumption, height, weight. The Institutional Review Board (IRB) of SNUBH (B-1904-532-110) approved this study protocol. All subjects provided written informed consent in accordance with the ethical principles of the Declaration of Helsinki.
Anthropometric and laboratory data collection
Trained nurses used a standardized protocol to obtain the anthropometric measurements, such as weight and height. Body mass index (BMI) value was calculated using the measured height and weight (kg/m2). BP was measured using an automated machine. Blood samples were collected in the morning after fasting overnight. The levels of A1C, TC, TG, LDL-C, HDL-C, and FPG were measured from the day before the administration of H. pylori eradication therapy in the eradicated group or the enrollment day in the H. pylori-negative and non-eradication groups using serum. We followed up each parameter at the 1 and 5 years after the eradication or enrollment dates.
Variables
T2DM and preDM were diagnosed on the basis of the ‘2019 Clinical practice guidelines for type 2 diabetes mellitus in Korea’ [14]. Hypertension and dyslipidemia were defined following The 2018 Guidelines by The Korean Society of Hypertension [15] and Korean Guidelines for the Management of Dyslipidemia 4th edition [16]. According to the revised International Diabetes Federation (IDF) definition, a person has MS if they have central obesity and any two of the following four factors: (1) raised BP: systolic blood pressure (SBP) ≥ 130 mmHg, diastolic blood pressure (DBP) ≥ 85 mmHg, or treatment of previously diagnosed hypertension; (2) reduced HDL-C levels: < 40 mg/dL in men and < 50 mg/dL in women; (3) raised TG levels: ≥ 150 mg/dL or specific treatment for abnormality in TG; and (4) FPG levels: > 100 mg/dL (> 5.6 mmol/L) or previously diagnosed T2DM. Generally, central obesity is defined as waist circumference > 90 cm in men and > 80 cm in women or BMI > 30 kg/m2. We defined central obesity as BMI > 25 kg/m2, according to the Korean Society for the Study of Obesity [17].
Confirmation of H. pylori infection
EGDs were done for diagnostic testing for H. pylori, and single endoscopist performed biopsies for consistency. Ten biopsy specimens were taken from the mid antrum and mid corpus for H. pylori testing: histology, culture, and rapid urease test. Four specimens of them were incubated for H. pylori at 37°C in microaerobic conditions for 3 to 5 days. Other four specimens were stained with modified Giemsa and hematoxylin and eosin stains, fixed in 10% neutral-buffered formalin, and embedded with paraffin to assess the presence of H. pylori. The others were used for Campylobacter-like organism (CLO) test or rapid urease test [18]. All biopsies were also examined by single expert pathologist for consistency.
Blood samples were taken from all subjects immediately after EGD. The serum was isolated and stored at −70°C until further evaluations. The samples were tested for immunoglobulin G (IgG) antibody against H. pylori using an enzyme-linked immunosorbent assay (Genedia H. pylori ELISA, Green Cross Medical Science Corp., Yongin, Korea), which has a sensitivity of 97.9% and specificity of 92.0% in the Korean population [19].
H. pylori eradication therapy and follow-up
If any one of the three tests (culture, histology, or CLO test) had a positive result, the H. pylori infection was defined as a current infection. These current infection statuses were divided into H. pylori-positive with non-eradication and eradication group, according to whether or not H. pylori was eradicated. Positivity for the H. pylori serology test only and/or an H. pylori eradication history indicated a past H. pylori infection, which were excluded from this study. The H. pylori-negative group consisted of subjects with negative results for anti-H. pylori IgG antibodies as well as the histology, culture, and CLO tests.
The subjects with current H. pylori infection who wanted eradication therapy were treated with initial therapy, which consisted of triple therapy before 2012 [19], and a 10-day sequential therapy since then [19,20]. The triple therapy regimen was a combination of 40 mg of esomeprazole twice a day, 1,000 mg of amoxicillin twice a day, and 500 mg of clarithromycin twice a day for 7 days [19]. The 10-day sequential therapy included 40 mg of esomeprazol, 1,000 mg of amoxicillin twice a day for 5 days followed by 40 mg of esomeprazole twice a day, 500 mg of clarithromycin twice a day, and 500 mg of metronidazole twice a day for the next 5 days [20]. The H. pylori eradication was assessed using the 13C-urea breath test 4 weeks after treatment [19]. In subjects who failed the first-line regimen, we chose another 14-day quadruple regimen, containing bismuth (40 mg of esomeprazole twice a day, 300 mg of tripotassium dicitrate bismuthate [Denol, Greencross Co., Seoul, Korea] four times a day, 500 mg of metronidazole three times a day, and 500 mg of tetracycline four times a day), or a 14-day moxifloxacin-based triple therapy, containing 400 mg of moxifloxacin (Avelox, Bayer Health Care AG, Wuppertal, Germany) four times a day, 40 mg of esomeprazole twice a day, and 1,000 mg of amoxicillin twice a day [19]. At each follow-up visit for endoscopic surveillance, the status of H. pylori was evaluated using CLO test and/or biopsy. Therefore, it was confirmed that the H. pylori status was maintained during the follow-up period. The follow-up time points were classified as 1 and 5 years after eradication date in for the eradication group or enrollment dates for the other groups.
Statistical analysis
We performed the Pearson’s chi-square test for categorical variables and one-way analysis of variance (ANOVA) for continuous variables to compare baseline characteristics. Student’s t test and one-way ANOVA were used to compare the A1C levels and other metabolic parameters with respect to H. pylori status at each follow-up. To determine whether there was statistical significance in the A1C level changes, according to follow-up period differences among the groups, a linear mixed model was used. All analyses were performed using SPSS Windows version 22.0 (IBM Co., Armonk, NY, USA). If the p value was 0.05 or lower, the result was regarded as significant. And all statistical analysis and visualization process was conducted with consultation from the medical research collaborating center of SNUBH.
RESULTS
Subjects characteristics
Among 124 subjects, the number of the H. pylori-negative (negative) group was 40, H. pylori-positive with no eradication (non-eradicated) group was 34, and H. pylori-positive with eradication (eradicated) group was 50 (Fig. 1). There were no significant differences in age, sex, the levels of A1C, TG, HDL-C, LDL-C, TC, SBP, BMI, FPG, the number of alcohol drinkers, smokers, subjects taking diabetes medication, subjects with T2DM, hypertension, hyperlipidemia and MS between groups (Table 1). DBP was lower in the eradication group than in the H. pylori-negative group (p = 0.035) (Table 1).
Primary eradication treatment was successful in 38 out of 50 patients (76%). Ten patients (20%) were successfully eradicated after secondary eradication, and finally, two (4%) patients were eradicated in three tries. During follow-up period, H. pylori tests were conducted along with endoscopy, and there was one case of re-infection after successful eradication. The case of re-infection was excluded from the analysis.
Effect of H. pylori eradication on A1C
The improvement in A1C was statistically significant after the eradication of H. pylori at the 1st and the 5th year of follow-up. The A1C level was significantly decreased in the eradicated group compared to the non-eradicated group (1st year, p = 0.025; 5th year, p = 0.012), and to the other two groups (1st year, p = 0.024; 5th year, p = 0.009) (Table 2). No one had converted to normal after H. pylori eradication in 42 T2DM patients, and hemoglobin A1c (HbA1c) level of one of eight prediabetes patients became normal after eradication.
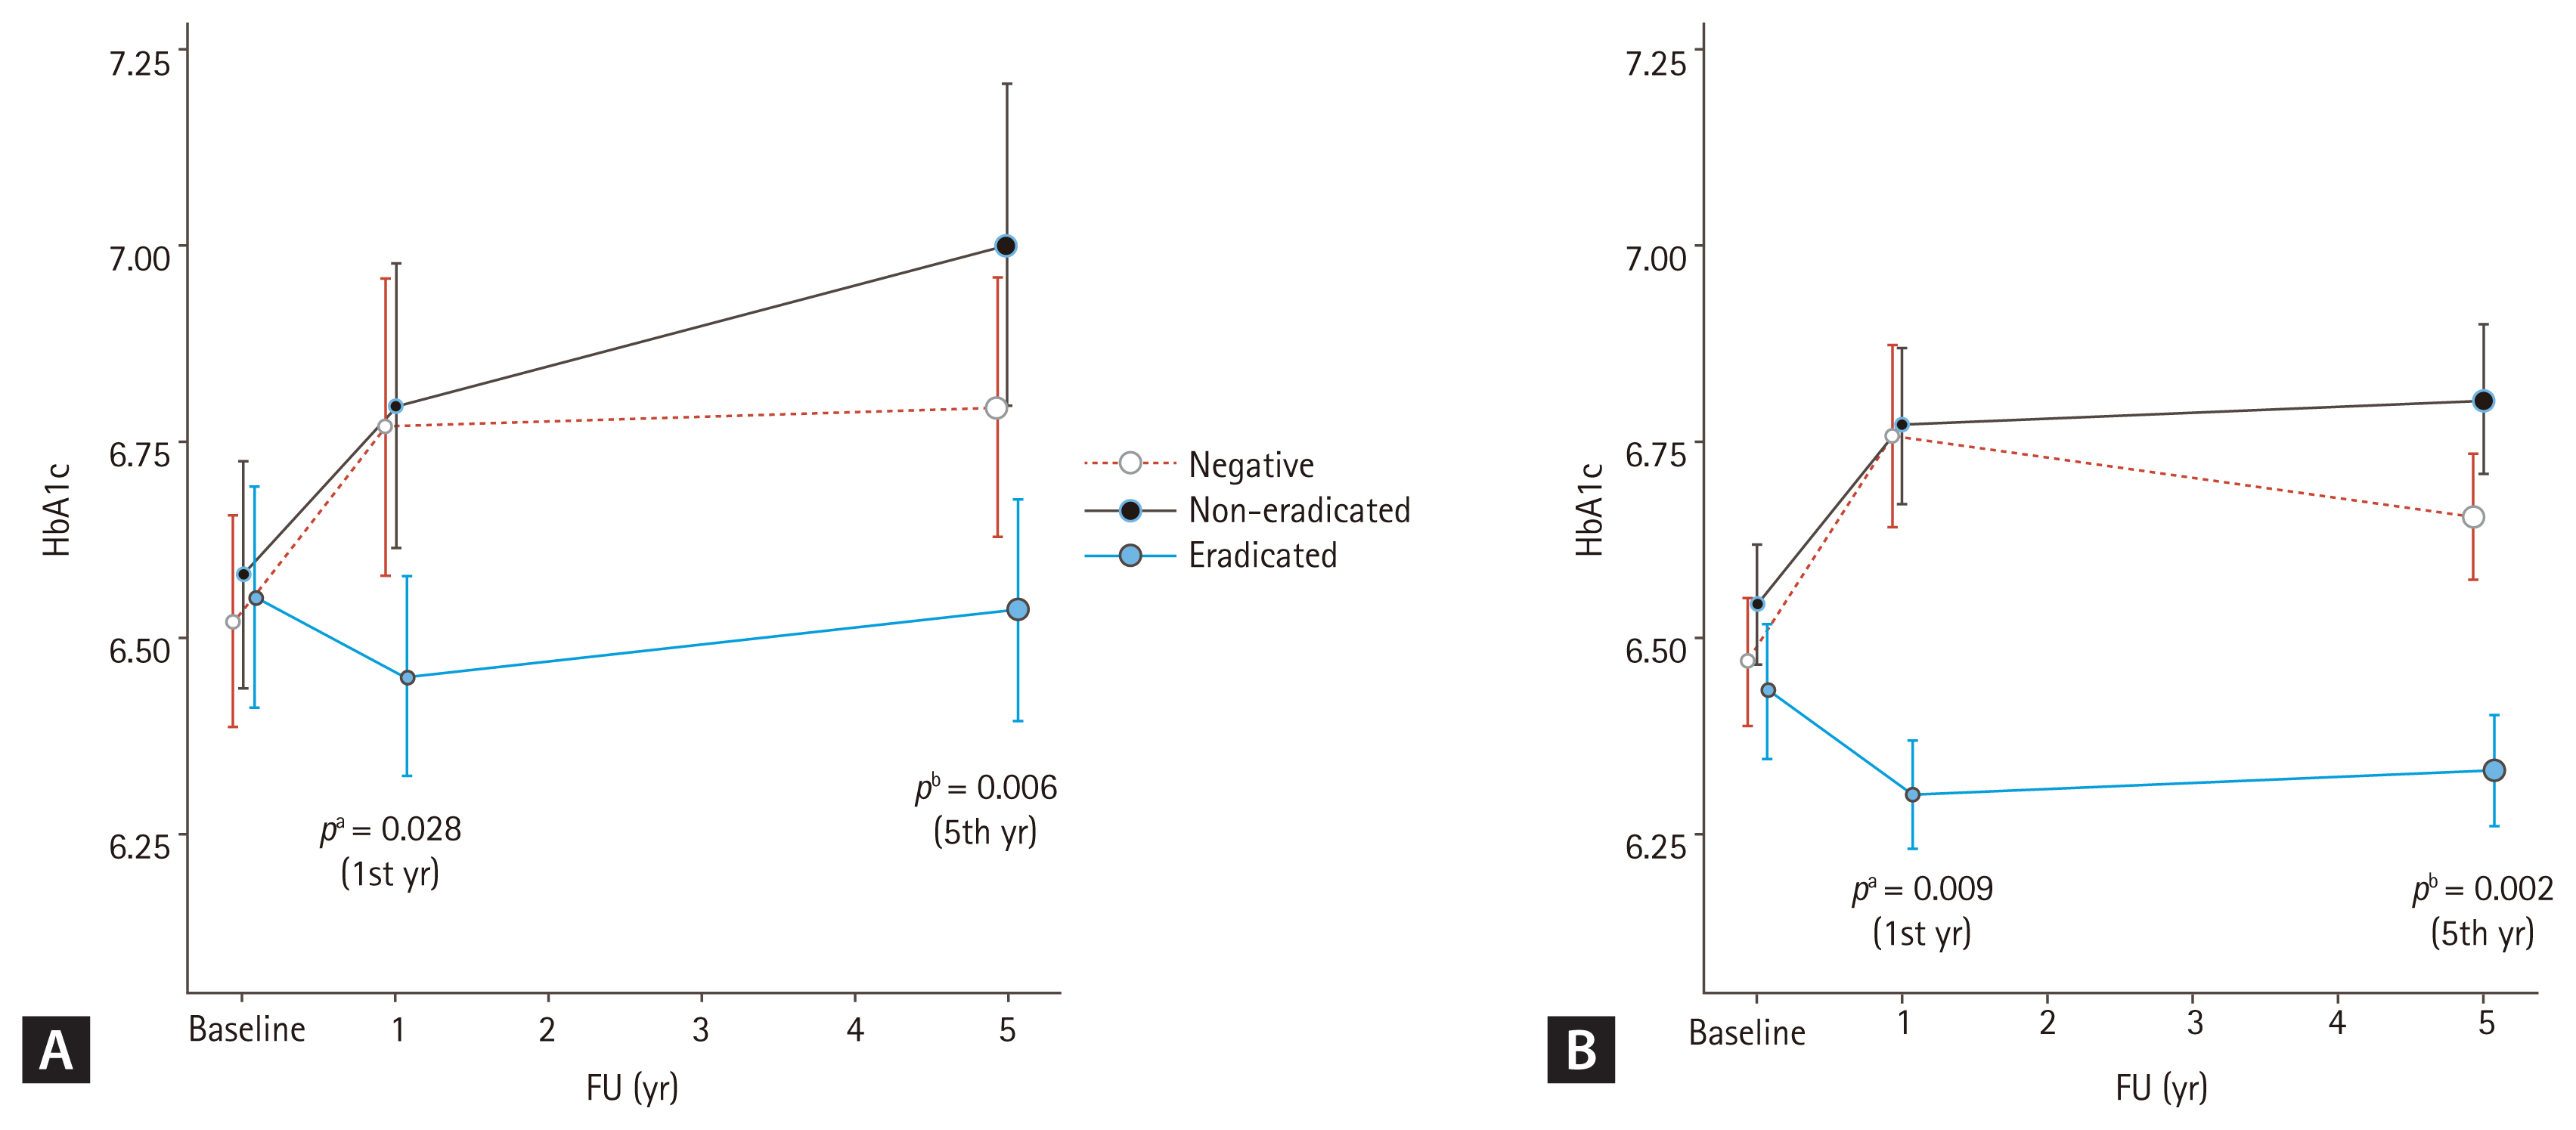
Additionally, we observed a correlation between the follow-up period and group differences after excluding adjusted variables, such as age, sex, smoking, alcohol consumption, hypertension, and dyslipidemia, using a linear mixed model. Table 3 shows the results, with age and follow-up time identified as independent factors associated with increases in A1C (age, p = 0.002; time, p = 0.014), while dyslipidemia as an independent factor associated with decreases in A1C (dyslipidemia, p = 0.028). In the analysis of the relation between time and H. pylori status, a decrease in HbA1c was observed over time in eradicated group compared to non-eradicated group (time & eradicated, p = 0.017). The result of the analysis by dividing the follow-up time periodically (from the baseline to the 1st year of follow-up, and from the 1st year to the 5th year of follow-up) also showed statistically significant decreases in A1C (1st year, p = 0.028; 5th year, p = 0.006) (Fig. 2A).
In the subgroup analysis with respect to age and sex, A1C values were decreased in the subjects who were male or under 65 years of age in the eradicated group (Table 4). In men, A1C levels decreased in the eradicated group compared to the non-eradicated group (1st year, p = 0.023; 5th year, p = 0.007), and to the other two groups (1st year, p = 0.047; 5th year, p = 0.020). In patients under 65 years of age, A1C levels decreased in the eradicated group compared to the non-eradicated group (1st year, p = 0.012; 5th year, p = 0.009) (Table 4), and to the other two groups (1st year, p = 0.028; 5th year, p = 0.006). Moreover, male subjects aged < 65 years showed statistically significant improvement in A1C values in the eradicated group compared to the non-eradication group (1st year, p = 0.008; 5th year, p = 0.007), and to the other two groups (1st year, p = 0.039; 5th year, p = 0.032). In contrast, the changes in A1C values were not statistically different between the three groups in female subjects or age above 65 years (all p > 0.05), although there was a decreasing tendency of A1C level after eradication (Table 4).
We had confirmed the administered medications in subjects. There were 10 and 25 subjects in each 1- and 5-year follow-up group who changed diabetes medication (Supplementary Table 1), which could affect the A1C levels. Even after excluding these subjects, the A1C level was significantly decreased in the eradicated group compared to the non-eradicated group (1st year, p = 0.006; 5th year, p = 0.001), and to the other two groups (1st year, p = 0.005; 5th year, p = 0.002) (Supplementary Table 2). This result was consistent in the linear mixed model which observed a correlation between the follow-up period and group differences after excluding adjusted variables (1st year, p = 0.009; 5th year, p = 0.002) (Fig. 2B).
There were no significant differences in the prescription of statins and proton pump inhibitors (PPIs) between groups, as 27 patients out of 40 H. pylori-negative patients (67.5%), 27 patients out of 34 non-eradicated patients (79.4%), and 38 out of 50 eradicated patients (74%) were found to have been prescribed statins, and 36 out of 40 H. pylori-negative patients (90%), 30 out of 34 non-eradicated patients (79.4%) and 49 out of 50 eradicated patients (98%) were found to have been prescribed PPIs, except for the eradication regimen.
Metabolic parameters and prevalence of MS according to H. pylori eradication
Although metabolic parameters did not display statistically significant differences between the three groups (all p > 0.05), FPG showed a tendency to improve in the eradicated group compared to the other two groups. Similarly, BMI at the 5th year of follow-up, SBP and DBP at the 1st year of follow-up showed tendencies to improve (Supplementary Table 3). In female subjects at the 5th year of follow-up, BMI significantly decreased in the eradicated group compared to the non-eradicated group (p = 0.014), and to the other two groups (p = 0.027), and SBP also decreased in the eradicated group compared to the non-eradicated group (p = 0.020) (Supplementary Table 4). The prevalence of MS has been observed to decrease at the 1st year of follow-up, but with no statistical significance (odds ratio, 1.34; p = 0.535) (Supplementary Table 5).
DISCUSSION
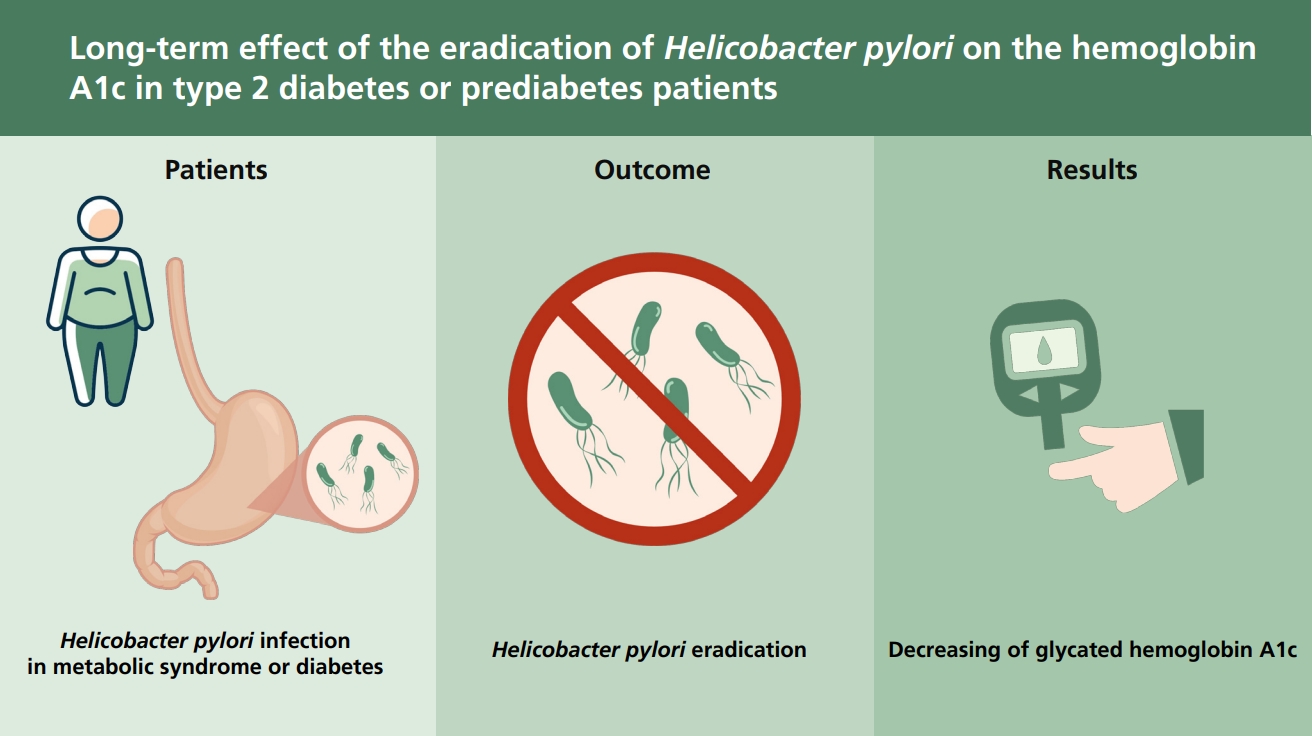
In this long-term follow-up study, we found that H. pylori eradication was related to the decreasing of A1C levels in patients with T2DM or preDM, especially in male and subjects under 65 years of age. To the best of our knowledge, this is the first suggestion of a positive association between H. pylori eradication and improvement in the A1C level in patients with T2DM or preDM over a long period.
This finding is consistent with the results of other studies on the effectiveness of H. pylori eradication over a short period [8,9,21]. As mentioned previously, Dogan et al. [10] reported significant changes of FPG and A1C level between baseline and 6 months after H. pylori eradication in subjects with normal glucose levels. In addition, in 319 patients with T2DM, Cheng et al. [11] demonstrated that the eradicated group had significant within-group and between-group improvements in A1C, compared with the non-eradicated group. Although the exact mechanism remains unknown, researchers have hypothesized potential mechanisms linking H. pylori infection to metabolic parameters. Regarding the pathogenesis proposed to associate H. pylori infection with atherogenic dyslipidemia, experimental investigations have demonstrated that chronic bacterial infections, such as an H. pylori infection, induces the production of proinflammatory cytokines. These cytokines, such as interleukin 1 (IL-1) and IL-6, interferon-α, and tumor necrosis factor-α, can alter lipid metabolism in variety of ways. It also reduces the activation of adipose tissue lipoprotein lipase, triggers hepatic fatty acid synthesis, influences lipolysis, and stimulates 3-hydroxy-3-methylglutaryl-coenzyme A reductase activity in the liver [22]. An H. pylori infection possibly be associated with impaired hepatic IR through the c-Jun/microRNA-203/suppressor of the cytokines that signal three pathway [23]. In addition, inflammatory cytokines induce the phosphorylation of serine/threonine residues in the insulin receptor, preventing its activation and reducing insulin sensitivity [24]. Ghrelin is involved in ingestion, appetite, and nutrition, especially lipid absorption and lipogenesis [25]. It can also regulate insulin sensitivity and stimulate insulin-induced glucose uptake [26], and an H. pylori infection can impair its synthesis [27]. Ghrelin was significantly lower in H. pylori positive than in H. pylori-negative individuals [28]. Low plasma ghrelin levels are associated with elevated FPG levels and IR [29]. Previously, we found that H. pylori eradication upregulates preproghrelin mRNA expression and increases plasma acyl ghrelin levels, contributing to the abatement of postprandial distress symptoms in functional dyspepsia [30]. Another possible explanation involves glucagon-like peptide-1 (GLP-1) and the gut microbiota. GLP-1 regulates glucose homeostasis [31], has trophic effects on pancreatic beta cells [32], reduces acid secretion in the stomach, and delays gastric emptying. It also regulates appetite by inducing a feeling of satiety. Specific bacteria, including Bifidobacterium spp., Lactobacillus spp., and Akkermansia muciniphila spp., contribute to the regulation of incretin hormones such as GLP-1 [33]. A conventional eradication treatment could improve carbohydrate metabolism by increasing GLP-1 secretion, and this change is closely related to alterations in the gut microbiota [8,34], even after a long-term follow-up [35]. These underlying mechanisms support our observation of the effect of H. pylori eradication on the decrease of in A1C levels over a long-term follow-up.
An interesting result of this study is that the positive association between the eradication of H. pylori and A1C levels appeared in patients < 65 years of age. This positive association in younger age is consistent with the results of earlier research on the relationship between H. pylori infection and MS. Chen et al. [36] observed that subjects with MS < 50 years of age had a higher prevalence of H. pylori infection. Similarly, our team demonstrated that the association between H. pylori seropositivity and MS was present in subjects < 65 years of age but disappeared in the older ones [12]. Park et al. [37] reported that the effect of H. pylori eradication on the risk of dyslipidemia was more evident in subjects < 50 years of age. Altogether MS prevalence was not significantly different regardless of the H. pylori serological status in older subject, they tend to have other chronic diseases, such as hypertension, hyperlipidemia, or diabetes, contributing to the development of MS. Regardless of geographic location, the H. pylori infection in most individuals is acquired during early childhood [38]. This chronic H. pylori infection plays an important role in the development of development in the adulthood but this systemic inflammation caused by H. pylori infection may influence MS development somewhat at an early stage, but not in an advanced stage or old age [39]. Thus early eradication of H. pylori is more beneficial in terms of prevention of MS.
Our study also suggested a correlation between sex and A1C levels, specifically in male subjects. These results are compatible with previous studies that showed male subjects are more affected by H. pylori infection than female subjects, such as higher gastric inflammation and activity scores in the antrum with H. pylori infection [40]. According to a large dataset including worldwide mortality and prevalence of cancers, the incidence of gastric cancer in male subjects was about twice as high as in female individuals [41]. Interestingly, in a mouse-model study, severe dysplasia and gastric carcinogenesis predominated in male subjects infected with H. pylori [42]. Furthermore, MS was higher in male subjects, except in the age-group of > 70 years, and the MS in female subjects after definite menopause was higher than in male subjects [12]. Similarly, the H. pylori infection increased the risk of MS in female subjects aged ≥ 50 years [43]. Furthermore, H. pylori infection was a statistically significant predictor of DM incidence in male subjects [6]. The underlying mechanism is related to estrogen. Ovarian-dependent female hormones, such as estradiol (E2), prevent gastric carcinogenesis and inflammation of the gastric tissue in insulin–gastrin mice infected with H. pylori. In addition, exogenous E2 supplementation have shown protective effects against the development of H. pylori-induced gastritis and premalignant lesions through several mechanisms [44]. In the relationship between MS and E2, recent researches showed that TC, LDL-C, and TG were higher in postmenopausal female subjects than in premenopausal females [45]. In addition, hormone therapy with estrogen alone has been associated with decreased TC and LDL-C levels and elevated HDL-C levels [46]. Considering these, we speculate that the difference in the association of H. pylori infection with DM in our study might be related to sex hormone-induced inflammation.
As our study was a retrospective study from a cohort that selected prospectively for 12 years, the number of subjects became small due to exclusion of missing data among metabolic parameters. Small number of subjects that can weaken the conclusion is one of the limitations of this study. However, the patient selection was not biased, and we collected the data on levels of A1C, TC, TG, LDL-C, HDL-C, FPG, BP and the duration and changes of diabetes medication in each subject from the CDW of SNUBH as well as a medical cohort, which were well maintained. We excluded serologic positivity in the H. pylori-negative group, and thus, chronic inflammation can be reliably excluded in that group. Most previous studies compared only before and after treatment in the H. pylori-infected group without a control group with short-term follow-up period. In our study, subjects were divided into H. pylori-negative, H. pylori-positive with non-eradication, and H. pylori-positive with eradication groups, which allowed us to reliably determine the independent effect of H. pylori eradication compared to the other groups. Due to the nature of DM, it is difficult to observe without drug changes during long-term follow-up. In this study, insulin-based patients were excluded to compensate for this limitation, and patients who changed medication during the observation period showed no significant difference with 17.5% in the negative group, 14.7% in the non-eradicated group and 26% in the eradicated group. And additional analyses were conducted after excluding patients who changed oral medications to confirm that the same results were maintained.
IR can be evaluated using homeostasis model assessment of insulin resistance (HOMA-IR), which uses the fasting insulin level with the fasting glucose level. In our study, the fasting insulin level was not measured in all subjects, so HOMA-IR was unable to be calculated. Future study about the effect of H. pylori eradication in IR using HOMA-IR would be needed.
Despite the statistical significance of H. pylori eradication in A1C and some improvement tendency in FPG, BMI, SBP, and DBP, we have failed to show a correlation between the three groups in other metabolic parameters such as TC, TG, LDL-C, HDL-C. It might be explained that, because we selected a study group in patients with T2DM or prediabetes, results may differ from studies in the dyslipidemia group or the normal lipid group. Also studies have been conducted with a relatively small number of subjects, it may not be possible to determine the effectiveness of eradication therapy in dyslipidemia. Therefore, a large-scale study is needed to determine the effect of H. pylori treatment in patients with dyslipidemia in the future.
In conclusion, H. pylori eradication was related to the decreasing of A1C levels over a long-term follow-up period, especially in male subjects and those < 65 years of age. Our study provides new insights into the role of H. pylori eradication and supports the rationale for recommendation of H. pylori eradication therapy in male or young subjects with T2DM or preDM.
 PDF Links
 PubReader
 ePub Link
 Full text via DOI
 Download Citation
 Supplement 1
 Print
Print


