


INTRODUCTION
The aim of palliative care is to improve the quality of life of patients diagnosed with terminal illnesses and to facilitate the provision of psychosocial care to patients and their families. The monitoring of prognostic findings is a challenging but important issue for people with progressive and life-limiting diseases, and various parameters and tools commonly available in palliative care units are used to guide clinicians in the prediction of survival.
Ultrasonography (US) is an imaging method that can be used to identify sarcopenia by evaluating the muscle structure of geriatric patients through the assessment of muscle architecture, such as muscle echogenicity and muscle length, in clinical practice. It is easy to perform in palliative and intensive care units, being a bedside tool [1]. Sarcopenia is a common condition in older adults, and is a multifactorial, global health issue that is associated with chronic diseases and cancer, and that is known to reduce quality of life. Sarcopenia is diagnosed based on assessments of muscle mass, muscle strength, and physical performance through appropriate techniques and follow-up. Patients with sarcopenia have reduced functional capacity in their daily lives, which makes frailty very likely. There are several approaches to the identification of a decrease in skeletal muscle mass, such as computed tomography (CT), magnetic resonance imaging (MRI), dual-energy X-ray absorptiometry (DEXA), bioelectrical impedance (BIA) and anthropometric measurements [2ā5]. While CT, MRI, and BIA are commonly used in studies for the detection of sarcopenia, these techniques are more difficult to apply in palliative care units, being expensive and requiring the patient to be taken to go to the radiology unit for imaging. We opted for the US in the present study for the identification of sarcopenia and the assessment of muscle structure due to its point-of-care applicability, its lack of radiation, and its low cost.
Muscle US allows the sensitive assessment of such muscle-related factors as muscle echogenicity and muscle length. These markers, which can be used to assess the quality and the quantity of the muscle, can be determined from US measurements and may be associated with survival. The present study makes an assessment of several prognostic scales and muscle US measurements that are specific to palliative care clinics for the prediction of 3-month mortality among the patient sample.
METHODS
Patients
This prospective study included 88 patients who were admitted to the palliative care unit of Eskisehir City Hospital for any reason between October 1 and December 31, 2019. The patientās demographics and comorbidities were recorded. Charlsonās Comorbidity Index was used to predict mortality based on the number of comorbidities [6].
Muscle mass
Muscle US was performed within the first 24 hours of admission by B-mode US using a 3ā12 MHz transducer array (Aloka Arietta V60 US machine; Hitachi LTD, Tokyo, Japan) as previously described [1,7]. All US measurements were made by a single researcher with 5-year experience. Patients were positioned supine in 30Ā°-upper body elevation, with legs extended and muscles relaxed. The point that represented 60% of the distance from the anterior superior iliac spine to the superior border of the patella was identified. The cross-sectional area (CSA) and thickness of the rectus femoris (RF) muscle and the thickness, pennation angle and medial fascicle length of the gastrocnemius (GC) muscle in the dominant lower extremity were recorded for all patients. For the imaging of the RF muscle, a point 3/5 along an imaginary line passing through the midpoint of the anterior superior spina iliaca and patella was marked while the patient was in the supine position, with the hip and knee joint at rest in full extension, and the GC muscle measurement was performed while the patient was in the supine position with the knee fully flexed. To avoid any adverse effects on the results, probe compression was kept to a minimum and US gel was used abundantly during the measurements. All measurements were made from the screen of the ultrasound unit at the bedside. To test the accuracy of measurements, patients underwent repeat measurements of the right RF and the GC muscles on two separate occasions on the same day. The intra-class correlation coefficients were 0.92 and 0.96 for the muscle thickness of the GC and RF, respectively, and 0.96 for the RF CSA.
Nutritional status and anthropometry
The Mini-Nutritional Assessment-Short Form (MNA-SF) and Nutrition Risk Screening 2002 (NRS2002) were used for the assessment of nutritional status. Body mass index, mid-arm circumference and calf circumference were measured by a single practitioner during the anthropometric assessment.
Laboratory testing
The complete blood count, blood urea nitrogen, creatinine, total protein, albumin, sodium, potassium, uric acid, vitamin B12, folic acid, C-reactive protein (CRP), and sedimentation levels measured at admission were evaluated.
Prognostic scoring
The palliative performance scale (PPS) score, the palliative prognostic index (PPI), the palliative prognostic (PaP) score and the Karnofsky performance status (KPS) scale score, all of which are used to assess survival, were obtained from the patient files, having been recorded based on information provided by the patients and their relatives during their hospital stay.
The patientās performance status, measured using the KPS score, has been identified as a major predictor of survival. The KPS score is scored from 0% to 100%, based on the patientās performance, where 0% is death and 100% is normal, while the PPS can be considered a modified version of the KPS score that assesses also nutrition and consciousness levels [8]. PPS scores with a low score being proportional to survival time. Only 10% of patients with a PPS score of ā¤ 50% are expected to survive for more than 6 months [9].
The PaP score, is ascertained from anorexia, dyspnea, total white blood-cell count and lymphocyte percentage. It is an assessment that also includes the clinical prediction of patient survival and the KPS score. A higher PaP score predicts a poor 30-day survival [10].
The PPI is an assessment based on the PPS score and oral intake, edema, dyspnea at rest and delirium. If the PPI is > 6, the reported survival is less than 3 weeks, with a sensitivity of 80% and a specificity of 85% [11].
Ethics
The study was approved by both the Turkish Ministry of Health and the Ethics Committee of the Eskisehir Osmangazi University Faculty of Medicine (April 5th, 2021 dated and 07 numbered), and was carried out following the principles of the Declaration of Helsinki and all applicable regulations.
Statistical analysis
Descriptive statistics were presented as frequencies and percentages for categorical variables. Continuous variables were presented as mean (Ā± standard deviation) or median (25thā75th percentiles) depending on their distribution. Pearsonās and Fisherās Exact tests were used to analyze the differences between the groups for categorical variables. A Mann-Whitney U test and Studentās t-test were used to compare non-normally and normally distributed variables, respectively. Univariable and multivariable Cox regression analyses were carried out determine the independent predictors of survival. All statistical analyses were performed using IBM SPSS Statistics (version 27.0; IBM Corp., Armonk, NY, USA) and a value of p < 0.05 was considered statistically significant.
RESULTS
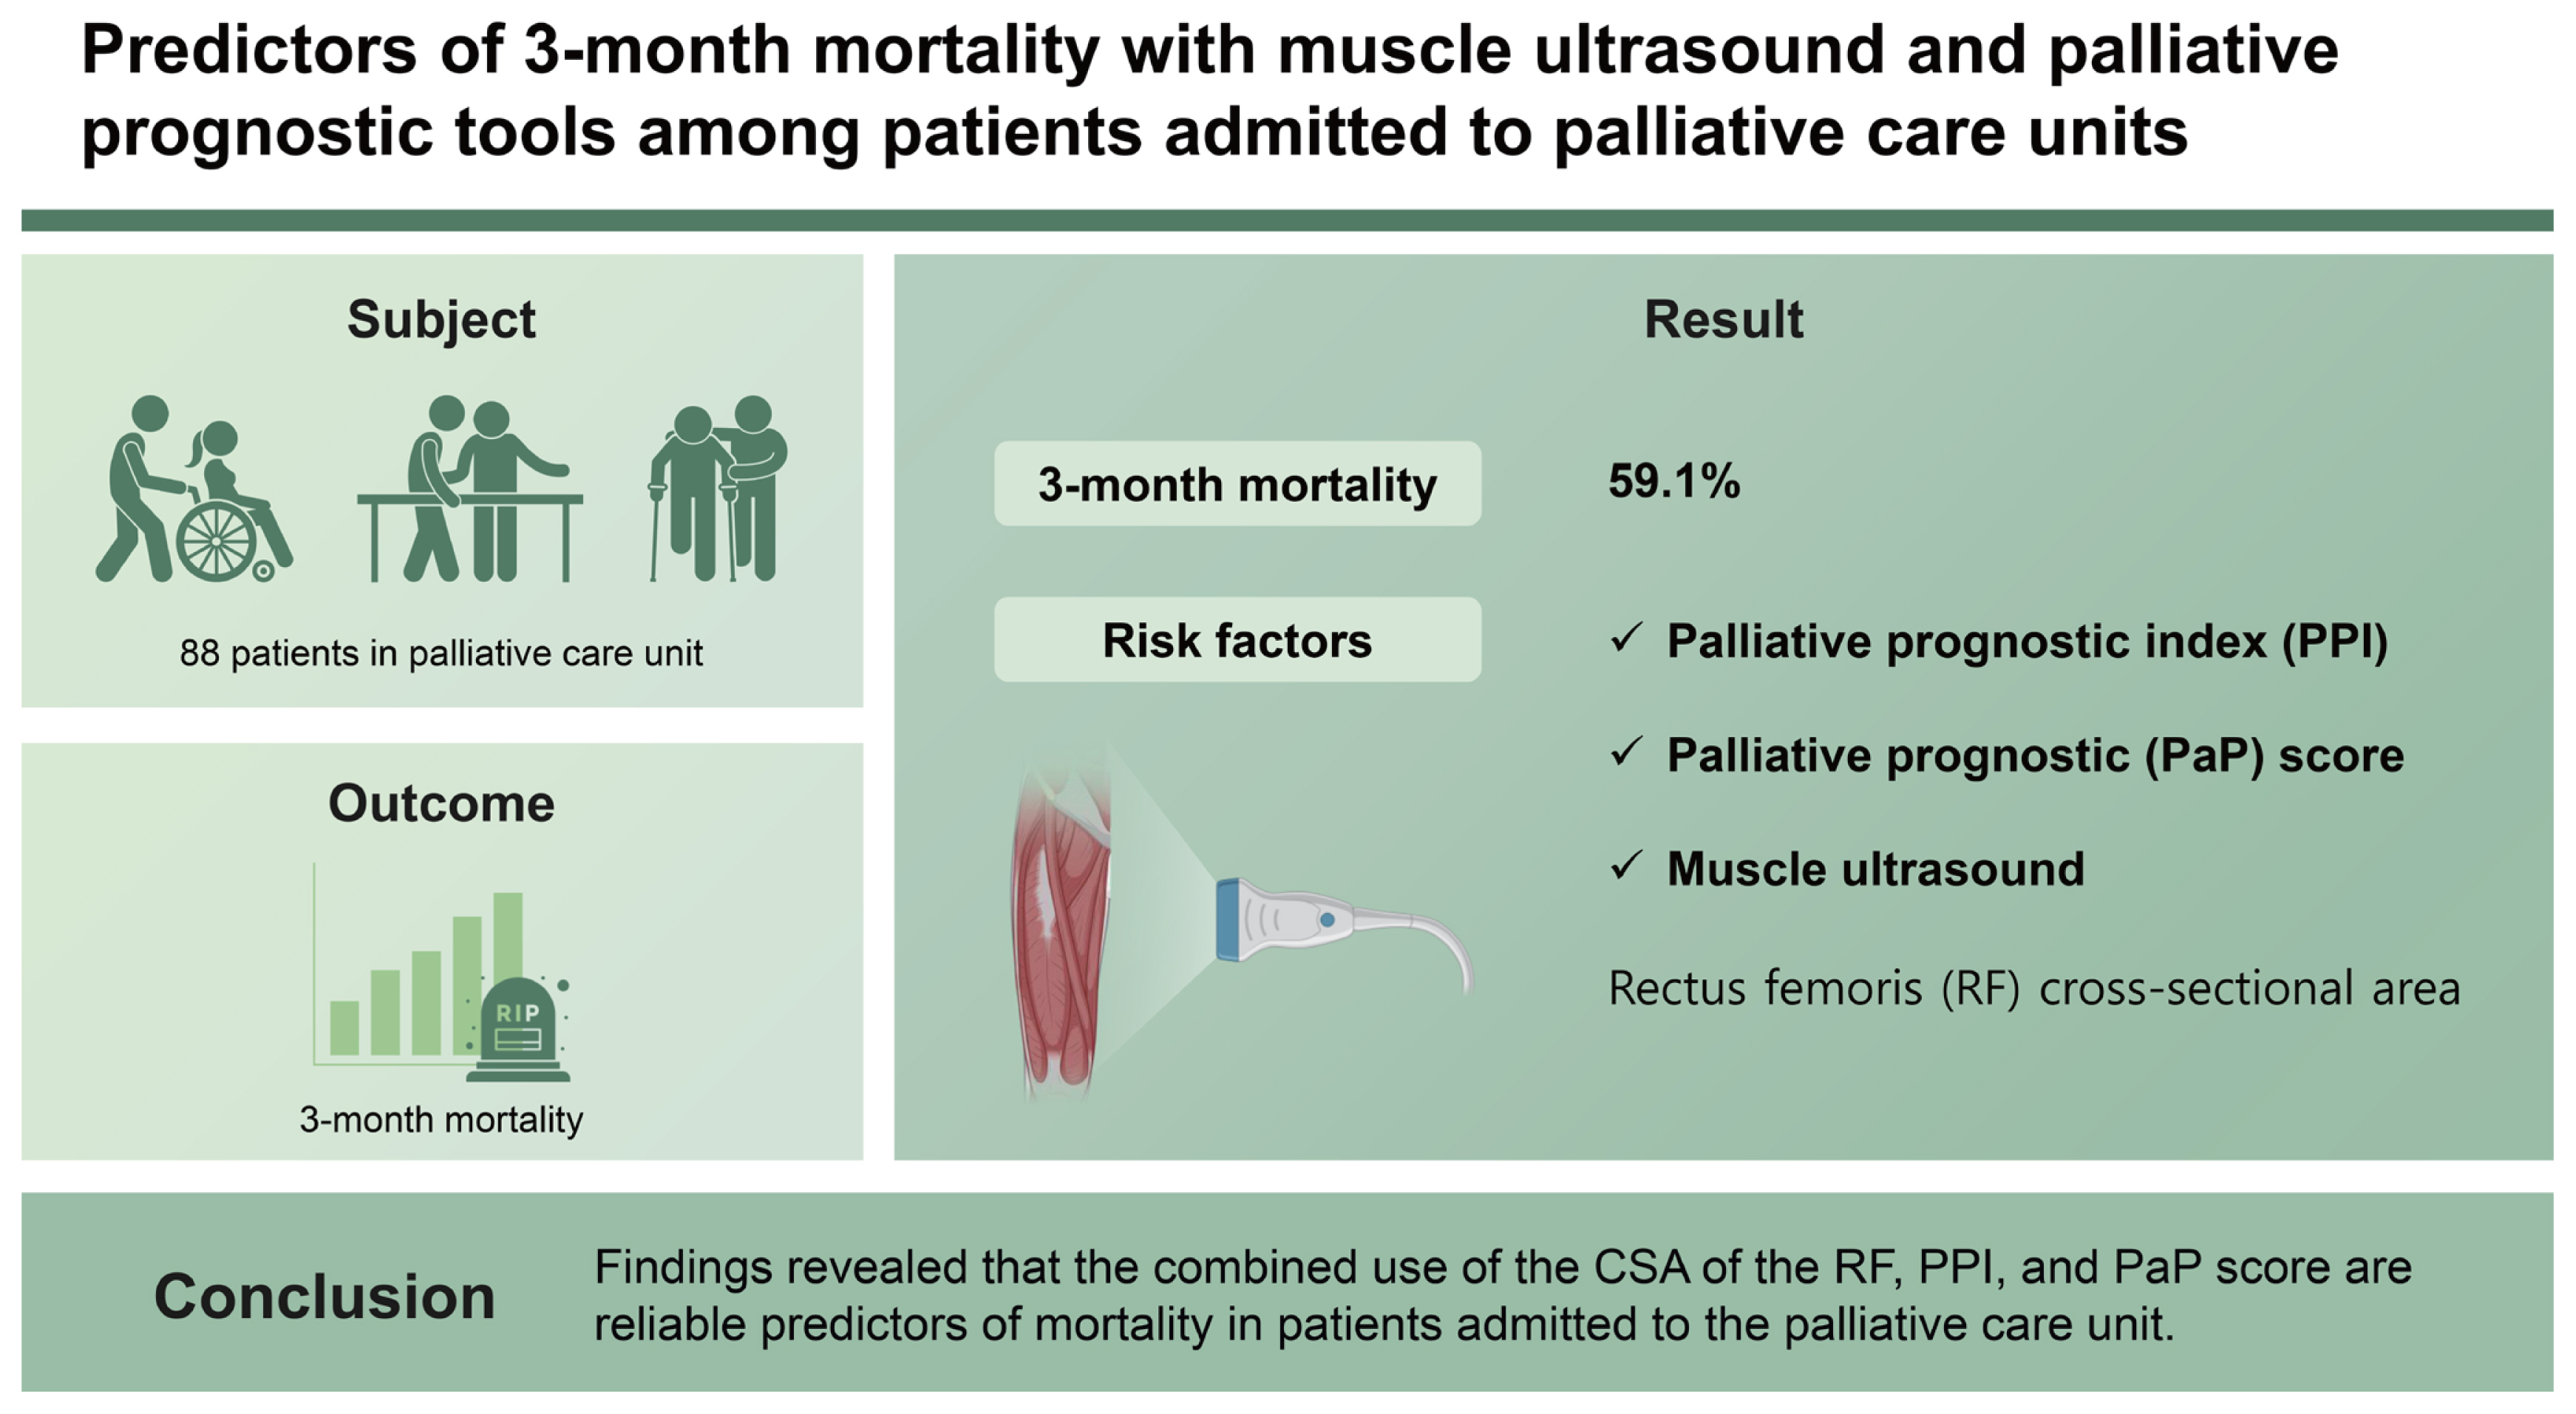
The study included 88 patients with a mean age of 73.6 Ā± 13.3 years, among which 53.4% were male and 46.6% were female. The 3-month mortality was 59.1% (52 deaths).
There was no significant correlation between age groups and gender and mortality. When the patients were divided into geriatric and non-geriatric patients, no significant correlation was found with 3-month mortality (p = 0.091). The average number of comorbidities calculated by Charlsonās comorbidity index was found to be 3.31 (min: 1, max: 9), and it was found that mortality increased as comorbidity increased (p = 0.02). Among the comorbid conditions, only malignancy (p = 0.002) and stroke (p = 0.011) were found to be significant.
Table 1 presents the age, gender, comorbidities, PPS, PPI, and KPS scores, PaP scores, anthropometric assessments, nutritional status, laboratory parameters and muscle US assessment results of the patients who survived and those who died within 3 months. Notably, CRP (p = 0.120) was higher and albumin (p = 0.019) was lower in the non-surviving group. The CRP and albumin levels and the presence of infection during hospitalization were evaluated, revealing no correlation was found between albumin (p = 0.564) and CRP (p = 0.653) levels, whereas a significant correlation between CRP levels and malignancy (p = 0.03).
Considering only the parameters used to predict prognosis in palliative care units, the PPS score and the KPS were lower (p = 0.001) and the PPI and the PaP Score were higher (p = 0.001) in the non-surviving group, and the difference was statistically significant.
Both groups were assessed for nutrition using the short version of the multi-nutritional assessment (MNA-SF) and NRS2002, yielding a mean NRS2002 score of 4 (p = 0.001). The MNA-SF score was lower in the non-surviving group (p = 0.025). The muscle US assessment revealed a lower RF CSA in the non-surviving group (p = 0.031).
A multivariate Cox analysis of age, gender, and the CRP and NRS2002 scores identified the PPI (hazard ratio [HR], 1.15; 95% confidence interval [CI], 1.04ā1.27; p = 0.006) and PaP Score (HR, 1.4; 95% CI, 1.25ā1.53; p = 0.001) as significant predictors of 3-month mortality, while the adjusted Cox proportional analysis identified the CSA of the RF muscle as a further significant predictor of 3-month mortality (HR, 0.75; 95% Cl, 0.56ā0.99; p = 0.05) (Table 2).
DISCUSSION
Sarcopenia is a multifactorial, global health issue that is common in older adults, and is diagnosed based on an assessment of muscle mass, muscle strength and physical performance with the right techniques and follow-up [12]. The European Working Group on Sarcopenia in the Elderly, 2018 (EWGSOP2) consensus uses low muscle strength as the primary parameter of sarcopenia, and muscle strength is considered the most reliable measure of muscle function. Low muscle strength suggests sarcopenia and the diagnosis of sarcopenia is confirmed by the presence of low muscle quantity or quality. Sarcopenia is considered severe when low muscle strength, low muscle quantity, quality and poor physical performance are detected [13].
Grip strength has significant limitations in the establishment of acute and chronic illness, is difficult to assess in patients with delirium or dementia, and can be greatly affected by sedative medications [14]. It is very difficult to determine the physical performance status and grip strength of patients with limited co-operation and those who are immobile. A previous study has reported muscle strength assessment to be an inappropriate approach to the assessment of the physical functionality of patients in critically ill, such as those in the intensive care unit [1].
Patients undergoing treatment in palliative care units are mostly immobile and have very low-performance scores due to terminal illness. The algorithm developed by the EWGSOP recommends a walking test followed by muscle strength assessment to screen for sarcopenia in people over 65 years of age, but direct assessment of muscle mass if walking speed is below 0.8 m/s [4]. In the present study, not walk test could be performed as the majority of patients were immobile, and no muscle strength assessment or hand grip test could be administered due to the lack of patient cooperation, and these can be considered one of the limitations of the present study. It is thus difficult to apply the sarcopenia assessment algorithms recommended for the geriatric population to palliative patients, and so there is a need for the development of novel scales and algorithms for use in palliative care units for the screening and assessment of sarcopenia.
Sarcopenia patients have reduced functional capacity in their daily lives, which makes frailty very likely, and in the presence of frailty, advanced age and immobility, imaging can be considered superior to other methods, being accessible, easily applicable and low-cost. That said, imaging may be difficult to apply in obese patients or those with subcutaneous edema, and the practitioner should have a certain level of experience and competence in the field [15,16]. US can be used in place of CT or MRI for the evaluation of muscle mass in patients admitted to the intensive care unit [17]. Furthermore, unlike DEXA and BIA, ultrasonographic assessments are less affected by the presence of acute and chronic diseases and fluid balance [18].
US allows the measurement of changes in muscle architecture and composition, such as muscle echogenicity, pennation angle and fiber length [15]. According to a meta-analysis published in 2017, lower extremity muscles with anti-gravity functions, such as the quadriceps femoris and GC medialis, were reported to be particularly useful in the diagnosis of sarcopenia in the geriatric population when compared to young adults, and may theoretically be used for the detection of loss of muscle mass and functionality in geriatric patients [18]. The use of US for the evaluation of muscle quality has been described previously in the literature, reporting that muscle echogenicity increases and the pennation angle of the muscles decreases with age on US [15,19]. In 2018, the SARCopenia through UltraSound (SARCUS) working group determined the main parameters that can be evaluated with muscle US for standardisation purposes as muscle thickness, CSA, echo intensity, fascicle length and pennation angle of pennate muscles [20].
There have been studies assessing patients with esophageal and uroepithelial cancers reporting sarcopenia to be associated with short-term survival [21ā23]. In a sarcopenia study evaluating inpatients, it was found that sarcopenic patients had longer hospital stays and higher mortality [24]. Previous studies have evaluated muscle mass and muscle strength together for the diagnosis of sarcopenia, although there have been few studies to date in which sarcopenia is assessed based on muscle US in palliative care units. In the present study made, certain assessments were made to predict prognosis in palliative patients, as well as nutritional assessments, anthropometric measurements and skeletal muscle measurements using muscle US, and compared the 3-month mortality of the patients with low muscle mass. The ultrasonographic assessments of the GC and RF muscles in the present study revealed the GC thickness and pennation angle to be lower and GC fascicle length to be higher in patients who died within 3 months, although the difference was statistically insignificant. In the non-surviving group, sarcopenia was detected based on the low CSA of the RF (p = 0.03), and a relationship was identified between low muscle mass and poor survival, consistent with literature.
In this study, all anthropometric measurements in the surviving and non-surviving patient groups were low, which may be attributable to both the underlying disease and poor nutrition. The nutritional status of the patients was measured using the MNA-SF test and the NRS2002 form, and while the MNA-SF score was lower in the non-surviving group, the NRS2002 score was similar in both groups. It was thus concluded that both groups needed nutritional support, although nutritional status was poorer in the non-surviving group. Despite the lack of a statistically significant difference in nutritional status between the non-surviving and surviving groups in the present study, it can be said that palliative patients generally need nutritional support [2], as the underlying disease and the clinical condition necessitating hospitalization may lead to low nutritional levels, and patients with a poor nutritional level may also have increased muscle breakdown. This can be explained by the nutritional status and the underlying diseases among palliative patients triggering both primary and secondary sarcopenia. The measurement results below the sarcopenia threshold in the anthropometric assessment in the study can also be explained by the need for support in the improvement of nutritional status.
The high level of inflammation markers in sarcopenia can be attributed to an increase in oxidative stress and inflammatory cytokines, and the possible mechanisms underlying sarcopenia. For inflammation included in the GLIM criteria developed for the malnutrition definition published in 2019, CRP has been identified as a laboratory parameter that promotes inflammation [25]. The lower albumin level in the non-surviving group can be explained by the negative acute phase response and the low nutritional level, secondary to inflammation of underlying diseases. In a study of hematological cancers published in 2020, malnutrition was associated with increased mortality independent of age and duration of diagnosis, while low albumin and high CRP levels were found to significantly increase the risk of mortality [26]. In this study, it was found that the poor nutritional status determined by NRS2002, low albumin and high CRP levels were detected in patients who died within 3 months. No correlation was found between high CRP levels and active infection during hospitalization, although CRP levels were found to be higher in patients with malignancy. CRP levels were found to be above normal in both groups, which may be attributed to an underlying malignancy or inflammation.
Considering only the parameters used to predict prognosis in palliative care units, our study identified that the KPS score and the PPS score were lower and the PPI and the PaP score were higher in the non-surviving group. The scores and indices used to determine prognosis in this study were in concur with the findings of previous studies in literature [8,10,11]. The combination of certain clinical findings and performance scales may increase the predictive value of prognostic approaches. It is clearly apparent that performance status is related to survival. The present study found the scores and indices used to predict survival to be statistically significantly different in patients who died within 3 months when compared to the surviving group.
The present study evaluates the prediction of mortality based on muscle assessment, nutritional status, anthropometric measurements and scales to identify the most predictive parameter of mortality among the RF CSA, the PPI and PaP score. The PaP score and the PPI were included in the model as they are more inclusive than the KPS score and the PPS score.
Considering the similarity of the age, gender, NRS2002 score and CRP levels, the model yielded a HR of 1.15 for PPI at 95% CI, a HR of 1.4 for PaP score, and a HR of 0.83 for the RF surface area assessed by US. A previous study involving surgical intensive care patients established a correlation between the RF muscle surface area and frailty index, and suggested that sarcopenia diagnosed by US could be a biomarker for frailty and poor nutritional status [1].
Muscle US can be easily applied in palliative care units for the assessment of sarcopenia and for the prediction of the effect on mortality, with the benefits of easy applicability, low-cost and lack of radiation risk. We believe that certain scales used for prognosis and for the ultrasonographic assessment of muscle mass and quality can guide clinicians both in predicting survival and in the identification of the optimum medical, nutritional and supportive treatments for sarcopenia. We further believe that ultrasonographic measurements of muscle mass may be used in future studies with modified scales for specific use in palliative settings for the assessment of sarcopenia.
Patients were immobile and poorly co-operated group in palliative care service. Physical performance status and muscle strength measured based on grip strength tests could not be ascertained in the present study due to the immobility and limited co-operation of the patients. Consequently, muscle US was used to assess muscle quality and mass for the evaluation of sarcopenia. A further limitation of this study is that it was conducted in a single center in Turkey.
KEY MESSAGE
1. Due to the presence of immobile patients in palliative care centers, muscle ultrasonography (US) should be preferred in the assessment of sarcopenia.
2. Palliative prognostic indices that can be used with muscle US may be a guide in predicting mortality. Especially the combined use of the cross-sectional area of the rectus femoris and the palliative prognostic index and the palliative prognostic score are reliable predictors of mortality in patients admitted to the palliative care unit.
 PDF Links
 PubReader
 ePub Link
 Full text via DOI
 Download Citation
 Print
Print


