High 24-Hour Urinary C-Peptide Excretion in Non-Insulin Dependent Diabetes Mellitus*
Article information
Abstract
The 24-hour urinary C-peptide excretion (UCPR) is a useful means of estimating total daily insulin secretion. To evaluate the daily insulin secretion rate in non-insulin dependent diabetes mellitus (NIDDM), we measured UCPR in 22 patients with NIDDM and 18 normal subjects. The mean (±SD) UCPR in the patients with NIDDM was 115.4±40.2 ug/day and that in normal subjects was 56.7±22.0 ug/day respectively with significantly higher values in the patients with NIDDM (P<0.0001). UCPR was positively correlated with body fat mass determined by measurement of skin fold thickness in both groups [r=0.51 in patients with NIDDM (n=22; p<0.02) and r=0.55 in normal subjects (n=18; p<0.02)], and was higher in NIDDM patients, even with the same degree of fat mass. There was no significant correlation between UCPR and body muscle mass both in the patients with NIDDM and normal subjects [r=0.16 in patients with NIDDM (n=22; p>0.1) and r=0.16 in normal subjects (n=18; p>0.1)]. This result suggested that the total daily insulin secretion rate in NIDDM be increased to compensate insulin resistance, especially that induced by adipose tissues.
INTRODUCTION
Insulin secretion in non-insulin dependent diabetes mellitus (NIDDM) has been the subject of numerous investigations and many controversies. There is now fairly general agreement that acute insulin response to either oral or intravenous glucose loading is blunted in NIDDM1–4), but the second (late) phase of insulin response in an oral glucose loading is usually higher in NIDDM than that in normal controls1,5). The question as to whether the total daily insulin secretion rate in NIDDM is altered is still not answered. Attempts to measure daily insulin secretion rate in NIDDM have produced quite conflicting results6).
Measurement of UCPR has been proven to be a useful means of estimating integrated secretion of endogenous insulin secretion over 24 hours7,8). It was shown that UCPR was positively correlated with body weight in normal subjects8). However, there have been no studies seeking the relationship of 24-hour urinary excretion rate and the mass of individual tissues such as muscle and fat, especially in NIDDM. Our assumption is that if insulin resistance in individual tissue (s) has a pathogenetic role in NIDDM, insulin secretion increases along with the insulin resistance, and the mass of tissue (s) responsible for insulin resistance should be correlated with the insulin secretion rate.
The aims of the present study are (1) to estimate total daily insulin secretion rate in the patients with NIDDM by measuring 24-hour urinary excretion rate of C-peptide, and (2) to define the relationship between insulin secretion rate and the mass of tissues which are possible sites of insulin resistance; namely muscle and adipose tissue.
Muscle mass was determined by the use of muscle area of upper extremity, and adipose tissue was measured from skin fold thickness. Both of these methods were validated10–12).
MATERIALS AND METHODS
1. Subjects
The subject population consisted of 22 patients with NIDDM and 18 healthy control subjects. The clinical characteristics of the subjects were summarized in Table 1. The diabetic group was composed of 11 males and 11 females (aged 48±11 yr., range 28–68), the control group of 10 males and 8 females (aged 33±11 yr., range 22–50). Actual body weights in the two groups showed averages of 61.2±9.7 kg (range 42–86, NIDDM patients) and 63.7±13.2 kg (range 45–103, normal subjects), respectively. Fasting glucose concentration was 228±15 mg/dl (range 140–340) in patients with NIDDM whereas 91±2 mg/dl (range 76–107) in normal subjects. All subjects were on weight-maintaining diet.
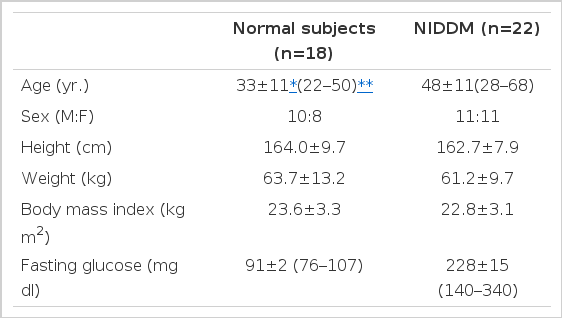
Clinical Characteristics of the Subjects
Diagnosis of diabetes mellitus was made by the criteria of National Diabetes Data Group13). No patients had history of previous insulin injection and patients with chronic microvascular complications such as retinopathy or nephropathy, and those with urinary tract infections were excluded.
Normal controls were comprised of medical doctors, medical students and hospital employees. They had no past history of diabetes mellitus, renal or endocrine disorders. All drugs that might influence insulin secretion were withheld at least 3 days before study and all tests were performed after an overnight (12–14 hours) fast.
2. Measurement of 24-hour Urinary C-peptide Excretion Rate
Whole 24 hour urine was collected in plastic container coated with bovine serum albumin and refrigerated at 4°C during the collection period. Following the completion of collection, an aliquot of urine was stored at −20°C until assayed. Urinary C-peptide concentration was measured by radioimmunoassay using a kit from Daiichi radioisotope laboratory (Japan).
3. Estimation of Body Muscle Mass
The muscle area of the upper extremity (AMA) was estimated from measures of upper arm circumference (AC, mm) and triceps skinfold thickness (TSF, mm). Skinfold thicknesses were determined using skinfold caliper (Fat-0 meter, Health & Education Services, Chicago, U.S.A.).
All measurements were done in triplicate by the same person on the dominant side of the body. AMA was calculated according to the formula of Jelliffe et al.10) as follows:
Total body muscle mass (TBM) was estimated according to the formula of Heymsfield et al.11)
4. Estimation of Body Fat Mass
Mass of body fat was estimated from the sum of six skinfolds measured from triceps, subscapular, pectoral, umbilical, suprailiac and thigh regions. The values of the six skinfolds were summed up and 8 mm was subtracted to correct for the non-adipose content of skinfolds.
The corrected skinfold total was divided by body weight to obtain skin fold/body weight ratio (R)12). Absolute fat mass was calculated according to the formula as follows.
5. Statistical Analysis
Data in the text were given as mean±SD, and data in figures as mean±SEM. Statistical comparison between different groups was performed by the unpaired t-test. Linear regression analysis was employed in evaluating the relationships between the variables.
RESULTS
The mean (±SD) UCPR in the patients with NIDDM was 115.4±40.2 ug/day and that in normal subjects was 56.7±22.0 ug/day thus showing significantly higher values in the patients with NIDDM (p<0.0001) (Table 2, Fig. 1).
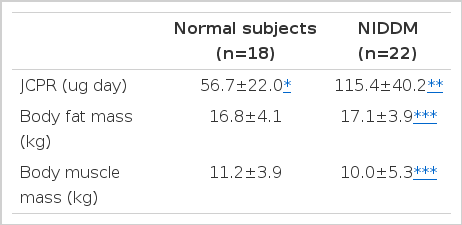
Comparison of UCPR, Body Fat Mass and Body Muscle Mass between Normal Subjects and Patients with NIDDM
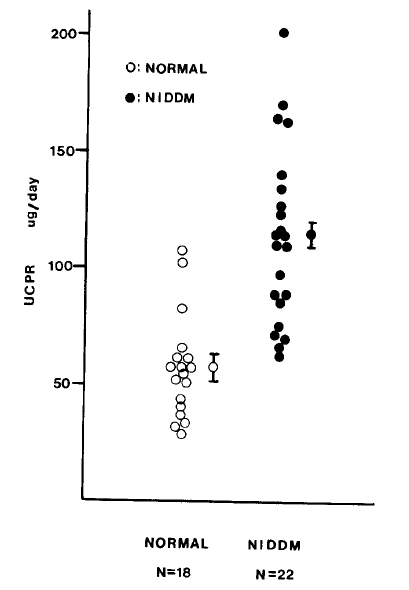
24-hour urinary C-peptide excretion in normal and patients with NIDDM (Mean±SEM).
The body fat mass and the body muscle mass did not differ in both groups (Table 2).
There was good positive relationship between UCPR and body fat mass in both groups [r=0.51 in patients with NIDDM (n=22; p<0.02) and r=0.55 in normal subjects (n=18; p<0.02)]. UCPR in patients with NIDDM was higher than that in normal subjects, even with the same degree of fat mass (Fig. 2). In contrast no significant correlation was noted between UCPR and body muscle mass both in patients with NIDDM and normal subjects [r=0.16 in patients with NIDDM (n=22; p>0.1) and r=0.16 in normal subjects (n=18; p>0.1)] (Fig. 3).
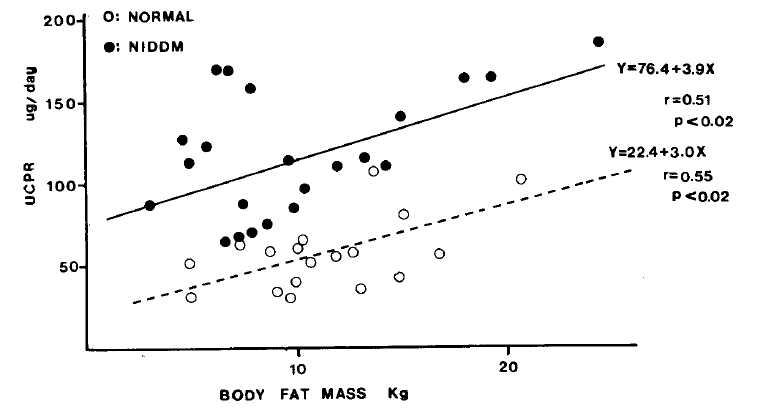
The relationship between UCPR and the body fat mass.

The relationship between UCPR and the body muscle mass.
DISCUSSION
The question as to whether total daily insulin secretion rate in NIDDM is altered can only be answered by direct measurement of insulin secretion rate either by continuous blood sampling or frequent blood sampling throughout a day for the measurement of plasma insulin and C-peptide concentrations. However, these methods of direct measurement of insulin secretion rate are both cumbersome and time-consuming. Meistas et al.7,8) have shown that there was a good correlation between the 24-hour urinary excretion rate of C-peptide and the 24-hour integrated concentrations of insulin and C-peptide concentrations in plasma. It was assumed that measurement of urinary excretion of C-peptide could accurately reflect integrated insulin secretion rate over 24-hours and could replace rather inconvenient method of frequent blood samplings.
Present study demonstrated that 24-hour urinary excretion of C-peptide was significantly higher in the patients with NIDDM than that in normal subjects. This result is consistent with that of Bantle et al.14), but is in contrast with that of Matsuda et al.15) in which UCPR was almost the same in normal subjects as in patients with NIDDM. The causes of the difference between the present study and that of Matusda et al. are not clear. One possible explanation might be the difference of the time on sample collection in these two studies. Urine samples for C-peptide were collected after blood glucose levels were controlled by various methods of treatment in the study by Matsuda et al.. In contrast, we measured UCPR before the blood glucose was controlled.
The basal insulin secretion rate is primarily regulaled by plasma glucose levels. Hyperglycemia induces insulin secretion and hyperinsulinemia returns plasma glucose level to euglycemia. This feedback mechanism is complete in normal subjects, and basal plasma glucose levels are maintained at euglycemia. In contrast, in the patients with NIDDM, the pancreas is not secreting enough insulin to maintain euglycemia In this regard, plasma insulin levels in diabetics are deficient relative to their blood glucose levels. Even in this instance, hyperglycemia induces insulin secretion which in turn compensates for decreased insulin action in these patients16).
Hyperglycemia potentiates acute insulin response to nonglucose secretagogue, which is important in maintaining basal insulin secretion in the patients with NIDDM17). Since diabetes mellitus is a state characterized by hyperglycemia, we measured UCPR before treatment when the blood glucose level was not controlled. Additional studies are needed to clarify whether the time difference of sample collection is the cause of the difference in the results of the present study and other study.
The sites and mechanisms of insulin resistance in NIDDM are not clear now. De Fronzo et al.18) recently demonstrated by euglycemic hyperinsulinemic clamp technique that about 90% of the infused glucose was disposed of by peripheral tissues, most importantly by muscle. They reported that adipose tissue took up relatively little of a glucose load compared to muscle, and they concluded that muscle was the most important site of insulin resistance in NIDDM. However, this study only investigated the insulin’s effect on glucose uptake under hyperinsulinemia (<100 uU/ml). The sensitivities of individual tissues to insulin are varied. Indeed, glucose uptake by adipocytes is almost saturable at insulin levels of about 100 uU/ml whereas that by muscle is saturable at much higher insulin level19). Thus it is not reasonable to compare in vivo glucose uptake of different tissues at a fixed insulin level.
Our data showed that 24-hour urinary C-peptide excretion rate was positively correlated with body fat mass determined by measurement of skin fold thicknesses in both groups. UCPR was higher in the patients with NIDDM than that in normal subjects, even with the same degree of fat mass.
These findings suggested that insulin be secreted to the rate at which body fat mass is maintained, and more insulin required to maintain the same body fat mass in NIDDM as in normal subjects.
It was repeatedly demonstrated that the degree of obesity was negatively related with insulin sensitivity20) and that reduction of fat tissues in NIDDM patients resulted in improved insulin sensitivity. These findings are consistent with our observation that body fat mass is important in the genesis of insulin resistance.
In conclusion, total daily insulin secretion rate measured by 24-hour urinary excretion of C-peptide was higher in patients with NIDDM compared with normal subjects. This increased secretion of insulin seems to compensate insulin resistance in these patients, especially that induced by adipose tissue.
Notes
This work was supported in part by special research grants from Seoul National University Hospital (1985).