Comparison of Asthma Phenotypes Using Different Sensitizing Protocols in Mice
Article information
Abstract
Background
Several methods have been reported to induce asthmatic reactions in mice but few studies have compared their efficiency. We evaluated the efficiency of the protocols frequently used in the literature.
Methods
BALB/c mice were sensitized to ovalbumin (OVA) by intraperitoneal injection; 1] Once a week for two weeks using OVA with alum (IPOA-2) or without (IPO-2), and provocation on days 28-30 by 1% OVA inhalation; 2] seven times for two weeks by OVA with alum (IPOA-7) or without (IPO-7) and provocation by 1% OVA inhalation on days 42-44. 3] Sensitization by 1% OVA inhalation for ten days (IHO-10) and provocation by 1% OVA inhalation on days 28-30. After the last challenge, airway hyperresponsiveness was measured with single chamber plethysmography 24 hours later and mice were sacrificed 48 hours later.
Results
Airway hyperresponsiveness, BALF eosinophilia, airway inflammation, and OVA-specific IgE and IgG1 production were effectively induced in IPOA-2, IPOA-7, and IPO-7. However, these phenotypes were not induced in IPO-2 (except for increased BALF eosinophils) or IHO-10 (except for an increased OVA-specific IgG1 level).
Conclusion
The intraperitoneal injections of OVA with alum once a week for two weeks proved to be the most efficient sensitization method of inducing an asthmatic reaction in mice.
INTRODUCTION
Asthma is a chronic inflammatory airway disease characterized by eosinophilic infiltration, airway hyperresponsiveness and reversible airway obstruction. In recent years, the prevalence of asthma has been increasing worldwide, including in Korea1). Asthma causes significant morbidity and in some cases, mortality. Due to the lower quality of life and economic burden, asthma is regarded as one of the most important public health problems, particularly in industrialized countries.
Animal models of asthma are essential to elucidate pathogenic mechanisms and to develop new treatment modalities. Among them, the murine model has many advantages because of its well-characterized immune system, the availability of many tools to manipulate the immunological process, the availability of numerous genetically modified transgenic or knockout strains, and the low cost of study. Many experimental protocols have been developed for the induction of asthmatic reaction in mice2-9).
Various types of allergens such as ovalbumin, house dust mite, ragweed, and Schistosoma mansoni eggs with various dosages are used for the sensitization and challenge with or without adjuvants such as alum or lipopolysaccharides. Different routes of sensitization are used, including intraperitoneal, intranasal, or inhalation methods with various time schedules. Different routes of challenge are also used, including inhalation, intranasal or intratracheal methods with various time schedules2-9).
For the measurement of airway hyperresponsiveness, various ex vivo or in vivo methods are used2). The ex vivo technique measures the contractility of dissected tracheal smooth muscle stimulated by electricity or methacholine. There are two types of in vivo methods in measuring airway hyperresponsiveness. The first method examines the airway pressure or insufflation overflow pressure of an anesthetized animal with a transtracheal cannula and body plethysmography. The second in vivo method measures a mathematically derived parameter called the enhanced pause (Penh) that reflects airway obstruction with unanesthetized and unrestrained animals in a plethysmography box2).
Strains of inbred mice may show differences in airway responsiveness, IgE production, and cellular and cytokine responses2). BALB/c and C5BL/6 mice are frequently used for asthma model.
However, few studies have been performed comparing the efficiencey of sentisization and challenge methods with the same evaluation system; allergen, strain of mice, and device for the measurement of airway hyperresponsiveness9). The aim of this study was to evaluate the efficiency of the protocols frequently used to induce asthmatic reaction in the medical literature and to recommend the most efficient method.
MATERIALS AND METHODS
Animals
Forty-four female BALB/c mice aged 6-7 weeks were used in this study. The mice were purchased from Dae Han Biolink (Choongbuk, Korea) and kept in specific pathogen-free conditions in the preclinical center of the Clinical Research Institute of Seoul National University Hospital (Seoul, Korea). None of the mice were exposed to ovalbumin (OVA) before the experiment. The study was approved by the appropriate committees on animal experimentation at our institution and performed according to the guide for the care and use of laboratory animals issued by the Institute of Laboratory Animal Resources Commission on Life Sciences, National Research Council, USA10).
Protocols for sensitization and OVA-specific bronchial challenge
The protocols used for sensitization and bronchial challenge were designed according our studies and those previously recommended with some modifications4-6). Ten or 20 µg of ovalbumin (OVA, ICN, Costa Mesa, USA) with or without 2 mg of alum hydroxide (alum, Sigma, St. Louis, USA) was dissolved in phosphate buffered saline (PBS), and a total of 200 or 500 µL was injected intraperitoneally. Inhalation challenge was performed with 1% OVA in a 5.9 L Pyrex glass box for 30 min daily and for 3 consecutive days with an ultrasonic nebulizer (NE-U12, Omron, Japan). The mice were divided into eight groups according to the protocols (Figure 1).
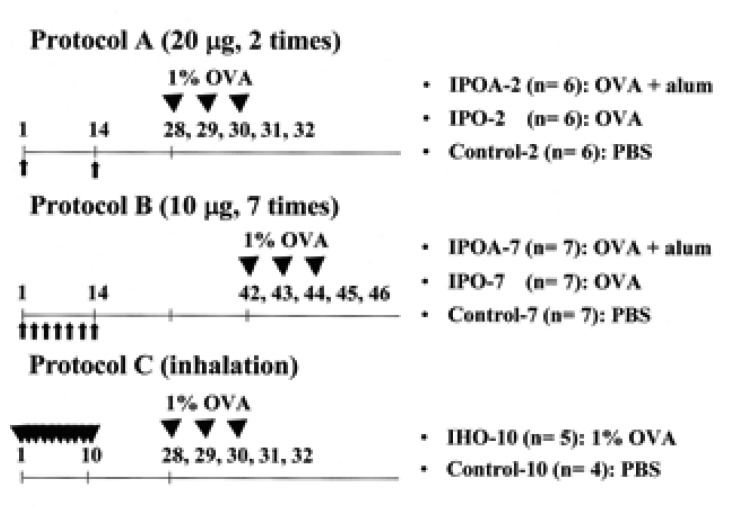
Experimental protocols and groups. Protocol A: sensitization using OVA with (IPOA-2) or without (IPO-2) alum by intraperitoneal injection on days 1 and 14, and inhalation challenge with 1% OVA on days 28, 29, and 30. Protocol B: sensitization using OVA with (IPOA-7) or without (IPO-7) alum by intraperitoneal injection on alternative days (seven times) for 2 weeks and inhalation challenge with 1% OVA on days 42, 43, 44. Protocol C: sensitization by 20-min inhalation of 1% OVA (IHO-10) or PBS daily for 10 days and inhalation challenge with 1% OVA on days 28, 29, and 30. OVA: ovalbumin.
Protocol A (sensitization by intraperitoneal injection on days 1 and 14, and inhalation challenge with 1% OVA on days 28, 29, and 30): In the first group, (IPOA-2, n=6) the mice were intraperitoneally sensitized with OVA (20 µg/200 µL) and with alum. In the second group (IPO-2, n=6), the mice were sensitized with OVA (20 µg/200 µL) but without alum. The third group (Control-2, n= 6) was injected with PBS only (200 µL). Protocol B (sensitization by intraperitoneal injection on alternative days (seven times) for 2 weeks and inhalation challenge with 1% OVA on days 42, 43, 44): In the fourth group (IPOA-7, n=7), the mice were intraperitoneally sensitized with OVA (10 µg/500 µL) and with alum. In the fifth group (IPO-7, n=7), the mice were sensitized with OVA (10 µg/500 µL) but without alum. The sixth group (Control-7, n=7) was injected with PBS (500 µL). Protocol C (sensitization by 20-min inhalation of 1% OVA daily for 10 days and inhalation challenge with 1% OVA on days 28, 29, and 30): The seventh group (IHO-10, n=5) was sensitized with 1% OVA and the eighth group (Control-10, n=4) with PBS.
Evaluation of asthma phenotypes
1) Airway hyperresponsiveness
Twenty-four hours after the final OVA inhalation, airway hyperresponsiveness was assessed by methacholine-induced airflow obstruction using single chamber whole body plethysmography (Allmedicus, Anyang, Korea) as previously described3). Increases in enhanced pause (Penh) were measured as an index of airway resistance {Penh = [(Te / RT 1) (PEF/PIF)], where Penh = enhanced pause, Te = expiratory time (s), RT = relaxation time (s), PEF = peak expiratory flow (mL/s), PIF = peak inspiratory flow (mL/s)}. Increasing doses of methacholine (ranging from 2.5 to 50 mg/mL; Sigma, St. Louis, USA) were administered by nebulization for 3 minutes, and the values of Penh were calculated over the subsequent 3 minutes. During the experiment, the activity of the mice and the barometric plethysmograph flow tracings were monitored. To quantify the dose-response to methacholine, the linear regression of Penh on log scale was calculated for individual mice. The log dose corresponding to an increase in Penh of 200% was determined, and the average log doses of the different groups were compared. The results are presented as PC200, which is the concentration of methacholine required to increase the baseline Penh by 200%.
2) Inflammatory cells in bronchoalveolar lavage
Forty-eight hours after the last OVA challenge, mice tracheae were cannulated and the lungs were lavaged five times with 0.4 mL aliquots of pyrogen-free saline. After Diff-quikR staining (Dade Behring AG, Dudingen, Switzerland) of lung lavage cells in a cytospin preparation, two investigators counted more than 300 inflammatory cells under a light microscope and classified them as macrophages, lymphocytes, neutrophils, and eosinophils.
3) Lung histology
Following BAL, the lungs were infused with 10% formalin and embedded in paraffin. Lung sections were stained with hematoxylin and eosin and PAS stain. Slides were assessed by light microscopy and the number of eosinophils was counted at 10 randomly-selected bronchi for each mouse in a high power field (×400). The investigators who reviewed the slides were blinded as to which preparation they were scoring.
4) Anti-ovalbumin specific IgE and IgG1
Forty-eight hours after the last OVA challenge, blood samples were obtained from the mice via the inferior vena cava. Anti-OVA specific antibodies were measured by ELISA as previously described3). Briefly, microtiter plates (Nunc, Roskilde, Denmark) were coated overnight with 2 µg/mL of OVA in a 50 mM carbonate buffer (pH 9.6) at 4℃. Nonspecific binding was blocked with 2% bovine serum albumin for 1 hour at 20℃. After incubation of test sera for 2 hours, the plates were incubated with horse radish peroxidase-labeled goat anti-mouse IgE or IgG1 (Pharmingen, San Diego, USA) for 1 hour at 20℃. The reaction was developed with a tetramethylbenzidine (Sigma, St. Louis, USA) substrate and then stopped by adding 2 N H2SO4. Subsequently, the optical density was measured at 490 nm. The antibody titers of the samples were related to pooled standards that were generated in the laboratory and expressed as arbitrary units (AU) according to each O.D. value.
Statistics
Statistical analyses was performed using the Kruskal-Wallis and the Mann-Whitney tests. Statistical significance was accepted at p<0.05. Analyses were performed using SPSS 9.0. Values for all measurements are expressed as the means the standard error of the mean.
RESULTS
Airway hyperresponsiveness
The airway responsiveness was increased in IPOA-2, IPOA-7, and IPO-7 than in IPO-2, IHO-10 and the control groups (p< 0.05). No difference of PC200 was found for IPOA-2, IPOA-7, and IPO-7 (p> 0.05). The PC200 of IPO-2 and IHO-10 were not significantly different from those of the control groups (p> 0.05) (Figure 2).

Airway hyperresponsiveness to inhaled methacholine was measured and expressed as PC200, the concentration of methacholine required to increase the baseline Penh by 200%. The airway hyperresponsiveness was increased in IPOA-2, IPOA-7, and IPO-7 and there was no difference of PC200 among them (p> 0.05). Each bar indicates the mean (SEM) value. *p< 0.05, **p< 0.001
Bronchoalveolar lavage fluid (BALF)
The percentages of BALF eosinophil were higher in IPOA-2, IPO-2, IPOA-7, and IPO-7 compared to those of IHO-10 and the control groups (p<0.05). The BALF eosinophil levels in the groups with alum (IPOA-2 or IPOA-7) were higher than in the groups without alum (IPO-2 or IPO-7) (p<0.05). No significant difference was found in the BALF eosinophil levels between IPOA-2 and IPOA-7 or between IPO-2 and IPO-7 (p>0.05). In IHO-10 and in the control groups, eosinophils were rarely found (Figure 3).
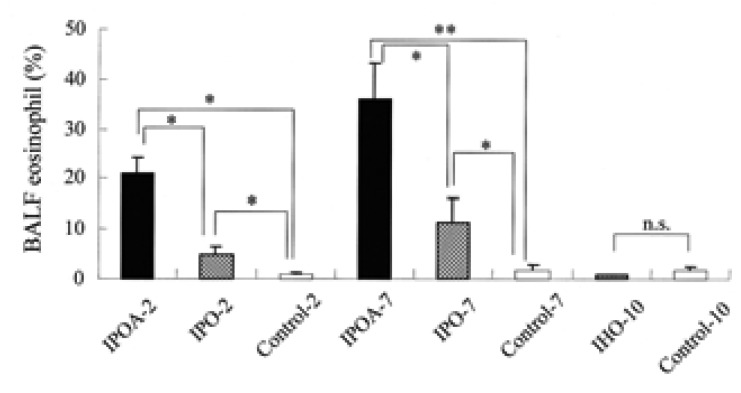
The percentages of eosinophil in the bronchoalveolar lavage fluid (BALF). Each bar indicates the mean (SEM) value. *p< 0.05, **p< 0.001.
Histopathology of the lung
IPOA-2, IPOA-7, and IPO-7, which showed significant increases in the number of BALF eosinophils, also showed increased peribronchial infiltration of eosinophils. Those groups had increased numbers of epithelial-lining cells that were strongly positive by PAS staining for mucin (not shown). Such changes were not found in the control groups (Figure 4). No significant difference was found in the numbers of the eosinophils (randomly counted in 10 fields (×1000)) in IPOA-2, IPOA-7, or IPO-7 (18±2, 27±10, 41±13 respectively, p> 0.05).

Histology of the lung showing representative light microscopic findings of control-2 (A & B) and IPO-7 (C & D). (A): Control mouse showing no sign of inflammation. (C): Mouse asthma model showing peribronchial inflammation (×40, hematoxylin & eosin). (B) & (D): The high power view of (A) and (C). (B) shows no unusual finding. (D) reveals the infiltration of inflammatory cells, especially eosinophils(arrow), and abundant mucin-producing epithelial cells which were PAS(+) (not shown here) (×1000, hematoxylin & eosin).
Serum anti-OVA specific antibodies
The serum anti-OVA specific IgE levels were also higher in IPOA-2, IPOA-7 and IPO-7 than in IPO-2, IHO-10 and in the control groups (p< 0.05). No significant difference was found in the specific IgE levels of IPOA-2, IPOA-7 and IPO-7 (p>0.05). The specific IgE levels of IPO-2, IHO-10 was not different from that of the control groups (p>0.05) (Figure 5A).

Antibody responses in OVA-sensitized and challenged BALB/c mice. The antibody titers of the sera were related to pooled standards that were generated in the laboratory and expressed as arbitrary units (AU) according to each O.D. value. Each bar indicates the mean (SEM) value. *p< 0.05, **p< 0.001.
Serum anti-OVA specific IgG1 levels were higher in IPOA-2, IPOA-7, IPO-7 and IHO-10 than in IPO-2 and the control groups (p<0.05). No significant difference was found in the specific IgG1 level of IPOA-2, IPOA-7, IPO-7 and IHO-10 (p>0.05) (Figure 5B).
DISCUSSION
We produced murine models of asthma using different protocols. Intraperitoneal injection once a week for two weeks with OVA and alum (IPOA-2), seven times for two weeks with OVA and alum (IPOA-7), and seven times for two weeks with OVA but without alum (IPO-7) effectively induced asthmatic reaction upon subsequent OVA challenge. Intraperitoneal injection once a week for two consecutive weeks with OVA but without alum (IPO-2) was not sufficient to induce asthmatic reaction.
Alum (aluminum hydroxide) enhances immune reaction as an adjuvant, especially the Th2 response11). Although its mechanism is not well-defined, one explanation is its repository function. Alum may delay antigen clearing from the injection site, which causes prolonged antigen exposure to the immune system. Alum also may change soluble antigens into particulate form that could facilitate antigen targeting, so it may enhance the antigen uptake by antigen presenting cells12).
This study suggested that alum played an essential role for the sensitization in protocol A (IPOA-2, IPO-2; intraperitoneal injection 2 times). Repository function or changing of soluble antigen into particulate antigen by alum may have allowed for sufficient exposure and the enhanced uptake of the antigen by antigen presenting cells such as macrophages, which is an essential step duringsensitization. However, if OVA were more frequently injected as in protocol B (IPOA-7, IPO-7; intraperitoneal injection 7 times), an asthmatic reaction was induced without co-injection of alum. The manifestations of the asthma phenotype were similar between the two groups although the eosinophil levels of BAL fluid were higher in those sensitized with OVA plus alum than in those sensitized with OVA only. This result suggested that the role of alum might be decreased because of the frequent antigen injection, which might cause repetitive or prolonged antigen exposure. As for the different levels of BAL fluid eosinophils in protocol B, alum might have modulated the immune response directly. Previous study has shown that alum attracted eosinophils to the injection site in the absence of an antigenic stimulus13).
In this study, the inhalation method of OVA for sensitization failed to show the characteristic features of asthmatic reaction upon subsequent challenge such as airway hyperresponsiveness, eosinophilic airway inflammation. Although serum OVA-specific IgE was not detected, it was remarkable that serum OVA-specific IgG1 level was increased as much as those mice showing asthmatic reaction who were sensitized by OVA inhalation.
Specific IgG1 is known to be induced by IL-4 as IgE production, and it binds to FcεRIII in mast cells or basophils14). It is also known that IgG1 plays an essential role in experimentally-induced anaphylaxis in mice and is generally regarded as Th2 type antibody as IgE in mice15). It was also reported that the passive transfer of specific IgG1 induced early hypersensitivity and bronchial hyperresponsiveness16). There is some investigation of the mechanism of isotype switching of IgE and IgG1 in mice but the mechanism has yet to be clearly elucidated17-20).
Interestingly, some investigators suggested that there are two types of IgG1: one is IL-4-dependent and anaphylactic, and the other IL-4-independent and non-anaphylactic21,22). The difference between these 2 types of IgG1 seems to be primarily caused by binding to the mast cell surface and closely related to a proper N-glycosylation of the molecules23,24). The oligosaccharide chains of anaphylactic and nonanaphylactic IgG1 molecules are not similar but they do not seem to differ with regard to their protein sequence23,25). Our present study showed that mice sensitized by OVA inhalation exhibited enhanced OVA-specific IgG1 response but not IgE, which did not cause the asthma phenotype. These findings suggest that allergen-specific IgG1 induced by inhalation might be an IL-4 independent non-anaphylactic type.
We could not detect serum OVA-specific IgE production in mice sensitized by OVA inhalation. We included the sensitization protocol by inhalation because there was some debate on the effect of inhalation route although it is the natural sensitizing route for asthma development6,7,26). Our findings are consistent with previous reports26), but is contrary to the findings of Lack et al.6) or Rentz et al.7) It has been reported that repeated exposure to nonpathogenic protein antigens induces immune tolerance in the lung by T cells27). This immune tolerance induced by different antigen administration routes is mediated by different kinds of T cells. Recently, it has been published that low level inhaled lipopolysaccharide enhanced Toll-like receptor 4-dependent Th2 responses to inhaled antigens in a mouse model of allergic sensitization8). It suggests that possible contamination of endotoxin might have affected the course of sensitization by breaking the tolerance via Toll-like receptor 4 and resulted in serum OVA-specific IgE production and airway hyperresponsiveness in previous studies6,7).
The immune tolerance induced by the oral and nasal route may be mainly mediated by CD4+ T cells28), while that induced by inhalation was suggested to be induced by CD8+ γδ T cells29). It was also reported that nasal immune tolerance inhibited only specific IgE, but not specific IgG1, while oral immune tolerance inhibited both antigen specific IgE and IgG1 production28). However, the exact mechanism of immune tolerance by the inhalation route has yet to be elucidated. The present study found that sensitization by inhalation inhibited the OVA-specific IgE response, but not the IgG1 response, suggesting that the mechanism of immune tolerance by inhalation may be similar to those of the nasal route.
In conclusion, intraperitoneal injection once a week for two weeks with OVA and alum proved to be the most simple and effective method of inducing an asthmatic reaction in a short period in mice. When an adjuvant cannot be used in the experiment, the asthmatic reaction can be induced without adjuvant by multiple intraperitoneal injections of OVA.
ACKNOWLEDGEMENT
This study was supported by a research grant (HMP-00-CH-06-0006) from the Ministry of Health and Welfare, Korea.