Significance of Anti-HCV Signal-to-Cutoff Ratio in Predicting Hepatitis C Viremia
Article information
Abstract
Background/Aims
Hepatitis C virus (HCV) RNA testing can be performed using qualitative or quantitative assays, and it is still unclear which is more useful as a primary test in patients positive for anti-HCV. The present study evaluated the usefulness of anti-HCV signal-to-cutoff ratio (S/CO ratio) for predicting HCV RNA results.
Methods
Patients on whom a qualitative HCV RNA test was performed due to a positive anti-HCV enzyme immunoassay were enrolled. Patients were divided into viremia and no-viremia groups according to HCV RNA results. Receiver-operating characteristic (ROC) curve analysis was performed to evaluate the diagnostic accuracy of anti-HCV S/CO for a diagnosis of viremia.
Results
In total, 487 patients were enrolled. HCV RNA was positive in 301 subjects (61.8%). Age, serum ALT level, and anti-HCV S/CO ratio were significantly different between the viremia and no-viremia groups. By ROC curve analysis, anti-HCV S/CO ratio (area, 0.989; 95% confidence interval, 0.981 to 0.998) accurately predicted the presence of viremia, with a cutoff value of 10.9 (sensitivity, 94.4%; specificity, 97.3%).
Conclusions
Anti-HCV S/CO ratio was found to be highly accurate at predicting HCV viremia. The anti-HCV S/CO ratio can be used to determine whether a quantitative or qualitative HCV RNA test should be used to confirm HCV viremia in patients with a positive anti-HCV by the following criteria: if the anti-HCV S/CO ratio is <10.9, a qualitative HCV RNA test can be used, and if the anti-HCV S/CO ratio is ≥10.9 a quantitative HCV RNA test can be performed.
INTRODUCTION
Hepatitis C virus (HCV) is a major public health problem and one of the leading causes of death from liver disease [1]. According to the World Health Organization, approximately 3% of the world's population is infected with HCV [2]. In Korea, anti-HCV is positive in 0.4-2.1% of the general population [3,4]. Furthermore, because chronic HCV infection is a leading cause of chronic hepatitis, liver cirrhosis, and hepatocellular carcinoma [1], precise detection of HCV viremia is of considerable importance.
The usual screening approach to detect HCV infection involves initial testing for antibodies to HCV (anti-HCV) [1]. However, although anti-HCV assays are highly sensitive and specific for detecting patients with a chronic HCV infection [5], false positive results are not infrequent, especially in low-risk populations (with an anti-HCV prevalence of <10%) [6,7]. Therefore, HCV RNA testing (qualitative or quantitative) is recommended in those with positive anti-HCV findings [6]. However, whether qualitative or quantitative HCV RNA testing is more useful in confirming HCV viremia in patients positive for anti-HCV remains a matter of debate. Some experts prefer quantitative HCV RNA testing because most cases with an ongoing HCV infection have HCV RNA levels that are detected by quantitative assays and because knowing HCV RNA amounts before providing and monitoring HCV treatment is useful [8]. However, because quantitative HCV RNA tests are generally less sensitive and more expensive than qualitative tests, some experts prefer a qualitative HCV RNA test as the primary test [9,10].
Recent studies have suggested that a high anti-HCV titer favors the presence of viremia. An anti-HCV signal-to-cutoff (S/CO) ratio of ≥3.8 was found to predict a true positive in ≥95% of cases when Abbott second-generation HCV EIA or Ortho third-generation HCV kits were used [6]. Furthermore, the US Centers for Disease Control and Prevention suggested that anti-HCV S/CO ratios can be used to determine the need for supplementary testing [6].
This retrospective study was performed to evaluate the usefulness of anti-HCV S/CO ratios for predicting HCV RNA viremia in patients with a positive anti-HCV finding. We also evaluated the usefulness of the anti-HCV S/CO ratio in predicting falsepositive results in anti-HCV in patients positive for anti-HCV, but negative for HCV RNA.
METHODS
Patients
All patients who underwent a HCV RNA qualitative assay because of a positive anti-HCV test between August 2006 and April 2008 were enrolled. Patients who had previously been treated with interferon or pegylated interferon, those previously diagnosed as having chronic hepatitis C, liver cirrhosis, or hepatocellular carcinoma, those with a serum alanine aminotransferase (ALT) level at more than 10 times the upper limit of normal (i.e., ≥400 IU/L), and those with a positive hepatitis B surface antigen or positive anti-HIV finding were excluded.
All included patients were allocated to one of two groups according to the results of qualitative HCV RNA testing: patients positive for HCV RNA to the viremia group, and patients negative for HCV RNA to the no-viremia group. Patients positive for anti-HCV and negative for HCV RNA were classified into two groups, according to recombinant immunoblot assay (RIBA) findings: patients positive by RIBA were allocated to the past-exposure group, and patients negative by RIBA to the false-positive group.
Laboratory tests
Hepatitis C screening was performed using an anti-HCV enzyme immunoassay (Architect i2000; Abbott Laboratories, Abbott Park, IL, USA). Results are reported using S/CO ratios; anti-HCV was considered positive when the S/CO ratio was greater than 1. Serum ALT levels were checked at the same time, and ALT was considered abnormal when its level was greater than 40 IU/L.
HCV RNA qualitative assays (Cobas Amplicor; Roche, Basel, Switzerland; lower detection limit, 50 IU/mL) were performed on patients with positive anti-HCV tests. HCV RNA quantitative assays (Cobas TaqMan Analyzer; Roche; lower detection limit, 15 IU/mL) and HCV genotype testing were performed on patients with HCV viremia. In patients without viremia, recombinant immunoblot assays (RIBA; MPD HCV Blot 3.0; MP Diagnostics, Science Park, Singapore) were performed. When both HCV RNA and RIBA were negative, positive anti-HCV results were considered false positives.
RIBA was performed using the Chiron RIBA HCV 3.0 Strip Immunoblot Assay (Chiron Co., Emeryville, CA, USA) according to the manufacturer's protocol. This assay detects antibodies directed to both structural antigens (core antigen and c22 synthetic peptide) and nonstructural antigens (NS3 antigen, c33c recombinant protein; NS4 antigen, mixed 5.1.1 and c100 peptides; NS5 antigen, recombinant protein). For this assay, the intensities of colored bands on a nitrocellulose strip are proportional to amounts of bound antibody and are graded as negative, 1+, 2+, 3+, and 4+, according to the manufacturer's instructions. The minimum requirement for a positive result is two HCV-specific bands with reactivities of at least 1+. An indeterminate result was defined as: 1) one HCV-specific band with a reactivity of ≤1+ or 2) a reactivity of at least 1+ to human superoxide dismutases and one or more HCV-specific bands. A negative result was defined as the absence of a HCV-specific band of reactivity ≥1+.
Statistics
Statistical analysis was carried using the SPSS version 10.0 (SPSS Inc., Chicage, IL, USA). Quantitative variables are expressed as mean values±standard deviations (SD). Differences between continuous variables were assessed using Student's t-test. Binary regression analyses were used to identify significant predictors of HCV viremia. Spearman's correlation coefficients were used to analyze the correlation between anti-HCV S/CO ratios and HCV RNA levels. Multivariate regression analysis was performed to evaluate the significant predictive factors for HCV viremia or for RIBA results. Receiver-operating characteristics (ROC) curve analysis was performed to evaluate the predictive accuracy of anti-HCV S/CO for the diagnosis of viremia and false-positive reactivity. The Hanley-McNeil test was used to compare area under ROC curves (AUROCs) [11]. Two-tailed p values of <0.05 were deemed to be statistically significant.
RESULTS
Anti-HCV S/CO ratio vs. HCV viremia
During the study period, 661 patients were positive for anti-HCV, and HCV RNA tests were performed in 487 patients (73.7%). The mean age of the 487 patients was 56 years (SD, 16 years), and 230 patients were males (47.2%). The mean serum ALT level and the anti-HCV S/CO ratio were 49±49 IU/L and 10.1±5.6, respectively (Table 1).
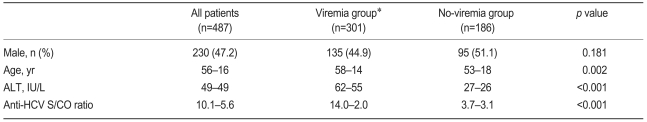
Baseline characteristics of the patients according to the HCV RNA
HCV viremia was present in 301 patients (61.8%) by qualitative HCV RNA testing. Age, serum ALT level, and anti-HCV S/CO ratio were significantly different in the viremia and no-viremia groups (Fig. 1). Serum ALT level was above the upper normal limit (i.e., >40 IU/L) in 167 (55.5%) of the 301 patients in the viremia group and in 26 (14.0%) of the 186 patients in the no-viremia group (p<0.001). Age, serum ALT level, and anti-HCV S/CO ratio were significant predictive factors of HCV viremia by multivariate regression analysis (Table 2).

Age, serum ALT level, and anti-HCV S/CO according to qualitative HCV RNA test results.
Box, range from 25th to 75th percentile; the line at the middle of the box, median value; error bar, range from lowest to highest values.
Viremia group, patients positive for HCV RNA; No-viremia group, patients negative for HCV RNA.
ALT, alanine aminotransferase; HCV, hepatitis C virus; S/CO ratio, signal-to-cutoff ratio.

Multivariate regression analysis for the prediction of HCV viremia
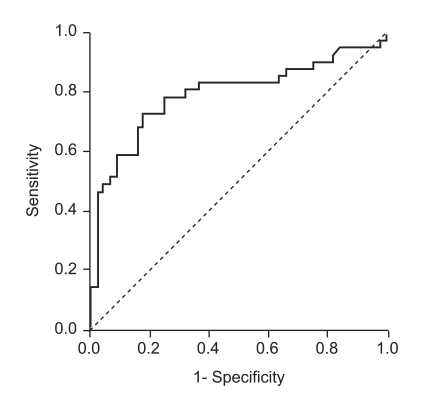
Anti-HCV S/CO ratio (area, 0.989; 95% confidence interval [CI], 0.981 to 0.998) was more accurate than age (area, 0.574; 95% CI, 0.520 to 0.628) or ALT level (area,0.774; 95% CI, 0.732 to 0.816) in predicting the presence of viremia by ROC curve analysis (Fig. 2). Using an anti-HCV S/CO ratio cutoff value of 10.9, sensitivity, specificity, positive predictive value, and negative predictive value for HCV viremia were 94.4%, 97.3%, 98.3%, and 91.4%, respectively (Table 3). All patients with an anti-HCV S/CO ratio of <4.4 (138 patients, 28.3%) were negative for HCV RNA, and all patients with an anti-HCV S/CO ratio >14.4 (127, 26.1%) were positive.
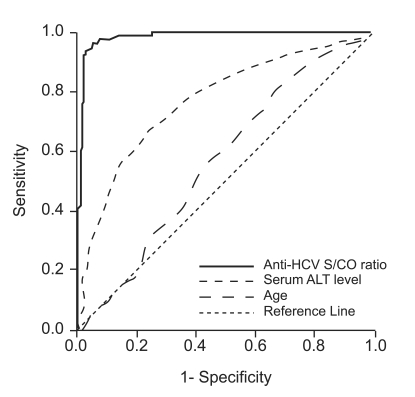
Receiver-operating characteristic curve of anti-HCV S/CO ratio for predicting the results of qualitative HCV RNA testing in 487 patients positive for anti-HCV.
HCV, hepatitis C virus; S/CO ratio, signal-to-cutoff ratio; ALT, alanine aminotransferase.
Predictive accuracies of age, serum ALT level, and anti-HCV S/CO ratio for HCV viremia
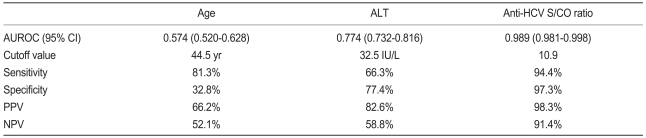
A HCV RNA quantitative assay was performed on 250 (83.1%) of the 301 patients in the viremia group, and no correlation was found between anti-HCV S/CO ratio and HCV RNA level (Spearman's correlation coefficient, 0.037; p=0.564; Fig. 3). HCV genotype analysis was performed in 179 patients (59.5%). Of them, 83 patients (46.4%) were of genotype 1, and 96 (53.6%) were of genotype 2. Although HCV RNA level was higher in patients with genotype 1, age, gender, serum ALT, and anti-HCV S/CO ratio were not different between patients with these genotypes (Table 4).
Scatter plots of anti-HCV S/CO ratio against HCV RNA levels as determined by qualitative HCV RNA testing.
HCV, hepatitis C virus; S/CO ratio, signal-to-cutoff ratio.
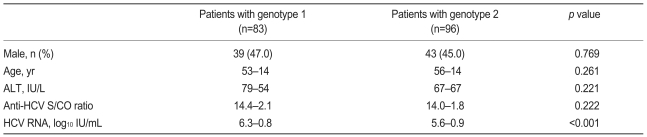
Baseline characteristics of patients positive for HCV RNA according to HCV genotype
Anti-HCV S/CO ratio in patients without HCV viremia
RIBA was performed in 87 of the 186 patients in the no-viremia group (46.8%), and results were positive in 41 patients (past-exposure group, 48.2%), negative in 44 patients (false-positive group, 51.8%), and indeterminate in two (2.3%). Mean ALT level and anti-HCV S/CO ratio differed in the past-exposure and false-positive groups (Table 5). However, multivariate regression analysis indicated that only the anti-HCV S/CO ratio significantly predicted RIBA results (OR, 1.771; 95% CI, 1.299 to 2.414; p<0.001).
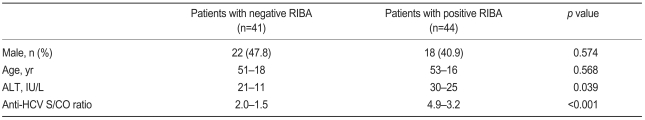
Baseline characteristics of patients negative for HCV RNA according to RIBA results
AUROC of anti-HCV S/CO ratio for false-positive anti-HCV tests was 0.792 (95% CI, 0.690 to 0.894; Fig. 4). At an anti-HCV S/CO-ratio cutoff value of 2.5, sensitivity, specificity, PPV, and NPV were 73.2%, 81.8%, 78.4%, and 75.0%, respectively.
Receiver-operating characteristic curve of anti-HCV S/CO ratio for predicting RIBA results in 85 patients positive for anti-HCV and negative by qualitative HCV RNA assay.
HCV, hepatitis C virus; S/CO ratio, signal-to-cutoff ratio; RIBA, recombinant immunoblot assay.
DISCUSSION
Positive anti-HCV may represent current active infection with HCV viremia, past exposure to HCV, or false-positive reactivity. The HCV RNA test is considered the gold standard to confirm the presence of HCV viremia, but whether quantitative or qualitative HCV RNA testing is the more useful initial confirmatory test in patients positive for anti-HCV has not been resolved.
Qualitative tests are generally more sensitive than quantitative tests at determining the presence or absence of the virus, whereas quantitative tests are more useful for monitoring antiviral therapy and must be performed before therapy is started [12]. Thus, if the result of a qualitative HCV RNA test is positive in patients scheduled for antiviral therapy, blood sampling must be repeated for quantitative HCV RNA testing, which consumes time and money. On the other hand, quantitative HCV RNA testing in patients without viremia also increases costs without gain. Thus, if we could better predict the result of HCV RNA testing, savings in cost and time could be achieved.
According to our results, the anti-HCV S/CO ratio accurately predicts HCV viremia in patients positive for anti-HCV. At an anti-HCV S/CO ratio cutoff value of 10.9, sensitivity and specificity were high, 94.4% and 97.3%, respectively. Furthermore, these results are consistent with those of several previous studies [13-19]. A recent study found no correlation between the anti-HCV S/CO ratio and the degree of liver damage [13]. Patients with liver decompensation had higher S/CO ratios than did asymptomatic patients, but this difference did not remain after considering viremia patients with and those without liver decompensation [13]. Accordingly, in this previous study it was suggested that the S/CO ratio was more related to the presence of HCV RNA in serum than with the severity of liver disease [13].
Actually, the proportion of patients with HCV viremia among patients with positive anti-HCV could be significantly different among study groups, depending on the inclusion and exclusion criteria. For example, the proportion of patients with HCV viremia would be much higher in patients with chronic hepatitis than in patients with positive anti-HCV at a general health check-up. In this study, patients with already known chronic liver diseases were excluded. Thus, our data might be applicable to patients who have no history of chronic hepatitis but who are unexpectedly found to be positive when given the anti-HCV test at their general health check-up.
Because anti-HCV is produced by antigen stimulation secondary to viral replication, anti-HCV antibody levels appear to be increased when viral stimulation is high. Thus, the anti-HCV S/CO ratio is likely to be higher in patients with HCV viremia, in whom viral stimulation is strong and continuous, than in patients with a history of infection or with a waning infection [17].
The high accuracy of the anti-HCV S/CO ratio for predicting the presence of HCV viremia found in the present study could be used to determine the type of HCV RNA test that should be used in patients positive for anti-HCV. Because the possibility of HCV viremia is low in patients with an anti-HCV S/CO ratio of <10.9, qualitative HCV RNA testing is recommended in such patients. On the other hand, quantitative HCV RNA testing could be adopted in patients with an anti-HCV S/CO ratio of >10.9 because most of these patients do have HCV viremia (98.3%), and quantitative measures of HCV RNA should be administered in these patients before treatment.
Although anti-HCV S/CO ratios were significantly different in the past-exposure and false-positive groups, the anti-HCV S/CO ratio was less helpful in predicting RIBA results in patients without HCV viremia. This result is probably explained by changes in the anti-HCV S/CO ratio in those with a history of exposure. Recent studies suggest that anti-HCV titers decline in subjects who experience spontaneous resolution of infection [20,21]. Additionally, patients with chronic HCV infection who are clear of the virus after interferon therapy also show a gradual decline in anti-HCV titer [22]. For this reason, a recent study suggested that no conclusion can be drawn when an anti-HCV titer is low, because titers can decrease gradually after spontaneous resolution [9].
In this study, HCV RNA quantitative tests were performed only in patients with HCV viremia (positive for HCV RNA qualitative test), although HCV RNA qualitative tests were performed in all enrolled patients. However, the lower detection limit of the HCV qualitative test (50 IU/mL) is somewhat higher than that of HCV RNA quantitative test (15 IU/mL). Thus, patients with very low level of HCV viremia (15 to 50 IU/mL) may have been misclassified into the no-viremia group in this study, and this potential misclassification could have influenced the results.
In conclusion, the present study shows that the anti-HCV S/CO ratio is significantly dependent on the presence HCV viremia and that it is highly accurate at predicting the presence of HCV viremia. Furthermore, the type of HCV RNA test used to confirm the presence of HCV viremia in anti-HCV positive patients can be determined using the following: an anti-HCV S/CO ratio <10.9 requires qualitative HCV RNA testing, and an antiHCV S/CO ratio ≥10.9 requires quantitative HCV RNA testing.
Acknowledgements
This study was supported by a grant from the Korea Health 21 R&D Project, Ministry of Health & Welfare, Republic of Korea (No. A050021).