Stress-Induced Cardiomyopathy Presenting as Ventricular Tachycardia
Article information
To the Editor,
Stress-induced cardiomyopathy (SIC) (also known as ampulla cardiomyopathy, tako-tsubo syndrome, and broken heart syndrome) mimicking an acute myocardial infarction is a unique acute cardiac syndrome that appears under physically or emotionally stressful circumstances. It was first described in Japan and is typically characterized by chest pain, elevated ST-segment on electrocardiography (ECG), mildly elevated cardiac enzymes, and reversible left-ventricular dysfunction [1]. Two-dimensional echocardiography (2D-Echo) reveals a typical regional wall motion abnormality; however, coronary angiography (CAG) usually shows no significant atherosclerotic stenosis. A left ventriculogram typically reveals akinesis of the mid-ventricle and apex and hyperkinesis of the base of the heart [1]. However, the mechanism or pathophysiology remains incompletely understood.
In a study in Japan, approximately 9% of 88 patients were diagnosed with SIC associated with ventricular tachycardia (VT) or ventricular fibrillation (VF) during the clinical course [1], whereas in Korea, only one of 18 patients and three of 155 patients had VT or VF-associated SIC [2,3]. We report a case of SIC presenting as VT as an initial manifestation after extreme emotional stress.
A 74-year-old woman with no risk factors of atherosclerosis presented to the emergency room with chest discomfort and general weakness that had begun 30 minutes prior to arrival. Chest discomfort developed when she experienced intense emotional stress after a severe quarrel with her sister-in-law; it was said that she did not have a good relationship with this individual. Her clinical signs were blood pressure (BP), 90/50 mmHg; heart rate (HR), 62 beats/min (bpm); respiratory rate, 20/min; and body temperature, 36℃. Nausea, chills, and generalized rigidity suddenly developed while her medical history was being taken. Her 12-lead ECG then showed VT, and HR was 217 bpm (Fig. 1A). VT was refractory to 200 J and 300 J of direct current (DC) cardioversion with an intravenous infusion of lidocaine and amiodarone. Her BP was sustained at 90/60 mmHg, and her mental status was alert. A few minutes later, ECG showed sinus arrhythmia (HR, 60 to 70 bpm), ST-segment depression, and T-wave inversion in leads II, III, avF, and V2-V6 (Fig. 1B). Chest X-ray findings were cardiomegaly (CT ratio, 0.65) and pulmonary congestion. The levels of serum creatinine kinase-MB (3.0 ng/mL) and troponin-I (0.16 ng/mL) were within normal limits. However, levels of serum myoglobin (220.2 ng/mL), high-sensitivity C-reactive protein (2.330 mg/L), and plasma N-terminal pro-brain natriuretic peptide (2,140 pg/mL) were elevated. 2D-Echo revealed an ejection fraction of 56%, with akinesis of the left ventricular apex and apical ballooning (Fig. 2A). On the second day of admission, CAG showed no significant stenosis, and left ventriculogram revealed apical ballooning and akinesis of the left ventricular apex (Fig. 3). The patient was treated with aspirin, amiodarone, and ramipril. A follow-up ECG on the second day showed a normal sinus rhythm (HR, 65 bpm) and normalized ST-segment and T-wave. After discharge, a follow-up 2D-Echo was performed every month. Akinesis of the left ventricular apex had recovered 5 months later (Fig. 2B).
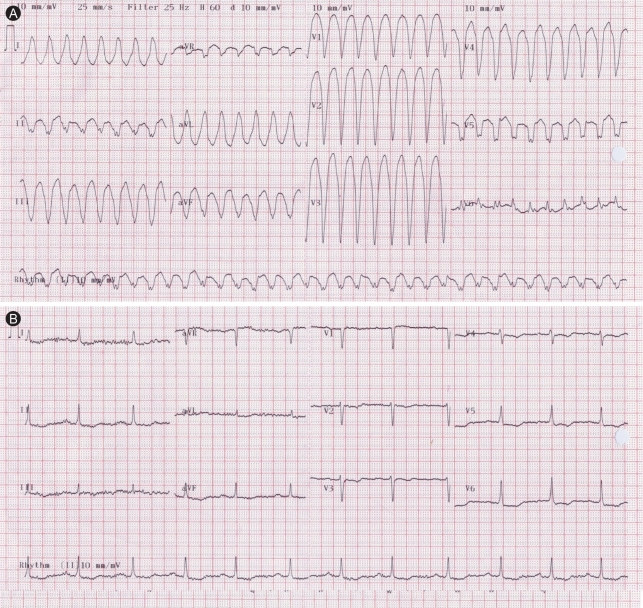
(A) Electrocardiography reveals ventricular tachycardia. (B) After infusion of intravenous lidocaine and amiodarone, electrocardiography reveals sinus arrhythmia and mild ST depression and T-wave inversion in lead II, III, aVF and V2-6.
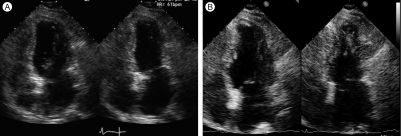
(A) Two dimensional echocardiography at admission shows apical akinesis and ballooning. (B) Follow-up two dimensional echocardiography after 5 months shows improvement of apical wall motion.
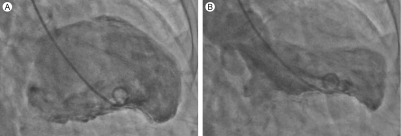
Ventriculogram. (A) End-diastole. (B) End-systole. Left ventriculogram reveals apical akinesis and ballooning.
SIC was first described in Japan in 1990 and is characterized by akinesis and ballooning of the left ventricular apex, similar to a Japanese octopus trap (tako-tsubo). Indeed, this is how this disease got its name, tako-tsubo cardiomyopathy, or ampulla cardiomyopathy. Also, Tsuchihashi et al. [1] referred to this disease as transient left ventricular apical ballooning. Recently, in Korea, Lee et al. [2] and Kim et al. [4] reported SIC presenting as transient akinesis of the mid-ventricle. They referred to this as acute regional cardiomyopathy rather than apical ballooning [2,4].
The pathophysiology of SIC is not clearly understood. Previous studies suggested that a surge of catecholamines in response to extreme physical or emotional stress, coronary spasm, elevated sympathetic tone, and pheochromocytoma are all related to SIC. Additional studies using contrast echocardiography or myocardial single photon emission computed tomography (M-SPECT) suggest that coronary microvascular dysfunction is related to SIC. Among 18 Korean patients with SIC [2], one showed akinesis of the mid-ventricle rather than the apex. Another patient (5.5%) suffered VT and VF during the clinical course and recovered after DC cardioversion. In a retrospective, multicenter study by Jo et al. [3], three of 155 patients had VT associated with SIC. In Japan, a retrospective, multicenter study involving 88 Japanese patients with SIC [1] reported that 9% of them experienced VT or VF. In our case, VT was the initial manifestation of SIC triggered by extreme emotional stress, and it recovered after intravenous injection of lidocaine and amiodarone.
Wall-motion abnormality in SIC patients usually improves within 4 weeks. However, in our case, wall-motion abnormality improved 5 months later. Jo et al. [3] reported that predictors of the recovery of wall-motion index were an absence of arrhythmic events and elevated initial LV end-systolic diameter. However, generalization is limited, as the number of VT patients in that study was too small. In hibernating myocardium, delayed recovery would be expected if the morphologic changes were severe [5]. In our patient, we suggest that chronic and repeated emotional stress provoked morphologic changes in the myocardium, such as hibernating myocardium, that resulted in delayed recovery. Accordingly, recovery of wall-motion abnormality might be delayed.
Further prospective trials should be undertaken to determine the mechanism and pathophysiology of SIC.
Notes
No potential conflict of interest relevant to this article was reported.