Reference interval for thyrotropin in a ultrasonography screened Korean population
Article information
Abstract
Background/Aims
The diagnostic accuracy of thyroid dysfunctions is primarily affected by the validity of the reference interval for serum thyroid-stimulating hormone (TSH). Thus, the present study aimed to establish a reference interval for TSH using a normal Korean population.
Methods
This study included 19,465 subjects who were recruited after undergoing routine health check-ups. Subjects with overt thyroid disease, a prior history of thyroid disease, or a family history of thyroid cancer were excluded from the present analyses. The reference range for serum TSH was evaluated in a normal Korean reference population which was defined according to criteria based on the guidelines of the National Academy of Clinical Biochemistry, ultrasound (US) findings, and smoking status. Sex and age were also taken into consideration when evaluating the distribution of serum TSH levels in different groups.
Results
In the presence of positive anti-thyroid peroxidase antibodies or abnormal US findings, the central 95 percentile interval of the serum TSH levels was widened. Additionally, the distribution of serum TSH levels shifted toward lower values in the current smokers group. The reference interval for TSH obtained using a normal Korean reference population was 0.73 to 7.06 mIU/L. The serum TSH levels were higher in females than in males in all groups, and there were no age-dependent shifts.
Conclusions
The present findings demonstrate that the serum TSH reference interval in a normal Korean reference population was higher than that in other countries. This result suggests that the upper and lower limits of the TSH reference interval, which was previously defined by studies from Western countries, should be raised for Korean populations.
INTRODUCTION
The diagnostic accuracy of thyroid dysfunctions is primarily affected by the validity of the reference interval for serum thyroid-stimulating hormone (TSH) [1]. The National Academy of Clinical Biochemistry (NACB) has proposed that serum TSH reference ranges be established using the 95% confidence intervals (CIs) of the log-transformed TSH values from at least 120 rigorously screened normal euthyroid volunteers with the following characteristics: (1) no detectable levels of thyroid autoantibodies, anti-thyroid peroxidase antibodies (TPOAbs), or anti-thyroglobulin antibodies (TgAbs) as measured by sensitive immunoassays; (2) no personal or family history of thyroid dysfunction; (3) no visible or palpable goiter; and (4) no medications (except estrogen) [2].
Thyroid ultrasound (US) findings are also important to consider when establishing the optimal normal reference interval for serum TSH levels [3] for several reasons. The National Health and Nutrition Examination Survey (NHANES) III demonstrated that serum TSH values tend to be low in current smokers but high in elderly individuals [1,4,5,6,7]. Additionally, recent studies from China and Japan have shown that excessive dietary iodine intake influences serum TSH levels [1,3,8] and Korean people generally consume excessive amounts of iodine due to the high ingestion of seaweed [9]. Therefore, these factors should be considered in establishing an optimal normal reference range for serum TSH levels.
In the present study, the normal reference range for serum TSH levels was evaluated using a normal Korean reference population which was defined according to criteria based on the guidelines of the NACB, thyroid US findings, and smoking status. Sex and age were also considered when evaluating the distribution of serum TSH levels in different groups.
METHODS
Study subjects and definition of a disease-free group
The present cross-sectional study included subjects who were recruited after undergoing routine health checkups between 2009 and 2013 at the Health Screening and Promotion Center of Asan Medical Center in Seoul, Korea. A total of 25,005 healthy subjects (except pregnant women) between 20 and 79 years of age were screened and provided the following information: history of previous disease, medication use, smoking status, family history of thyroid cancer, serum free thyroxine (fT4) levels, serum TSH levels, TPOAb levels, and thyroid US findings. If a subject received more than two health check-ups during the study period, the initial check-up was used for the final analysis.
A total of 5,432 subjects were excluded from the present study due to palpable thyroid nodules, a prior history of documented thyroid dysfunction, a history of thyroid surgery, a history of medicine use that could influence thyroid function (thyroid hormones, estrogen, or glucocorticoids), and/or a family history of thyroid cancer. Additionally, 108 subjects with serum fT4 levels that were outside the normal the reference interval (0.8 to 1.9 ng/dL) were excluded. Thus, 19,465 subjects were included in the present study and defined as the disease-free group (DFG) (Fig. 1).
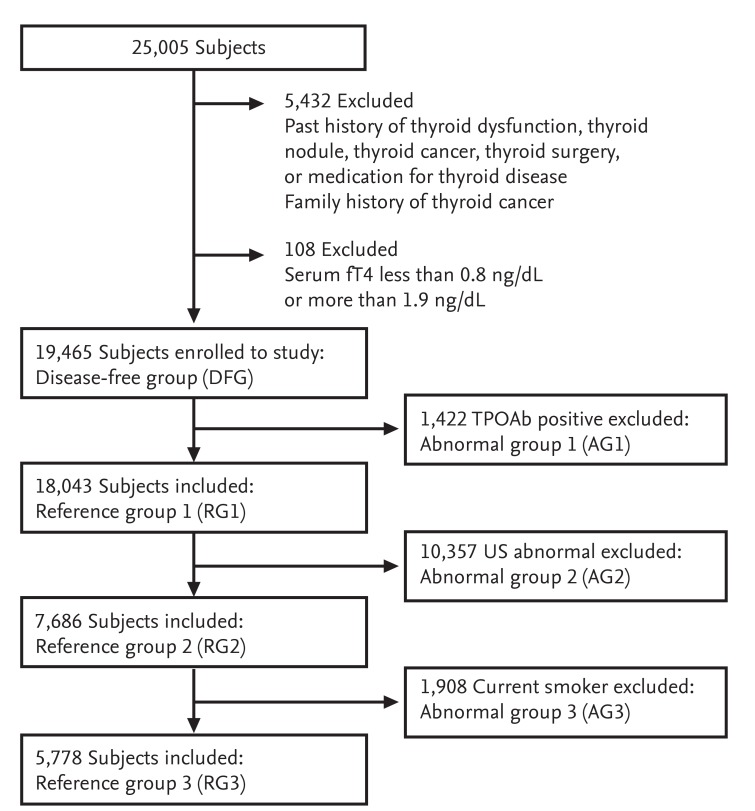
The present study enrolled 19,465 subjects who underwent routine health check-ups. Subjects with overt thyroid disease, a prior history of thyroid disease, or a family history of thyroid cancer were excluded. All subjects were divided into three reference groups (RGs) and three abnormal groups (AGs) based on anti-thyroid peroxidase antibody (TPOAb) findings, thyroid ultrasound (US) findings, and smoking status. fT4, free thyroxine.
Definitions of the reference groups and abnormal groups
Three reference groups (RGs) and three abnormal groups (AGs) were defined based on TPOAb levels, thyroid US findings, and smoking status. RG1 (n = 18,043) removed subjects positive for TPOAbs from the DFG and AG1 included 1,422 subjects positive for TPOAbs from the DFG. RG2 (n = 7,686) removed subjects with abnormal thyroid US findings from RG1 and AG2 included 10,357 subjects with abnormal thyroid US findings from RG1. RG3 (normal RG, n = 5,778) removed current smokers from RG2 and AG3 included 1,908 subjects who were current smokers from RG2.
Biochemical measurements
Serum fT4 levels were measured using a radioimmunoassay (RIA) kit (Beckman Coulter/Immunotech, Prague, Czech Republic). Serum TSH levels were measured with a TSH-CTK-3 kit (DiaSorin S.p.A., Saluggia, Italy) that had a functional sensitivity of 0.07 mU/mL and an interassay variation coefficient of 20%. Serum TPOAb levels were determined using a BRAHMS anti-TPOn RIA kit (Thermo Scientific, Limburg, Germany) that had a functional sensitivity of 30 U/mL and an interassay variation coefficient of 20% [10]. TPOAb levels exceeding 60 U/mL were considered to constitute a positive test.
Thyroid US examinations and interpretations
All US examinations were performed with one of two US systems, the iU22 or the HDI-5000 (Philips Healthcare, Bothell, WA, USA), and both were equipped with linear high-frequency probes that used frequencies from 4 to 15 MHz [11]. Normal thyroid US findings were defined based on the following criteria: (1) a homogeneous echogenic pattern throughout the gland; (2) the absence of any focal US nodules; and (3) the absence of diffuse or heterogeneous abnormalities.
Definition of smoking status
All information regarding smoking status was collected using self-report measures and the subjects were categorized into three groups based on this information: never smoker, former smoker, and current smoker.
Statistical analysis
All statistical analyses were conducted using R version 3.10 and R library Cairo (R Foundation for Statistical Computing, Vienna, Austria). Continuous variables are presented as the mean ± standard deviation (SD) and categorical variables are presented as numbers and percentages. Serum TSH levels are expressed as geometric means with 95% CIs, 2.5th percentiles, and 97.5th percentiles. The 95% CI for TSH (mean ± 1.96 × SD) was estimated for the log-transformed data and then exponentiated back to the original scale. The reference interval for serum TSH levels was considered to be between the 2.5th and 97.5th empirical percentiles.
RESULTS
Serum TSH distribution in the DFG and RGs
The present study included 19,465 subjects (60% male and 40% female) with a mean age of 53.0 ± 9.62 years. Approximately 7% of the subjects were positive for TPOAbs. The distributions of TSH in the DFG and RGs (RG1 to RG3) were right-skewed and deviated significantly from a Gaussian distribution (Fig. 2A), while the logarithm for TSH levels in the DFG and RGs followed an approximate Gaussian distribution (Fig. 2B). The upper reference limit of the TSH range based on the 95% CI was 7.79 mIU/L, which was close to the 97.5th percentile TSH value of 7.06 mIU/L in RG3. The lower reference limit of the TSH range based on the 95% CI was 0.72 mIU/L, which was very close to the 2.5th percentile TSH value of 0.73 mIU/L in RG3.
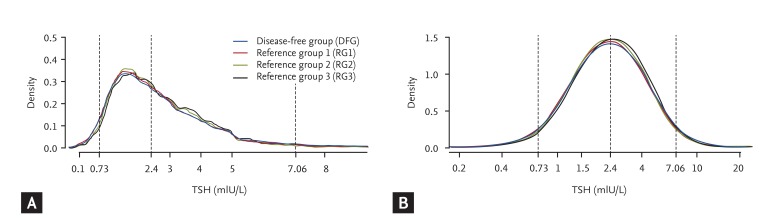
The distributions of serum thyroid-stimulating hormone (TSH) levels in the disease-free group (DFG) and reference groups (RGs) on a linear scale (A) and a logarithmic scale (B).
The geometric means, 95% CIs, 2.5th percentiles, and 97.5th percentiles of the serum TSH levels for each group (DFG and RG1 to RG3) and each sex are presented in Table 1. The geometric mean of the TSH levels in the DFG was 2.29 mIU/L (male, 2.14 mIU/L; female, 2.54 mIU/L) and the 97.5th percentile was 7.70 mIU/L (male, 6.90 mIU/L; female, 8.80 mIU/L). After excluding subjects positive for TPOAbs (AG1), the geometric mean and 97.5th percentile of the TSH levels for RG1 were 2.26 mIU/L (male, 2.12 mIU/L; female, 2.48 mIU/L) and 7.20 mIU/L (male, 6.60 mIU/L; female, 8.04 mIU/L), respectively; these values were slightly lower than those in the DFG. The additional exclusion of subjects with abnormal thyroid US findings (AG2) revealed the geometric mean and 97.5th percentile of the TSH levels for RG2 to be 2.29 mIU/L (male, 2.19 mIU/L; female, 2.60 mIU/L) and 6.80 mIU/L (male, 6.40 mIU/L; female, 7.70 mIU/L), respectively. The additional exclusion of current smokers (AG3) revealed the geometric mean and 97.5th percentile of the TSH levels in RG3 to be 2.38 mIU/L (male, 2.19 mIU/L; female, 2.60 mIU/L) and 7.06 mIU/L (male, 6.80 mIU/L; female, 7.72 mIU/L), respectively. The geometric means and the 2.5th and 97.5th percentiles of the serum TSH levels were higher in females compared to males in all groups, and the reference range for TSH that was obtained using a normal reference population (RG3) was 0.73 to 7.06 mIU/L.
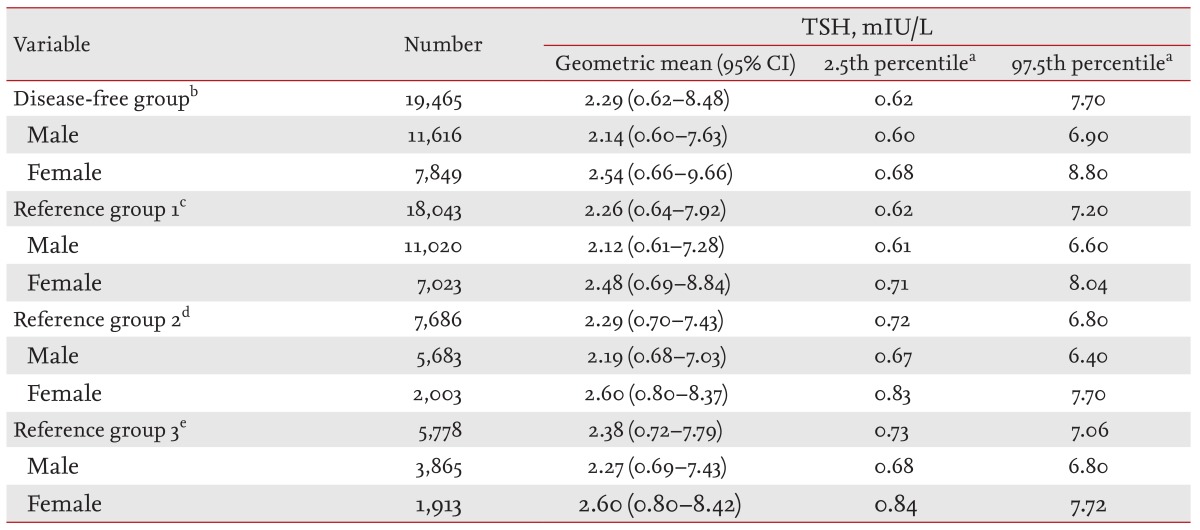
Distributions of serum thyroid-stimulating hormone levels in the disease-free and reference groups
Comparison of serum TSH distributions in the AGs and normal reference population (RG3)
The distributions of the TSH levels in the three AGs (AG1 to AG3) and RG3 are shown in Fig. 3. The distribution of TSH in each of these four groups was right-skewed and deviated significantly from a Gaussian distribution (Fig. 3A), while the logarithm of the TSH levels in these four groups followed an approximate Gaussian distribution (Fig. 3B).
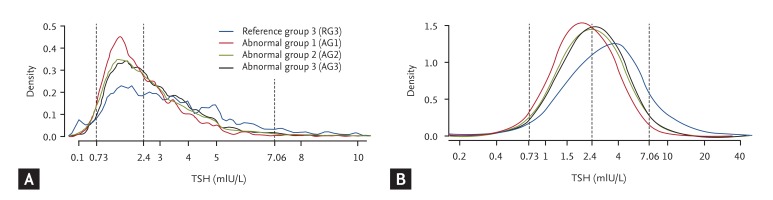
The distributions of serum thyroid-stimulating hormone (TSH) levels in the abnormal groups (AGs) and normal reference group (RG3) on a linear scale (A) and a logarithmic scale (B).
The geometric means, 95% CIs, 2.5th percentiles, and 97.5th percentiles of the serum TSH levels in the three AGs and RG3 are shown in Table 2. The geometric mean of the TSH level in AG1 was 2.86 mIU/L (male, 2.57 mIU/L; female, 3.09 mIU/L) and the 97.5th percentile of the TSH level was 13.05 mIU/L (male, 12.40 mIU/L; female, 14.31 mIU/L). The TSH levels in AG1 were higher than those in all the other groups.
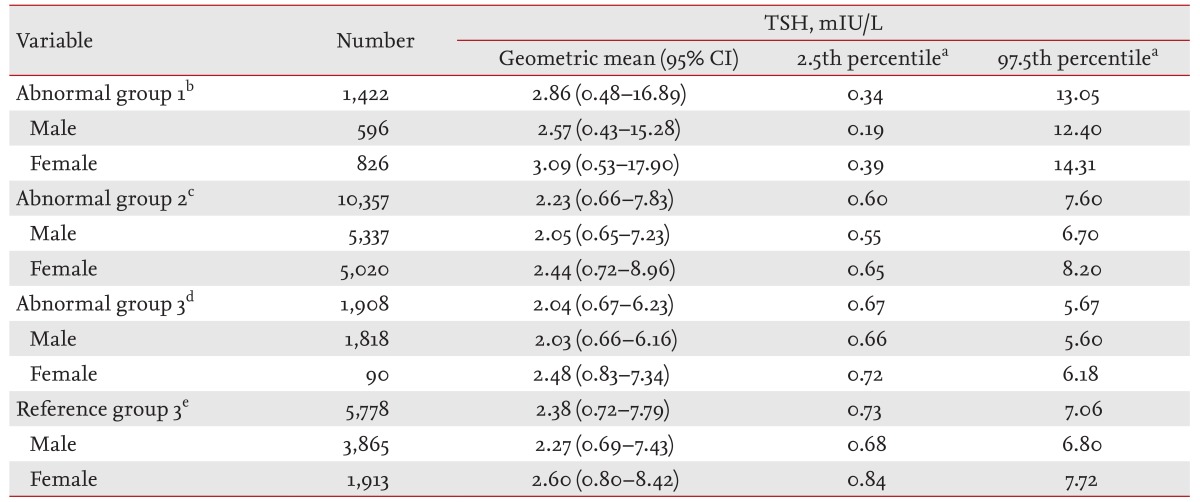
Distributions of serum thyroid-stimulating hormone levels in the abnormal groups and normal reference group (RG3)
The geometric mean of the TSH level in AG2 was 2.23 mIU/L (male, 2.05 mIU/L; female, 2.44 mIU/L), the 2.5th percentile of the TSH level was 0.6 mIU/L (male, 0.55 mIU/L; female, 0.65 mIU/L), and the 97.5th percentile of the TSH level was 7.6 mIU/L (male, 6.7 mIU/L; female, 8.2 mIU/L). In AG2, the 2.5th percentile of the TSH level was lower and the 97.5th percentile of the TSH level was higher than those in RG3.
The geometric mean of the TSH level in AG3 was 2.04 mIU/L (males, 2.03 mIU/L; females, 2.48 mIU/L), the 2.5th percentile of the TSH level was 0.67 mIU/L (males, 0.66 mIU/L; females, 0.72 mIU/L), and the 97.5th percentile of the TSH level was 5.67 mIU/L (males, 5.60 mIU/L; females, 6.18 mIU/L). The TSH levels in AG3 were lower than those in all the other groups.
Distribution of serum TSH levels according to age
The distribution of serum TSH levels in the normal reference population was also assessed according to age: 10% of the subjects were 20 to 39 years of age, 28% were 40 to 49 years of age, 43% were 50 to 59 years of age, 16% were 60 to 69 years, and 3% were 70 to 79 years of age. The geometric means, 2.5th percentiles, and 97.5th percentiles of the TSH levels according to age are shown in Table 3. The geometric means of the TSH levels for each age group were 2.39 mIU/L (20 to 39 years), 2.37 mIU/L (40 to 49 years), 2.36 mIU/L (50 to 59 years), 2.42 mIU/L (60 to 69 years), and 2.37 mIU/L (70 to 79 years). The 97.5th percentile of the TSH values were 7.30 mIU/L (20 to 39 years), 6.73 mIU/L (40 to 49 years), 7.00 mIU/L (50 to 59 years), 7.75 mIU/L (60 to 69 years), and 6.78 mIU/L (70 to 79 years). The serum TSH levels did not show any significant age-dependent shifts.
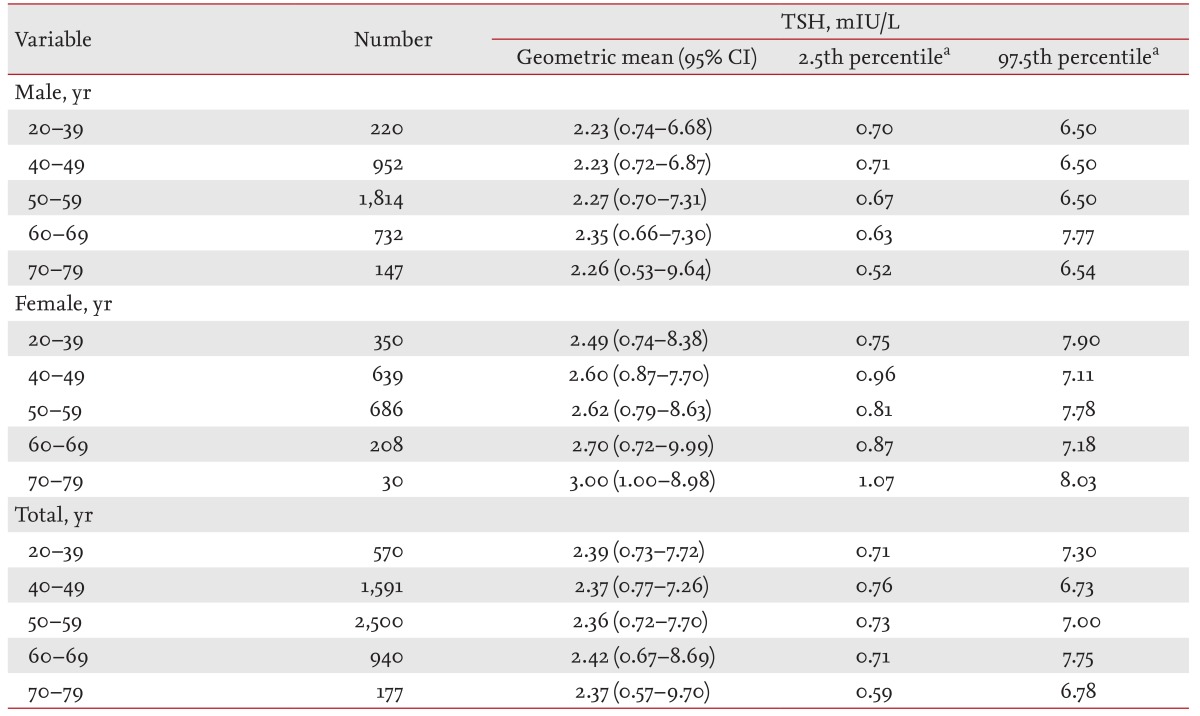
Distributions of serum thyroid-stimulating hormone levels in the normal reference group (RG3) according to age
DISCUSSION
The present study assessed the distribution of serum TSH levels in a Korean population based on the findings of positive TPOAb tests, abnormal thyroid US findings, smoking status, age, and sex. In the presence of positive TPOAb findings or abnormal US findings, the central 95 percentile interval of the serum TSH levels was widened. Additionally, the distribution of serum TSH levels shifted toward lower values in the current smoker group, the serum TSH levels were higher in females compared to males in all groups, and there were no age-dependent shifts.
The central 95 percentile interval of the serum TSH levels was widened in the group positive for TPOAbs, consistent with the findings of previous studies [3,12]. In the present analysis, the geometric mean and 97.5th percentile of the serum TSH levels in RG1 (2.26 and 7.20 mIU/L, respectively) were lower than those in the DFG (2.29 and 7.70 mIU/L, respectively). In the Whickham survey, approximately 13% of the subjects were positive for TPOAbs and the prevalence of TSH values > 4.5 mIU/L was associated with the presence of positive TPOAb findings (odds ratio, 8.4; 95% CI, 5.8 to 12.1; p < 0.01) [1,12,13]. Similar results were obtained in the more recent Hanford Thyroid Disease Study [3]. In that study, approximately 18% of the subjects were positive for TPOAbs and the presence of positive TPOAb findings increased the mean TSH level by 0.09 mIU/L and the 97.5th percentile by 0.36 mIU/L.
Thyroid US findings are also important data to consider when establishing the optimal normal reference interval for serum TSH levels [3]. In the present study, the TSH distributions were evaluated using thyroid US findings to exclude subjects with autoimmune thyroid disease that were not identified among subjects with negative TPOAb findings. In RG1, 57% of the subjects had abnormal US findings and the 97.5th percentile of the serum TSH level (7.20 mIU/L) was higher than in RG2 (6.80 mIU/L).
Current NACB guidelines do not consider US findings when establishing the reference range for serum TSH levels [2,14]. While one recent report excluded subjects with abnormal US findings when determining a normal reference range for serum TSH levels [3]. Previous studies have suggested that thyroid US features such as thyroid enlargement, heterogeneous echotexture, and homogeneous hypoechogenicity may have diagnostic value for the detection of autoimmune thyroiditis [15,16,17]. Hypoechogenic patterns are known to be more sensitive markers for the prediction of hypothyroidism than thyroid autoantibodies [16]. This hypoechogenicity could be a reflection of the diffuse lymphocytic infiltration at the thyroid parenchyma in Hashimoto's thyroiditis that often occurs in the early stages of thyroid disease and prior to overt thyroid failure [15,17]. Diffuse autoimmune thyroiditis may also form discrete nodules within a diffusely altered parenchyma or within a sonographically normal thyroid parenchyma [15]. The latter form has been reported in approximately 5% of all biopsied nodules [18].
In the present study, current smokers were excluded from the normal reference population because several studies have reported that current smokers have a lower prevalence of anti-TPOAbs [1,4,19] and exhibit lower TSH levels [4,20,21]. Additionally, the NHANES III demonstrated that the distribution of serum TSH levels in current smokers was shifted toward lower values [4], and a study from Korea found that current smoking was inversely related with subclinical hypothyroidism [20]. However, the mechanisms underlying the influence of smoking on thyroid function remain unclear. One experimental study using thyroid follicular cells suggested that thiocyanate inhibits iodide transport, organification, and the release of thyroid hormone by competing with thyrotoxic iodine during binding to the sodium-iodine symporter [1,20]. Moreover, current smoking is associated with a low prevalence of various positive thyroid autoantibodies, especially TgAbs [1,4,20,22]. Nicotine may reduce autoimmune thyroiditis by shifting the autoimmune profile from pathogenic cytotoxic T helper type 1 and T helper type 17 responses to protective T helper type 2 responses [23,24].
Dietary iodine intake is another important factor to consider when determining a normal reference range for serum TSH levels. The upper reference limit of the serum TSH range in the present study (7.2 mIU/L in RG3) was higher than those identified in previous studies from other countries [2]. This may be explained by the excessive intake of dietary iodine in Korea due to the regular consumption of sea mustard, sea tangle, laver, fish, milk, yogurt, beef, eggs, sea lettuce, and chicken [9,20]. Two observational studies reported that the mean urinary iodine excretion in Korea ranges from 673.6 to 3,800 µg/L [9,25]. These values are considerably higher than those from other countries, including the United States (145 µg/L) and China (306 µg/L) [12,26]. Guan et al. [27] found that iodine is an important factor when determining TSH reference ranges. In China, the normal reference range for serum TSH is 0.33 to 3.42 mIU/L in a mildly iodine-deficient area and 0.59 to 5.98 mIU/L in an iodine-excess area [27]. In cross-sectional studies from Japan, the normal reference range for serum TSH was 0.37 to 2.53 mIU/L in a normal urinary iodine excretion group and 0.65 to 7.37 mIU/L in a high urinary iodine excretion group [1,8,13].
In the present study, the serum TSH levels did not exhibit significant age-dependent shifts. In the NHANES III (1988 to 1994) and 1999 to 2000 NHANES, the distribution curves of serum TSH in thyroid disease-free subjects shifted progressively to higher levels with age [1,5,6,7]. Similar age-dependent shifts in TSH distribution have also been reported in other Korean studies [29,30]. This discrepancy between the present study and previous reports could be due to the uneven distribution of ages among the study population and/or the fact that subjects younger than 20 years of age and older than 80 years of age were not included. Another possible explanation is that the serum TSH levels in the younger age groups were higher due to excessive dietary iodine intake. Further research is needed to clarify these possible explanations.
The present study has several limitations. The major limitation is an absence of data regarding the degree of dietary iodine intake among the study population. Measured values of urinary iodine excretion should be included in future studies to confirm the effects of iodine on the normal reference interval for serum TSH levels. Second, there may have been a selection bias in this study because it was a cross-sectional investigation based on health check-up data. A population-based cohort study representing the general Korean population may provide more precise information. Third, serum TgAb levels were not evaluated in the present study. Fourth, the present study could not determine which factors may have supported the sex-related differences in TSH levels or the importance of these differences. Even after excluding subjects with positive TPOAb findings and current smokers, which have previously been shown to influence sex-related differences in TSH distributions [3,4,12,20,21], the serum TSH levels were higher in females than males in all groups.
The present study determined the normal reference interval for TSH levels (0.73 to 7.06 mIU/L) using a normal Korean reference population. This result suggests that the upper and lower limits of the TSH reference interval should be raised when evaluating Korean populations. Some studies have shown that the risk of cardiovascular disease increases in patients with abnormal TSH levels [1]. Therefore, it is important to define the optimal cutoff values for TSH in order to establish appropriate limits for the treatment of subclinical hypothyroidism. Furthermore, the determination of new standard TSH cutoff values for Korean populations is warranted because these values might differ from those of Western countries. However, to confirm the precise values of these optimal TSH cutoff values, large population-based cohort studies that include data about the relationship between iodine intake and serum TSH distributions should be conducted.
KEY MESSAGE
In the presence of positive thyroid peroxidase antibody findings or abnormal ultrasound findings, the central 95 percentile interval of serum thyroid-stimulating hormone (TSH) levels was widened.
The distribution of serum TSH levels was shifted toward lower levels in the current smoker group.
Serum TSH levels were higher in females than in males in all groups.
The reference interval for TSH obtained using a normal Korean reference population was 0.73 to 7.06 mIU/L, which is higher than that in other countries. This suggests that the upper and lower limits of the TSH reference range should be raised when evaluating a Korean population.
Acknowledgments
This study was supported by a grant (No. 2014-374) from the Asan Institute for Life Sciences in Seoul, Korea.
Notes
Conflict of interest: No potential conflict of interest relevant to this article was reported.