Diagnostic value of alcoholic liver disease (ALD)/nonalcoholic fatty liver disease (NAFLD) index combined with γ-glutamyl transferase in differentiating ALD and NAFLD
Article information
Abstract
Background/Aims:
This study aimed to verify the reliability of the alcoholic liver disease (ALD)/nonalcoholic fatty liver disease (NAFLD) index (ANI) for distinguishing ALD in patients with hepatic steatosis from NAFLD, and to investigate whether ANI combined with γ-glutamyl transferase (GGT) would enhance the accuracy of diagnosis in China.
Methods:
A hundred thirty-nine cases of fatty liver disease (FLD) were divided into two groups of ALD and NAFLD. The ANI was calculated with an online calculator. All indicators and ANI values were analyzed using statistical methods.
Results:
ANI was significantly higher in patients with ALD than in those with NAFLD (7.11 ± 5.77 vs. –3.09 ± 3.89, p < 0.001). With a cut-off value of –0.22, the sensitivity, specificity, and area under the receiver operating characteristic curve (AUROC) of diagnosed ALD cases was 87.1%, 92.5%, and 0.934 (95% confidence interval [CI], 0.879 to 0.969), respectively. The corresponding values for aspartate aminotransferase (AST)/alanine transaminase (ALT), mean corpuscular volume (MCV), and GGT were 75.29%, 72.94%, and 0.826 (95% CI, 0.752 to 0.885); 94.34%, 83.02%, and 0.814 (95% CI, 0.739 to 0.875) and 80.23%, 79.25%, and 0.815 (95% CI, 0.740 to 0.876), respectively. ANI AUROC was significantly higher than the AST/ALT, MCV, or GGT AUROCs (all p < 0.001), moreover, ANI showed better diagnostic performance. The combination of ANI and GGT showed a better AUROC than ANI alone (0.976 vs. 0.934, p = 0.016). The difference in AUROCs between AST/ALT, MCV, and GGT was not statistically significant (all p > 0.05).
Conclusions:
ANI can help distinguish ALD from NAFLD with high accuracy; when ANI was combined with GGT, its effectiveness improved further.
INTRODUCTION
Fatty liver disease (FLD) is a common disease, and can be further subdivided according to its cause into either alcoholic fatty liver disease (a type of alcoholic liver disease [ALD]) or nonalcoholic fatty liver disease (NAFLD) [1,2]. ALD and NAFLD are serious threats to the health of people worldwide, with incidences rising to about 4.5%, 15% respectively in China [3,4].
In clinical practice, it is crucial to distinguishing alcohol basis from nonalcoholic basis of hepatic steatosis, as the diagnosis relates to the selection of treatment, priority for liver transplantation and organ allocation [5,6]. However, after reviewing the literature, we found few articles regarding the differentiation of ALD and NAFLD. A liver biopsy is considered the “gold standard” to establish the diagnosis, but it is an invasive procedure accompanied by certain risks and deficiencies [7] and therefore has limited clinical application. Furthermore, unreliable drinking history [8], lack of a sensitivity and specificity of single biochemical index [9], and environmental factors (e.g., obesity, diet) have yielded difficulties for the differential diagnosis of ALD and NAFLD. Dunn et al. [10] adopt adopted a multivariate analysis method to analyze the standard risk factors for NAFLD, laboratory abnormalities associated with ALD, and a series of laboratory and histological variables related to the severity of the disease. They then determined that the ratio of aspartate aminotransferase (AST)/alanine transaminase (ALT), mean corpuscular volume (MCV), body mass index (BMI), and gender were independent predictors of ALD. Finally, they developed a new diagnostic model called the ALD/NAFLD index (ANI), to distinguish ALD from NAFLD. Though γ-glutamyl transferase (GGT) has a high predictive value for ALD [11,12], it has not been incorporated into the multivariate analysis due to limited available data.
The purpose of this study was to verify the reliability of ANI as a noninvasive approach to the differential diagnosis of ALD and NAFLD, and to investigate whether ANI combined with GGT will further enhance diagnosis accuracy of diagnosis in China. The goal is to provide a reliable and convenient tool for the clinician to differentiate diagnoses of ALD and NAFLD.
METHODS
Patients
Of all the patients who underwent liver biopsy at Tianjin Second People’s Hospital, China between January 2011 and December 2014. A hundred seventy-five hospitalized patients diagnosed with FLD were prospectively enrolled in this study. Seventeen patients with viral infections, nine cases of FLD caused by autoimmune diseases or drugs, and three other patients with liver steatosis caused by other specific liver disease (Wilson’s disease, Dubin-Johnson syndrome), above all cases were excluded. The remaining 146 patients were divided into two groups according to the diagnostic standard of FLDs formulated by The Chinese National Workshop on Fatty Liver and Alcoholic Liver Disease for the Chinese Liver Disease Association [13,14]. Alcohol consumption of each patient was evaluated by the Alcohol Use Disorders Identification Test Consumption (AUDIT-C) questionnaire. The AUDIT-C is comprised of three questions with a specific scoring system ranging from 0 to 12, and a positive screening result is a score of 3 or more for women and 4 or more for men. The first group consisted of 86 patients (85 males, one female) diagnosed with ALD, while the other group of 53 patients (37 males, 16 females) was diagnosed with NAFLD. Seven cases did not provide a clear drinking history, and so were excluded. As a result, 139 patients were ultimately enrolled into this study.
Clinical and biochemical parameters
The indicators required to determine the ANI include AST, ALT, MCV, gender, height, and weight. Clinical parameters of height, weight, waist circumference, and blood pressure were recorded on the admission day, while serum samples were collected during the following morning after fasting for 12 hours. The biochemical indicators, including AST, ALT, MCV, GGT, total cholesterol (TC), triglyceride (TG), low density lipoprotein cholesterol (LDL-C), and fasting blood glucose (FBG), were detected by the Hitachi 7180 automatic biochemical analyzer (Hitachi, Tokyo, Japan) and supporting reagents. The ANI value was calculated with an online calculator provided by the Mayo Clinic (Rochester, MN, USA, official website: http://www.mayoclinic.org/gi-rst/mayomodel10.html).
Ultrasound examination
Ultrasonographic investigation was performed by two trained radiologists (YZ and JW) using Dornier AI-5200S ultrasound scanner (Dornier, Lindau, Germany) combined with a 3.5 MHz transducer. For all cases, the ultrasound examination was done before liver biopsy. If ultrasound report made mention of fatty liver as diagnosis, it was labeled positive. Controlled attenuation parameter (CAP) was obtained using the ultrasonic signals acquired by the Fibroscan (Echosens, Paris, France) to detect hepatic steatosis. CAP measures the ultrasound attenuation (go and return path) using signals acquired by the 3.5 MHz Fibroscan probe. The CAP values were expressed as dB/m. All operators were blinded to clinical and biochemical details.
Liver biopsy
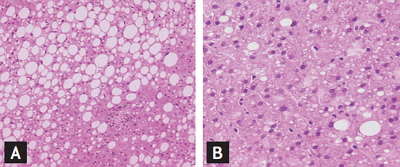
All patients underwent ultrasound-guided percutaneous liver biopsy. Liver specimens greater than 1.5 cm in length, at least four portal areas were included. Each liver tissue were fixed in 10% formalin, paraffin-embedded, and immunohistochemically stained with hematoxylin-eosin, reticular fibers, Masson tricolor and iron. Two experienced pathologists (YL and RS) carried out histological observation without clinical data. If there were any disagreements in histological findings, they would discuss until they reached a consensus. The NAFLD Activity Score (NAS) system for diagnosing nonalcoholic steatohepatitis (NASH) was established by United States of America National Institutes of Health NASH Clinical Research Network [15]. The score is defined as the unweighted sum of the scores for steatosis (0 to 3), lobular inflammation (0 to 3), and ballooning (0 to 2) ranging from 0 to 8, NAS < 3 may exclude NASH, NAS > 4 can be diagnosed as NASH. Not associated with lobular inflammation, ballooning and fibrosis but steatosis > 33% is nonalcoholic fatty liver (NAFL). Pathological features of ALD and NAFLD are shown in Fig. 1.

(A) Nonalcoholic fatty liver disease (NAFLD) characterized by macrovesicular fatty changes and the hepatic lobular infiltrates are composed predominantly of lymphocytes and macrophages, while (B) a clinicopathologic lesion of nearly pure microvesicular steatosis and neutrophilic infiltration in the hepatic lobules in alcoholic liver disease, are rarely detected in livers of patients with NAFLD (H&E, ×200).
Ethics statement
The study protocol was approved by the Ethics Committee of Tianjin Second People’s Hospital and conformed to the provisions of the Declaration of Helsinki (6th revision, 2008).
Statistical analysis
The Shapiro-Wilk test was performed on all data for normality test. Measurement data with normal distribution were presented as mean ± standard deviation, two independent sample t test was used for the data comparison between two groups. Measurement data with abnormal distribution were denoted by the median (4th percentile interval). Weighted κ statistics were used to measure the degree of agreement between two pathologists. The strength of concordance is defined by κ as follows: > 0.8, perfect; 0.61 to 0.8, good; 0.41 to 0.6, moderate; 0.2 to 0.4, fair; and < 0.2, slight. The data of two groups were compared by Mann-Whitney test. Count data were assessed using chi-square test. The area under the receiver operating characteristic curve (AUROC) and its 95% confidence interval (CI) were calculated to assess the overall effectiveness of ANI grading system and the accuracy of ANI combined with GGT to differential diagnosis of ALD and NAFLD. To maximize Youden index (sensitivity + specificity-1) for calculating the optimal cut off value, sensitivity, specificity, positive predictive value, negative predictive value, positive likelihood ratio, negative likelihood ratio in order to appraisal the diagnostic performance of ANI alone or combined with GGT. The AUROC between two groups were compared using the Z test. For statistical analyses, SPSS version 15.0 (SPSS Inc., Chicago, IL, USA) and MedCalc 11.4 (MedCalc, Mariakerke, Belgium) were used.
RESULTS
Interobserver agreement of NAS
Agreement of the two pathologists for grading the severity of hepatic steatosis was perfect (κ = 0.86). And it was good agreement for evaluating both hepatic lobular inflammation and ballooning (κ = 0.64 and κ = 0.72, respectively).
Demographic, clinical biochemical, and ultrasonic characteristics
The age and gender distribution of ALD and NAFLD were no statistically differences (all p < 0.001). In ALD group, all patients were males except one female. AST/ALT, MCV, and GGT in ALD group was higher than that of group NAFLD (all p < 0.001), when BMI was significantly lower (23.60 ± 3.59 vs. 26.17 [3.90], p < 0.001). Blood pressure, waist circumference, FBG, and blood lipid (LDL-C, TG, and TC) showed no significant difference (all p > 0.05) between the two groups. For all patients with ultrasound examination we found that the accuracy of ALD group for hepatic steatosis was 90.68%, compared with 94.34% of NAFLD group, there was no significant difference (p = 0.440). Furthermore, the difference of CAP values between ALD and NAFLD was at the limit of statistical significance (242.87 ± 28.15 vs. 254.23 ± 50.46, p = 0.091). All of the demographic, clinical, biochemical and ultrasonic characteristics of the study group are shown in Table 1.

Demographic, clinical, biochemical, and ultrasonic characteristics of patients
ANI of ALD and NAFLD group
Our study showed ANI value of ALD group was higher than that of NAFLD group, with significant statistical difference (7.11 ± 5.77 vs. –3.09 ± 3.89, p < 0.001) (Fig. 2). The ANI value showed no statistically difference between subgroup of NAFL and NASH (–2.43 [6.33] vs. –2.79 ± 3.28, p = 0.961). The value of ANI in alcoholic fatty liver and alcoholic steatohepatitis subgroup also had no significant differences (4.56 [12.3] vs. 2.93 ± 6.36, p = 0.218) (Fig. 3).
ANI values of patients in alcoholic liver disease (ALD) and nonalcoholic fatty liver disease (NAFLD) groups. The difference of ANI values between ALD and NAFLD groups was statistically significant (t = –11.86, p < 0.001). ANI, ALD/NAFLD index.

ANI values of patients in alcoholic liver disease (ALD) and nonalcoholic fatty liver disease (NAFLD) subgroups. Comparison of area under the receiver operating characteristic curve no statistically significant difference between nonalcoholic simple fatty liver (NAFL) and nonalcoholic steatohepatitis (NASH; Z = –0.48, p = 0.961), and so was between alcoholic fatty liver (AFL) and alcoholic steatohepatitis (ASH; Z = –1.23, p = 0.218). ANI, ALD/NAFLD index.
The value of ANI and combined with GGT in diagnosis of ALD
When the cut-off value of –0.22 was taken, the sensitivity of the ANI diagnosis of ALD was 87.1%, specificity was 92.5%, AUROC was 0.934 (95% CI, 0.879 to 0.969), while use of AST/ALT, MCV, and GGT diagnosis of ALD, when its cut-off value was taken 0.95, 94.0 (fl), and 87.0 (IU/L), the corresponding sensitivity, specificity, and AUROC was 75.29%, 94.34%, and 0.826 (95% CI, 0.752 to 0.885); 72.94%, 83.02%, and 0.814 (95% CI, 0.739 to 0.875); and 80.23%, 79.25%, and 0.815 (95% CI, 0.740 to 0.876), respectively (Table 2). The AUROC of ANI diagnosis of ALD was significantly higher than AST/ALT, MCV, and GGT (all p < 0.001). Moreover, the diagnostic performance was further improved when ANI combined with GGT with its AUROC was 0.976 (95% CI, 0.934 to 0.994) significantly higher than ANI (0.976 [95% CI, 0.934 to 0.994] vs. 0.935 [95% CI, 0.879 to 0.969], p = 0.016). However, there was no significant difference of AUROC among AST/ALT, MCV, and GGT (AST/ALT vs. MCV or GGT, MCV vs. GGT; p = 0.783, p = 0.799, and p = 0.980, respectively) (Table 2, Fig. 4). Based on the estimated cut-off point, ANI > –0.22 in patients with ALD group accounted for 87.21%, whereas the NAFLD group accounted for only 9.43% (Fig. 5).
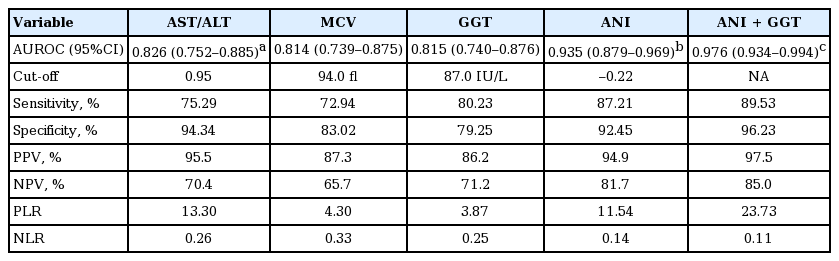
Diagnostic performance of AST/ALT, MCV, GGT, ANI, and ANI combined with GGT for diagnosis of ALD
The receiver operating characteristic curve of ANI, alanine aminotransferase/aspartate aminotransferase (AST/ALT), mean corpuscular volume (MCV), γ-glutamyl transpeptidase (GGT), and ANI combined with GGT for diagnosis of alcoholic liver disease (ALD). ANI, ALD/nonalcoholic fatty liver disease (NAFLD) index.

The distribution of alcoholic liver disease (ALD) and nonalcoholic fatty liver disease (NAFLD) patients, when the cut-off of ANI toke –0.22. ANI, ALD/NAFLD index.
DISCUSSION
In clinical practice, it is of great importance to identify whether the etiology of hepatic steatosis is alcoholic or non-alcoholic, as it relates to treatment options and priorities for liver transplantation and organ allocation [5,6]. Although some serological markers such as mitochondrial aspartate aminotransferase isoenzymes (mAST), carbohydrate-deficient transferrin (CDT), and protein kinase C ε (PKC-ε) have been used for the diagnosis of ALD or NAFLD, none of them has sufficient sensitivity and specificity [16-19]. A meta-analysis performed by Hernaez et al. [20] shows that ultrasound is an accurate, reliable imaging technique for the detection of fatty liver, but it is difficult to distinguish between steatosis and steatohepatitis and the cause of steatosis [21]. The CAP as a novel physical parameter to detect hepatic steatosis is measured on the Fibroscan (vibration-controlled transient elastography machine). Recent studies have testified its high diagnostic accuracy in detecting hepatic steatosis in patients with chronic liver disease [22,23]. In our study, the CAP values of the ALD and NAFLD group was no statistical difference (242.87 ± 28.15 vs. 254.23 ± 50.46, p = 0.091). It suggested that CAP might not be helpful in identifying causes of fatty liver.
In recent years, the ANI diagnostic model proposed by Dunn et al. [10] has high accuracy for identification of ALD and NAFLD. This model has combined the relevant parameters of risk factors and taken into account the effects of obesity and alcohol intake.
As a result of lower gastric alcohol dehydrogenase activity in females and the high proportion of body fat tissue, women are more vulnerable to the impact of alcohol hepatotoxicity, with increasing alcohol intake are more likely to develop into alcoholic disease [24]. However, ALD is more common in men, this is most likely because men’s alcohol consumption tends to be twice or more than women [25], which is consistent with our results: the incidence of ALD in male was higher than female (Table 1).
NAFLD is closely related to obesity, insulin resistance, hypertension, and dyslipidemia, and is considered a hepatic manifestation of metabolic syndrome (MetS) [26]. Moreover, a high BMI and visceral obesity are important risk factors for NAFLD [27]. In our study, the BMI of NAFLD group was significantly higher than ALD group (p < 0.001) (Table 1).
The results showed that MCV in ALD group was significantly higher than those the NAFLD group (98.84 ± 8.64 vs. 89.60 [6.40], p < 0.001) (Table 1). The main reason for alcoholics increased MCV is the direct toxic effects of alcohol on hematopoietic stem cells, followed by the reduced intake or malabsorption of vitamin B12 and folic acid [28-30].
Except for MCV, serum transaminase level also can be influenced by the toxicity of alcohol. Studies have shown that AST/ALT is an independent predictor of ALD [9,31]. The level of serum ALT is usually higher than AST in other causes of liver damage, while ALD patients often appear with AST increased mainly. This is because AST is a mitochondrial enzyme, acetaldehyde and intermediates (such as free radicals) produced during ethanol metabolism can lead to oxidative stress and lipid peroxidation, which result to serum AST increased caused by mitochondria injury. Moreover, phosphate pyridoxine deficiency caused by chronic alcoholism can further give rise to AST and ALT of liver cells reduction. Its impact on ALT is more obvious, so AST/ALT ratio is increased [32,33]. Our findings were consistent with these findings, so AST/ALT is also included into ANI scoring system alongside MCV for differentiating diagnosis of ALD and NAFLD.
GGT is a transmembrane protein present in the microsome, and its function related to cellular uptake of amino acid [34]. Serum GGT mainly from the liver of healthy person, alcohol abuse cause liver cell damage resulting microsomes GGT released into the blood leaving the elevation of its serum concentration [35,36]. Studies have shown that GGT has a high predictive value of ALD [11,12]. In our study, the serum GGT level was significantly higher in the ALD than the NAFLD group (245.0 [602.50] vs. 58.0 [41.60], p < 0.001) (Table 1).
ANI is a reliable noninvasive diagnostic index to identify ALD and NAFLD. ANI was provided with high sensitivity (87.1%) and specificity (92.5%) in diagnosis of ALD when the cut-off toke –0.22. As ANI > –0.22 confirms the alcoholic etiology, while ANI < –0.22, NAFLD should be considered (Table 2, Fig 4). Study from Dunn et al. [10] finds that ANI > 0 ALD is highly suspected, and ANI < 0 is likely to be NAFLD, which is not consistent with our results. Such differences may result from genetic and environmental factors or the complex interaction of them. According to the cut-off value of ANI, ANI greater than –0.22 was found in 87.21% patients in ALD group, while patients with ANI less than –0.22 accounted for 90.57% of the NAFLD group (Fig. 5). When the cut-off was –0.22, ANI for the diagnosis of ALD of AUROC was 0.934 (95% CI, 0.879 to 0.969), which was significantly higher than AST/ALT, MCV, and GGT (these were 0.826 [95% CI, 0.752 to 0.885], 0.814 [95% CI, 0.739 to 0.875], and 0.815 [95% CI, 0.740 to 0.876], respectively; all p < 0.001). When combined with ANI and GGT, the diagnosis efficiency of ALD is further improved with AUROC was 0.976 (95% CI, 0.934 to 0.994; p = 0.016). Meanwhile, the AUROC between AST/ALT, MCV, and GGT was not exist significant difference (all p > 0.05) (Table 2). All this indicated that ANI showed a better performance in differentiating diagnosis of ALD and NAFLD, and the ability was further improve when ANI combined with GGT.
Although ANI scoring system shows high value for differentiating ALD and NAFLD, but there are still some limitations. Thus, we should fully understand the characteristics of ANI scoring system before using it. First of all, ANI is a continuous variable, statistical analysis requires determining a threshold for comparison results, but also need to confirm the diagnosis in combination with other indicators. There is no impact of short-term reduce alcohol intake on ANI. Therefore, the differential diagnosis accuracy of ANI will not be influenced no matter whether excessive alcohol consumption occurred recently or not. Secondly, although ANI > –0.22 indicated alcoholic etiology, this does not exclude the possibility of concomitant MetS. Moreover, the use of ANI scoring system requires except for other liver diseases, since a number of indicators used to calculate the ANI may be affected by other causes. Finally, when patients have occurred cirrhosis or model for end-stage liver disease (MELD) score greater than 20, the reliability of ANI will be reduced. In addition, ANI cannot quantitative calculation of alcohol intake in patients with ALD.
The limitations of ANI scoring system make its clinical application subject to certain restrictions, but ANI is still effective as a very simple and practical tool to assist the differential diagnosis of ALD and NAFLD. Especially combined detection of serum GGT, its value is further improved. Other indicators such as mAST, CDT, or PKC-ε used concurrently with ANI scoring system may further improve its diagnostic value .This would be worth of further study.
In conclusion, our study validated the ANI scoring systems ability to identify ALD in patients with hepatic steatosis and NAFLD with high accuracy in Chinese population. When ANI > –0.22, the diagnosis of ALD is supported, when ANI < –0.22, the diagnosis was more likely to be NAFLD. We should seriously consider the above diagnosis after except for other etiology that may result in liver steatosis. Meanwhile, when GGT is combined with ANI, its accuracy of differentiating diagnosis had been further improved. Although the ANI scoring system itself has certain limitations, and still cannot replace histopathologic examination, it might be a reliable and convenient tool for the clinician to differential diagnosis of ALD and NAFLD, which can help in triaging patients for liver biopsy and deciding about candidacy for liver transplantation.
KEY MESSAGE
1. In clinical practice, it is crucial to distinguishing alcohol basis from nonalcoholic basis of hepatic steatosis, as the diagnosis relates to the selection of treatment, priority for liver transplantation and organ allocation.
2. The alcoholic liver disease (ALD)/nonalcoholic fatty liver disease (NAFLD) index (ANI) scoring systems ability to identify ALD in patients with hepatic steatosis and NAFLD with high accuracy.
3. When ANI is combined with γ-glutamyl transpeptidase, its accuracy of differentiating diagnosis had been further improved.
Notes
No potential conflict of interest relevant to this article was reported.
Acknowledgements
We wish to thank all the patients and medical staff who participated in the study. This work was financially supported by Tianjin state administration of traditional Chinese medicine (No.13132).