Long-term study of the association of adipokines and glucose variability with diabetic complications
Article information
Abstract
Background/Aims
Recent studies have suggested an important role of adipokines in the development of insulin resistance and diabetes mellitus. The clinical relevance of adipokines on long-term outcomes in patients with diabetes and chronic kidney disease is uncertain. The purpose of this study was to identify a predictable factor in patients with long-term diabetic complications.
Methods
A total of 161 diabetic individuals were followed-up from 2002 to 2013. Circulating plasma levels of adiponectin, glypican-4, irisin, visfatin, and visit-to-visit glucose variability were measured in diabetic patients. Associations among adipokines and variable metabolic parameters and microvascular, and macrovascular complications were evaluated.
Results
Plasma adiponectin and glypican-4 levels were significantly increased in patients with renal insufficiency. These adipokines were negatively associated with estimated glomerular filtration rate and positively associated with urinary albumin excretion. The relative risk of renal progression to dialysis increased independently with increasing level of adiponectin. Glypican-4 and visfatin were not predictive of any microvascular or macrovascular complications. Glucose variability increased the risk of diabetic nephropathy and cerebrovascular complications.
Conclusions
Adiponectin and glypican-4 were associated with renal function and might be able to predict renal progression. Glucose variability was a predictable factor for diabetic nephropathy and cerebrovascular complications.
INTRODUCTION
The growing prevalence of diabetes mellitus (DM) is a global health problem, leading cause of chronic kidney disease (CKD) and cardiovascular diseases. Various treatments have reduced acute complications of DM. Optimized control of blood glucose improved life expectancy and lowered the risk of death in diabetic patients. However, more patients have been suffering from long-term diabetic complications such as renal disease despite remarkable progress in improving therapy. Therefore, novel predictable factors are needed to prevent different disease pathways of diabetic complications. Recent studies have demonstrated that increased levels of proinflammatory cytokines, chemokines, and oxidative stress are associated with all types of DM, suggesting an inflammatory component in the pathogenesis of DM [1,2]. For many years, adipose tissue was largely regarded as a tissue of nutrient storage; however, it is now recognized as a secretory organ that generates various bioactive proteins referred to as adipokines [3]. Importantly, adipokines act in a similar manner as classic cytokines and chemokines, regulating insulin sensitivity and immune responses to modulate physiological metabolic and inflammatory processes. Adipokines can act both locally within adipose tissue as well as systemically via secretion into circulation. Specifically, adipokines released in the circulation are thought to interact with other organs such as the cardiovascular system, central nervous system, liver, pancreas, skeletal muscles, and kidney [4]. Previous studies have reported altered levels of adipokines in patients with renal dysfunction [5,6]. In addition, experimental studies have revealed the influence of certain types of adipokines on kidney injury via regulation of endothelial dysfunction, oxidative stress, and inflammatory processes [7,8].
Of adipokines, leptin and adiponectin have been studied a lot in diabetic complications. However, the roles of many adipokines including retinol binding protein 4, resistin, hepcidin, visfatin, and glypican-4, all of which are primarily secreted by white adipose tissues, are not clear in terms of association with diabetic complications [9]. Although the exact roles of each of these different adipokines are not fully understood, clinical and experimental studies have suggested that several adipokines have protective effects against progression of metabolic and inflammatory disorders. We focused on new emerging adipokines of glypican-4, irisin, and visfatin as protective predictors in long-term diabetic complications. Leptin has been a well known adipokine, but was omitted in this study because we have already reported the association of plasma leptin level with diabetic nephropathy [10]. Adiponectin, as another well-known adipokine, was analysed in this study.
The majority of previous studies performed in diabetic patients have reported cross-sectional associations of adipokines with renal and metabolic parameters. Studies to investigate the association of adipokines with long-term outcome in DM have been rare. Therefore, in the present study, we examined the association of adipokines with renal dysfunction and metabolic parameters in diabetic patients and also investigated the relationship of adipokine levels with long-term diabetic complications over an 11 years follow-up period.
METHODS
Subjects
This study was a prospective observational study on adipokine levels and metabolic parameters in patients with diabetic kidney disease. A total of 295 diabetic patients were enrolled to the study from Korea University Ansan Hospital and 161 patients had been followed from 2002 to 2013. Forty-five percentage of total patients were droped out due to death, transfer, and withdrawal after 11 years. The protocols and procedures of study were conducted with approval by the Korea University Ansan Hospital Institutional Review Board (AS15152-001) and were conducted according to the principles expressed in the Declaration of Helsinki. Data were collected after obtaining written consent from each participant. The diagnosis of DM was based on fasting plasma glucose > 126 mg/dL (7.0 mmol) and/or random plasma glucose ≥ 200 mg/dL (11.1 mmol/L) according to the World Health Organization 1998 diagnostic criteria [11], although criteria for the diagnosis of diabetes have been updated after the enrollment of patients [12]. The presence of diabetic nephropathy was screened by standard methods according to the definition by the American Diabetes Association [13]. CKD was defined as abnormality of kidney structure or function, present for more than 3 months with implication for health according to the guidelines introduced by the National Kidney Foundation and Kidney Disease Outcomes Quality Initiative. Patients were categorized into three groups according to renal function (estimated glomerular filtration rate [eGFR]) as follows: eGFR ≥ 60 mL/min/1.73 m2, 30 ≤ eGFR < 60 mL/min/1.73 m2, and eGFR < 30 mL/min/1.73 m2).
Patient medical histories were reviewed using medical charts, and exclusion criteria were as follows: (1) younger than 18 years of age or older than 80; (2) acute illness including acute inflammatory event or cardiovascular or cerebrovascular event within 3 months; (3) chronic liver disease; and (4) malignancy. Demographic data including age, gender, history of hypertension, cardiovascular disease, cerebrovascular disease, smoking history, and prescribed medications were obtained from patient medical charts. Body weight, height, and blood pressure were measured at the time of the clinic visit.
Anthropometric measurements
Blood samples for biochemical measurements were collected at the time of study enrollment. The following variables were measured: complete blood count (hemoglobin, white blood cell count, platelets) and serum sodium, potassium, chloride, creatinine, and lipid profiles (total cholesterol, low density lipoprotein cholesterol [LDL-C], high density lipoprotein cholesterol [HDL-C], and triglycerides). Fasting plasma glucose and fasting blood glucose were measured using glucometers at every clinic visit. Glucose variability was calculated using 3 to 6 months interval visit-to-visit variability. Standard deviations (SDs) of fasting glucose and coefficient of variance (CV) were used as indices of glucose variability. The CV (%) was calculated by expressing the SD as percentage of the mean (CV % = SD/mean × 100). Urine samples were collected for measurement of protein, albumin, and creatinine excretion. Urine albumin to creatinine ratio (UACR) and urine protein to creatinine ratio (UPCR) were used for analysis. eGFR was calculated using the CKD Epidemiology Collaboration (CKD-EPI) equation: eGFR = 141 × min (SCr/κ, 1)α × max (SCr/κ, 1)−1.209 × 0.993Age × 1.018 (if female) × 1.159 (if black), where κ is 0.7 for females and 0.9 for males, and α is −0.329 and −0.411, respectively.
Measurement of plasma adipokines levels
The levels of the different adipokines were measured using commercially available kits, and all samples were measured in duplicate. Specifically, adiponectin was measured using an enzyme immunoassay technique (ALPCO Diagnostic Inc., Salem, NH, USA), which had intra-assay and interassay CVs of 4.5% and 5.0%, respectively. Glypican-4 was assayed using enzyme-linked immunosorbent assay (MyBioSource Inc., San Diego, CA, USA), and the corresponding intra-assay and interassay CVs were < 8% and < 10%, respectively. Levels of irisin and visfatin were assayed using EIA kits (Phoenix Pharmaceuticals, Burlingame, CA, USA), and the intra-assay and interassay CVs were < 10% and < 15% for irisin and < 5% for visfatin, respectively. For visfatin, only 99 of 161 patients participated.
Microvascular and macrovascular diabetic complications
In this study, the presence and development of diabetic complications were examined during an approximate follow-up period of 11 years. Renal complications were considered as presence of microalbuminuria, overt proteinuria, and progression to CKD with dialysis. Retinopathy development was examined by an ophthalmologist, while peripheral neuropathy was examined by a neurologist using an electromyogram. Cardiovascular and cerebrovascular disease complications were defined as development of myocardial infarction, angina, coronary revascularization, heart failure, cerebrovascular infarction, or hemorrhage.
Statistical analysis
Statistical analysis was performed using IBM SPSS Statistics version 20 (IBM Co., Armonk, NY, USA). Censored data included data from patients who were loss during the follow-up period due to transfer to local clinics, withdrawal and deaths. Values of p < 0.05 were considered statistically significant. Data were expressed as mean ± SD and percentage for categorical variables. Continuous variable analysis between two groups was performed using a 2-sample t test or Mann-Whitney U test. Analysis among more than three groups was performed using one-way analysis of variance with Tukey B test or Games-Howell test and Kruskal-Wallis test for nonparametric samples. Categorical data analysis was determined using Pearson chi-square test. Univariate and multivariate linear regression analyses with a stepwise selection method were used to evaluate correlations of adipokines with metabolic parameters. For variables with a skewed deviation, logarithmic transformations were applied. The standard distributions of each variable were examined using one sample Kolmogorov-Smirnov test. p value of each adipokines were as follows; adiponectin (log) (p = 0.837), irisin (log) (p = 0.137), glypican-4 (p = 0.059), visfatin (p = 0.945). Binary logistic regression model was employed to estimate the odds ratio (OR) and 95% confidence interval (CI) of adipokines for predicting diabetic complications. Variables with p < 0.05 from univariate binary logistic regression analysis were retained and evaluated for further multivariate logistic regression analysis model. Forward Wald selection method was performed.
RESULTS
Baseline demographic and clinical characteristics
Participants were all recruited from a single medical center. Baseline demographic and laboratory characteristics are shown in Table 1. A total of 161 patients were followed up from 2002 to 2013. All of the study participants were Asian and had a mean age of 53.9 ± 12.01 years and mean DM duration of 8.3 ± 7.81 years. Of the total patients, 14 (8.6%) were diagnosed as having type 1 DM. Patients with an eGFR between 30 to 60 mL/min/1.73 m2 were older and had a longer duration of diabetes, while patients with renal insufficiency (< 60 mL/min/1.73 m2) exhibited significantly higher systolic blood pressure (SBP) and were more likely to have history of hypertension and use of anti-hypertensive medications, insulin, or statins. Urine albumin and protein excretion was considerably increased in patients with severe renal insufficiency (< 30 mL/min/1.73 m2). Serum cholesterol levels were not significantly different among the groups, but there was a trend toward increased levels in patients with renal insufficiency. The differences in body mass index (BMI, kg/m2), fasting plasma and glycated hemoglobin (HbA1c) between the groups were not significant.

Demographic and clinical characteristics of study cohort (total, n = 161)
Plasma circulating levels of adipokines and glucose variability among the groups
As shown in Fig 1, circulating plasma adipokines were compared among three groups depending on renal function. Plasma adiponectin level was significantly higher in patients with renal insufficiency with eGFR below 30 mL/min/1.73 m2. Plasma glypican-4 level was also significantly higher in patients with renal insufficiency with eGFR below 30 mL/min/1.73 m2. Plasma irisin level trended lower in patients with renal insufficiency. Plasma visfatin level was not changed among three groups. Although there was no change in glucose variability (SD) among three groups, we observed the CV (%) was higher in in patients with renal insufficiency with eGFR below 60 mL/min/1.73 m2.
Plasma circulating levels of adipokines and glucose variability among the groups in study cohort. (A) Plasma adiponectin level, (B) plasma glypican-4 level, (C) plasma irisin level, (D) plasma visfatin level, (E) standard deviation (SD) values of fasting glucose variability, and (F) % of coefficient variance (CV) of glucose variability. Data are expressed as mean ± SD. eGFR, estimated glomerular filtration rate; NS, not significant.
Univariate linear analysis of adipokines with clinical and metabolic parameters
Linear associations of each adipokine with renal and metabolic parameters are described in Table 2. Linear regression analysis revealed a significant negative association of adiponectin with eGFR but a positive association with UACR. Adiponectin was positively associated with age, duration of diabetes, serum cholesterol (total, LDL-C, and HDL-C) levels, and use of calcium channel blockers. Females had higher levels of adiponectin compared to males. Plasma glypican-4 level was significantly higher in patients with renal insufficiency and was inversely associated with eGFR in a similar manner to adiponectin. Additionally, glypican-4 level was positively correlated with UACR, serum LDL-C level, and use of angiotensin converting enzyme (ACE) inhibitors and negatively correlated with glucose variability. Irisin level exhibited a decreasing trend in patients with renal insufficiency, although there was no significant linear association with eGFR. A significant association was noted between levels of irisin and SBP and use of sulfonylurea. Visfatin was not significantly different among groups, nor did it show any significant association with other metabolic parameters.
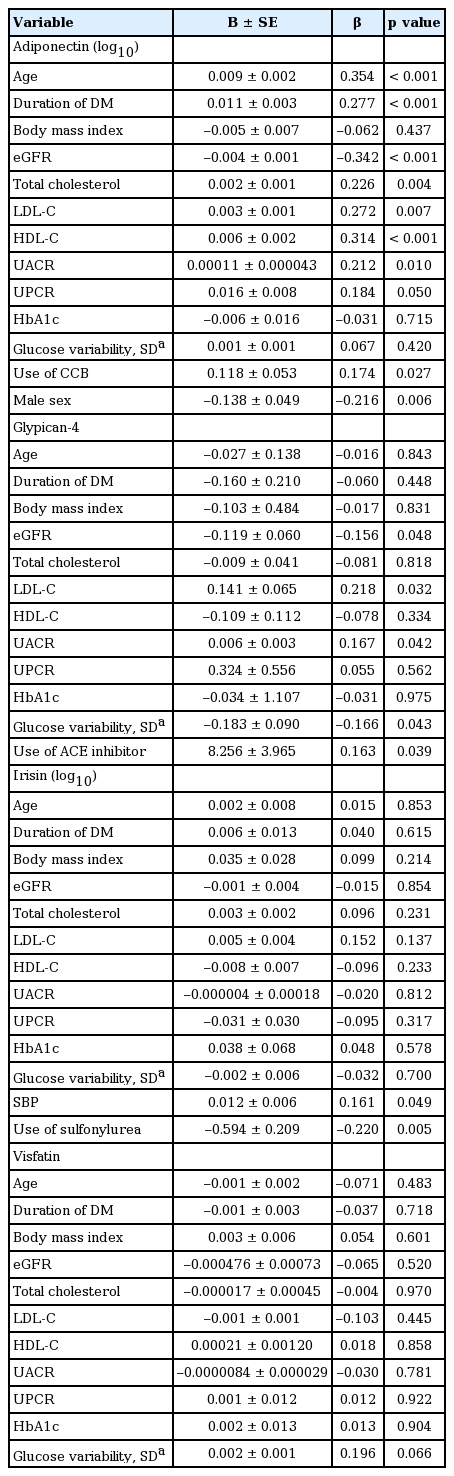
Univariate linear analysis of adipokines with clinical and metabolic parameters in study cohort
Multivariate regression analysis of adipokines with clinical and metabolic parameters
When fully adjusted for relevant parameters as shown in Table 3, age, total cholesterol and HDL-C was significantly correlated with plasma adiponectin level. Multivariate linear regression analysis revealed an independent correlation of use of ACE inhibitors with glypican-4 level. Specifically, patients who used sulfonylurea exhibited decreased level of irisin. Lastly, visit-to-visit glucose variability was examined to evaluate glucose fluctuation during the study period. Percentage of CV, an index of glucose variability, was significantly increased in patients with renal insufficiency, but was not significantly correlated with any of the adipokines evaluated.

Multivariate regression analysis of adipokines with clinical and metabolic parameters in study cohort
Prevalence of renal complications and relative risks for renal complications
Prevalence of diabetic complications at the time of enrollment and at the end of the study is shown in Table 4. Between 2002 and 2013, there were an increased number of diabetic complications, with more than half of the patients reporting diabetic nephropathy. As expected, patients with low eGFR and high UACR and UPCR were more likely to have diabetic nephropathy. Likewise, hypertensive patients were at a higher risk of diabetic nephropathy, as were patients who were on antihypertensive β-blockers and CCB. Interestingly, glucose variability increased the risk of diabetic nephropathy. Neither fasting glucose nor HbA1c was associated with diabetic nephropathy. Furthermore, UACR, glucose variability, and hypertension significantly and independently increased the risk of diabetic nephropathy. Increased plasma adiponectin levels was associated with risk of concurrent diabetic nephropathy at the time of enrollment (crude OR, 1.143; 95% CI, 1.032 to 1.266; p = 0.01). However, there were no significant independent associations of adipokines with presence of diabetic nephropathy at the end of the study. On the other hand, the prevalence of progression to dialysis was significantly increased among patients with higher adiponectin level, even after fully adjusting for correlated variables. In addition, low eGFR and high UACR increased the risk of progression to dialysis. The presence of hypertension, high blood pressure, and use of antihypertensive medication and diuretics also significantly increased the risk of progression to dialysis, similar to diabetic nephropathy. Patients who were younger were at increased risk for dialysis, although the significance of this observation was lost in multivariate logistic regression analysis after adjusting for confounding factors.

Prevalence of diabetic complications at the time of enrollment and relative risks for renal complications in study cohort at the end of the study (11 years follow-up)
Relative risks for microvascular and macrovascular complications
Relative risks for microvascular and macrovascular diabetic complications were also evaluated (Tables 5 and 6). The presence of hypertension and duration of diabetes were significant independent risk factors of both retinopathy and neuropathy. In addition, irisin level was significantly lower in patients with retinopathy at the time of enrollment (p = 0.013). Patients with higher level of irisin exhibited decreased risk of retinopathy, while those with higher level of adiponectin had an increased risk of peripheral neuropathy. However, these associations were not significant when fully adjusted for correlated variables. Fasting plasma glucose level and use of sulfonylurea were independent risk factors of retinopathy. Likewise, individuals with lower GFR, older age, history of hypertension, and longer duration of diabetes were at increased risk of macrovascular complications. Hypertension was a significant and potent risk factor of cardiovascular event, while glucose variability was independently associated with increased risk of cerebrovascular event. However, circulating levels of adipokines were not significantly associated with presence of macrovascular complications in our study.
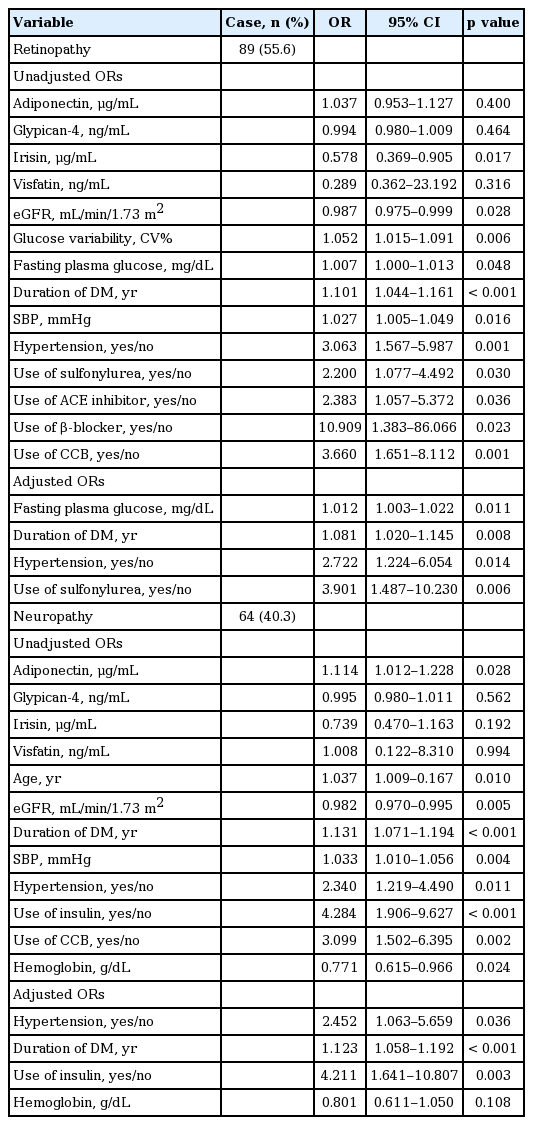
Relative risks for microvascular complications in study cohort

Relative risks for macrovascular complications in study cohort
DISCUSSION
In the present study, we investigated new emerging adipokines that have been suggested to play a protective role in the progression of diabetic complications. After a long time of 11 years, many of diabetic patients presented its complications in this study. It is interesting that plasma levels of adiponectin and glypican-4 were significantly higher in diabetic patients with renal insufficiency and were inversely associated with eGFR. In addition, we identified significant associations between several of the measured adipokines and UACR. Furthermore, adiponectin levels were an independent risk factor of progression to dialysis. However, irisin and visfatin levels were not associated with renal function or progression of renal disease. With respect to metabolic parameters, adiponectin was positively associated with total and HDL-C. As known, established risk factors such as presence of hypertension and duration of diabetes significantly increased the risk of microvascular and macrovascular diabetic complications, while UACR was an independent risk factor of diabetic nephropathy. Convincingly in this study, glucose variability was the best predictable factor in long-term diabetic complications of diabetic nephropathy and cerebrovascular complications.
Adiponectin has been suggested to have anti-inflammatory, anti-oxidative, and insulin-sensitizing effects on various types of cells, and experimental studies have shown that adiponectin regulates oxidative stress and inflammatory pathways via adenosine monophosphate-activated protein kinase activation in the glomerulus and tubules of the kidney [14]. Despite the protective effects of adiponectin on renal progression, clinical studies have shown that high adiponectin levels in patients with kidney disease predict mortality and progression to end-stage renal disease (ESRD) [15,16]. The findings of the present study were consistent with those of previous studies on adiponectin levels in diabetic patients; whereby, adiponectin levels were negatively correlated with eGFR and positively correlated with UACR, a well-known marker of diabetic nephropathy [17]. Plasma adiponectin level has been reported to be elevated in CKD patients, especially in patients with ESRD before dialysis. The measured high molecular weight adiponectin is the main circulating form and the most active form of adiponectin, and despite the liver is considered as the major site of elimination of the adiponectin, the kidney may also play a role for degradation and elimination [18]. Whether the increase in adiponectin level only reflect impaired adiponectin clearance by the kidney or whether it is a compensatory mechanism has not been clearly elucidated yet. Reduced renal clearance of adiponectin does not fully explain high levels of adiponectin in renal insufficiency. Previous studies on adiponectin suggest that the elevation of adiponectin level is not simply the result of impaired excretion. It should be noted that adiponectin is rapidly cleared in the plasma, and that the renal adiponectin clearance are detected mostly in tubules and appears to be intracellular. Also, in a study with patients of renal insufficiency (n = 48, mean GFR 53.5 ± 24.9 mL/min/1.73 m2), adiponectin level was weakly affected by renal function, but were more influenced by proteinuria and metabolic parameters [19]. In addition, gene and protein expression analysis of human adipose tissue in ESRD have shown that in both diabetic and non-diabetic patients, ESRD state contributed to increased level of adiponectin and adiponectin receptor R1 expressions [20]. Therefore, we can speculate that increased adiponectin levels in renal insufficiency are due to increased adiponectin resistance in spite of increased production of adiponectin; therefore, showing little effect on protecting from progressive renal injury. In this study, the level of adiponectin was an independent risk factor of ESRD, despite adiponectin level was not a risk factor of diabetic nephropathy. Thus, adiponectin resistance at the post-receptor level in a uremic state might, at least in part, explain increased risk of renal progression despite high levels of anti-inflammatory adiponectin [18]. Our results provide that adiponetin might different role depending to renal function of diabetic nephropathy.
Disruption of insulin and hyperglycemia are thought to contribute to the development of peripheral neuropathy. In the present study, use of insulin and duration of diabetes were independently associated with risk of peripheral neuropathy, which might be due to long exposure to a hyperglycemic condition and increased insulin resistance. In addition, we found that high adiponectin levels were associated with increased risk of peripheral neuropathy, but the significance of this association was lost after adjusting for confounding factors. Interestingly, several studies have observed increased levels of adiponectin in patients with diabetic neuropathy, whereas other studies have not observed this phenomenon [21].
Glypican-4 is a novel adipokine and a member of the heparan sulfate proteoglycan family of glypicans that bind to various ligands and can be shed from the cell surface, enabling them to act both locally and systemically. Glypican-4 is thought to be involved in growth and differentiation of adipocytes. Ussar et al. [22] previously found that circulating glypican-4 directly interacts with insulin receptors and enhances insulin signaling. In humans, circulating level of glypican-4 was shown to be significantly decreased under diabetic conditions and was also significantly correlated with measures of obesity (BMI, waist to hip ratio, body fat content) and insulin resistance (homeostasis model assessment of insulin resistance) [22,23]. However, an association of glypican-4 with renal function has not been previously reported. In our study, plasma glypican-4 level was higher in patients with severe renal insufficiency, while glypican-4 was inversely correlated with eGFR and positively correlated with UACR, similar to adiponectin. Interestingly, the first report of glypican-4 in the literature was in the developing brain and kidney, where it was shown to be highly expressed in renal tubular cells [24].
In addition to the effects of glypican-4 on adipocytes, glypican-4 has been suggested to bind to Wnt3a and Wnt5a in order to regulate Wnt signaling in cardiomyocytes [25]. Considering the link of insulin signaling and Wnt/β-catenin signaling with progression of diabetic nephropathy, circulating glypican-4 might have an active role on progression of renal complications [26]. Consistent with this possibility, we observed a significant inverse correlation of glypican-4 with glucose variability, indicating that higher glypican-4 level is associated with decreased fluctuation of glycemia. This finding might have been due to the action of glypican-4 in counteracting insulin resistance. Likewise, use of ACE inhibitors was independently and positively associated with glypican-4 regardless of the presence of hypertension, eGFR, or UACR. Currently, there is no data linking ACE inhibitors to glypican-4. Thus, in order to elucidate the role of glypican-4, further experimental and clinical studies exploring the possible action of glypican-4 in the kidney are needed. As for long-term complications, glypican-4 was not predictive of long-term microvascular or macrovascular diabetic complications.
The presence of hypertension and glucose variability significantly increased the risk of diabetic nephropathy. Observational studies in diabetic subjects have shown that visit-to-visit glucose variability in fasting glucose is a risk factor of diabetic complications and mortality [27,28]. Similarly, in vivo fluctuation of glucose in experimental studies has been shown to increase oxidative stress and endothelial injury [29]. Glucose variability reflects fluctuation of glucose levels over the time compared to traditional HbA1c, which level indicates constant exposure of glucose. We speculate that glucose variability is an important measure of poor glycemic control, especially in patients with renal insufficiency, who have reduced clearance of antidiabetic agents and increased insulin resistance. In the present study, glucose variability also increased relative risk of cerebrovascular disease.
Irisin is a newly discovered myokine secreted by myocytes, is proteolytically processed from the product of the fibronectin type III domain containing 5 gene, mediates browning of white adipocytes, and upregulates expression of uncoupling protein-1 level in experimental mice [30]. Recent studies have shown that irisin is also secreted from white adipose tissue and thus has the potential to protect against obesity and insulin resistance [31]. Little is known about the function of irisin in humans, but recent studies have shown that circulating irisin level is significantly lower in obese and diabetic patients, as well as in patients with renal insufficiency [32,33]. In the present study, there was a trend toward decreasing irisin level with advancing stage of kidney disease. However, the range of observed levels of irisin and the corresponding SDs were both very large, which might have weakened the statistical power of our analysis. In addition, irisin level was significantly and positively associated with use of sulfonylurea. While it is not currently clear how irisin correlates with use of sulfonylurea, a previous experimental study with conflicting data showed that metformin but not glibenclamide promotes irisin release from murine skeletal muscle [34]. As there is currently relatively little data on the function of irisin, more research will be necessary to understand the association of sulfonylurea with irisin.
Visfatin is another adipokine that is thought to have insulin mimetic activity [35,36]. In contrast to previous studies on levels of visfatin in patients with diabetes and CKD, we did not identify any changes in visfatin level according to eGFR or UACR. Circulating level of visfatin has been reported to be increased in obesity, type 2 DM, atherothrombotic disease, and CKD. In our study, patients with severe renal insufficiency exhibited relatively increased level of visfatin, but this increase was not statistically significant, which was likely due to the small size of the study.
There were several limitations to the present study. First, the sample size was small, especially for patients with severe renal insufficiency of eGFR < 30 mL/min/1.73 m2. We might have overlooked some associations of adipokines with progression of diabetic complications in patients with severe renal insufficiency, and thus further studies with a larger sample size in a prospective longitudinal study will be needed. Results shown in Tables 4 to 6 were analyzed using binary logistic regression. Our study sample was statistically fit for logistic regression analysis with predictability of more than 90% for each adjusted ORs. To access independent contribution of adiponectin, eGFR was adjusted to exclude the influence of renal function. When divided according to CKD stages (1 to 5), the sample sizes of group 3 to 5 were not sufficiently large to evaluate the independent significance of relevant variables and were not fit for logistic regression analysis (p value for chi-square was more than 0.05). Relative risks of adiponectin for predicting renal complications according to CKD stages are shown in Supplementary Table 1. Second, several adipokines have been suggested to act as bioactive modulators that ameliorate inflammation and oxidative stress and enhance insulin sensitivity. It would be better to compare adipokine levels over 11 years. However, our data did not include the follow-up measurement of adipokine levels and therefore, is not able to characterize the relationship between the final adipokine levels with eGFR at the end of the study, which needs to be evaluated in the future study. Although several studies have shown that therapeutic intervention might change circulating levels of adipokines in certain individuals, we did not consider the impact of medical therapy and life-style modification on levels of adipokines in the present study. Third, both type 1 and type 2 DM patients were enrolled at the time of beginning of the study although only 8.5% of all patients were type 1 DM. Adipokines are generally understood to be associated with metabolic parameters associated with obesity and insulin resistance. In the present study, BMI was not different among groups depending to renal function and not associated with any plasma adipokines. However, BMI alone might not be sufficient to explain the associations of adipokines with obesity [37]. In addition, BMI could not present the body mass precisely due to renal insufficiency and body fluid accumulation in patients with diabetic nephropathy. Although we did not measure the adiposity index of each patient in our study, we compared the gender difference of adiponectin in this study. Gender specific association of adiponectin with the progression of CKD in non-diabetic cohort has been reported by Kollerits et al. [38]. Whereas the baseline adiponectin levels were significant different between men and women in a total population (3.58 ± 2.377 vs. 5.29 ± 4.491, p = 0.002), adiponectin level was predictive for progression to dialysis in women, but not in men in contrast to their study (Supplementary Table 2). It should be taken into consideration that women were aged and had more disturbed metabolic parameters compared to men. At baseline, women group was older, had higher BMI, SBP, and lower eGFR. The differences between the study from Kollerits et al. [38] and ours are that our study population consists of diabetic patients, and there were a wide range of baseline eGFR in the study cohort.
Despite these limitations, our study showed an interesting result to find predictable factors of long-term diabetic complications. The change of adipokine levels might be considered to provide CKD-related inflammatory response rather than obesity-related conditions.
In conclusion, plasma adiponectin and glypican-4 levels are associated with renal function and might be able to predict renal progression in patients with diabetes. Additionally, glucose variability might be a potent risk factor of diabetic nephropathy and cerebrovascular disease. Further clinical and experimental studies with a larger study cohort will be needed to determine the cause and effect relationship between adipokines and diabetic complications.
KEY MESSAGE
1. This is the prospective observational study to find predictable factors in long-term diabetic complications.
2. Plasma adiponectin and glypican-4 levels are associated with renal function and might be able to predict renal progression in diabetic patients.
3. Glucose variability might be a potent risk factor of diabetic nephropathy and cerebrovascular diseases.
Notes
No potential conflict of interest relevant to this article was reported.
Acknowledgements
This study was supported from Korea University Grant.