Atypical bone change of spine caused by epidural venous thrombosis in systemic lupus erythematosus with antiphospholipid syndrome
Article information
A 23-year-old woman with systemic lupus erythematosus and secondary antiphospholipid antibody syndrome presented with 1-month history of persistent low back pain radiating to the left flank. She had been maintained on low-dose corticosteroid and anticoagulant for more than 3 years. Plain radiography of the lumbar spine revealed no abnormality. However, L-spine magnetic resonance images (MRIs) showed high T1 and high T2 signal intensities of the L4 and S1 vertebral bodies (Fig. 1A and 1B) and a signal drop on contrast-enhanced fat-saturated T1-weighted images without enhancement in those areas (Fig. 1C), which suggested fatty depositions. Moreover, an enlarged epidural venous plexus, causing bulging of the contour of the anterior epidural space of the L4, with intermediate T1 and low T2 signal intensities (Fig. 1D and 1E), was also evident, and thrombosis was signaled by a filling defect with peripheral enhancement on contrast enhanced fat-saturated T1-weighted images (Fig. 1F). 18F-fluoride positron emission tomography/computed tomography (PET/CT) was performed to investigate other possible skeletal involvement. This yielded the interesting finding of diffusely decreased tracer uptake by the L4 and S1 vertebral bodies (Fig. 2A and 2B), without any morphological changes on combined CT images (Fig. 2C). Thereafter her anticoagulant was increased and a nonsteroidal anti-inflammatory drug was added for conservative treatment of her flank pain. Follow-up L-spine MRI 8 months later showed no change of these lesions in the interval.
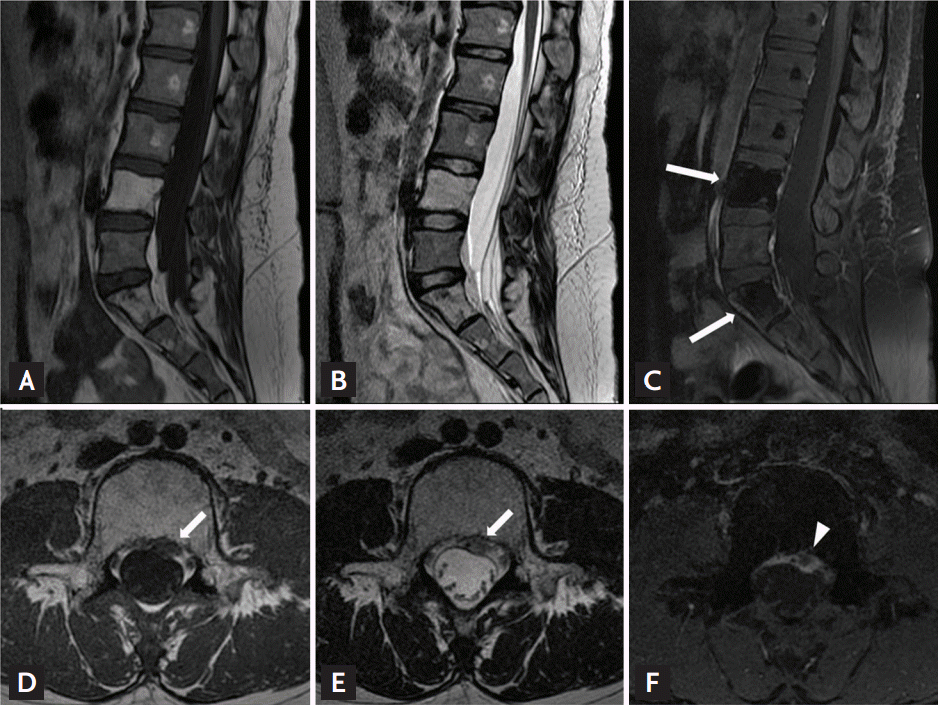
Lumbar magnetic resonance image findings. (A) Sagittal T1- and (B) T2-weighted images reveal high signal intensities of the L4 and S1 vertebral bodies. (C) A sagittal fat-saturated contrast-enhanced T1-weighted image shows the signal drop (long arrows) of the high signal intensities of the L4 and S1 vertebral bodies, which suggest fatty deposition in these areas. (D) Axial T1- and (E) T2-weighted images also show the enlarged epidural vein (short arrows) that obliterates the anterior epidural fat and slightly compresses the adjacent thecal sac at the level of the L4 body. (F) Axial fat-saturated contrast-enhanced T1-weighted image reveals thrombosis of the dilated epidural vein (arrowhead).
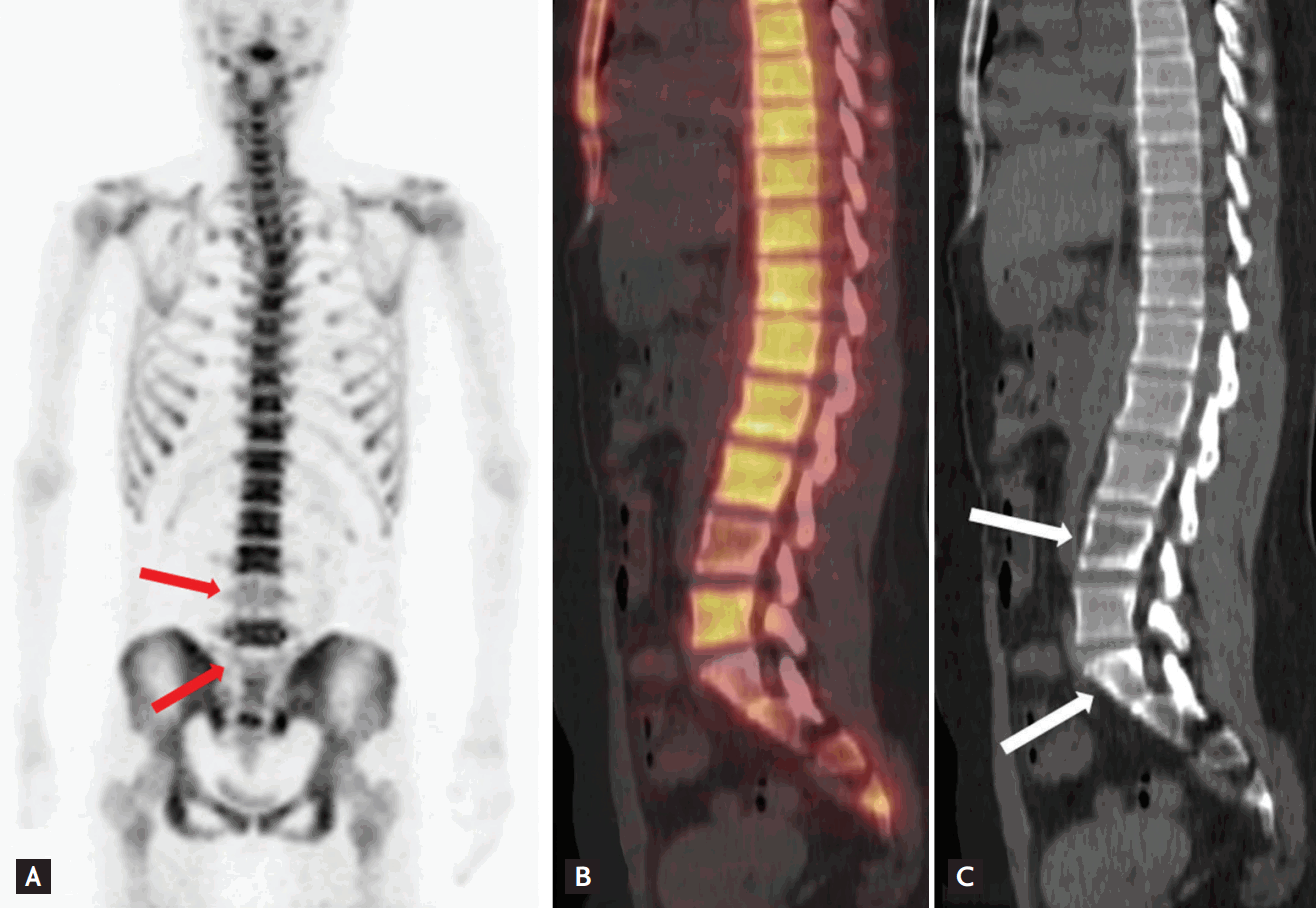
18F-fluoride positron emission tomography/computed tomography (PET/CT) findings. (A)Maximum intensity projection, (B) sagittal fusion, and (C) combined CT images show decreased radiotracer uptake (arrows) by the L4 and S1 vertebrae.
The exact pathophysiological relationship between epidural venous thrombosis and fatty deposition in the vertebral body is not clear. But we suggest that the prolonged gradual disturbance of the microvascular circulation due to partial epidural venous thrombosis caused by the antiphospholipid antibody, together with the long-term use of steroid, may have led to fatty deposition in the vertebral body rather than the typical avascular necrosis caused by sudden vascular insufficiency.
Notes
No potential conflict of interest relevant to this article was reported.