Platelet count is associated with sustained virological response rates in treatments for chronic hepatitis C
Article information
Abstract
Background/Aims
This study was conducted to clarify the sustained virological response (SVR) prediction ability of baseline and treatment-related factors in patients with chronic hepatitis C virus (HCV) infection.
Methods
This retrospective study collected data at four tertiary referral hospitals between June 2004 and July 2012. Out of 476 patients, 330 treatment-naïve patients with chronic HCV infection were recruited. Pegylated interferon α-2a/- 2b plus ribavirin was administered for either 24 or 48 weeks depending on the HCV genotype. The baseline and treatment-related predictive factors of SVR were evaluated by analyzing data measured before treatment (i.e., baseline) and during treatment.
Results
SVR rates for genotypes 1 and 2 were 63% (97/154) and 79.5% (140/176), respectively (p = 0.001). Multivariate analysis for baseline factors revealed that young age (p = 0.009), genotype 2 (p = 0.001), HCV RNA level of < 800,000 IU/mL (p < 0.001), and a baseline platelet count of > 150 × 103 /µL (p < 0.001) were significant SVR predictors, regardless of the genotype. In particular, predictive accuracy for achievement of SVR was 87.3% for a baseline platelet count of > 150 × 103 /µL. In multivariate analysis for treatment-related factors, SVR was associated with achievement of a rapid virological response (RVR; p < 0.001), treatment adherence of ≥ 80/80/80 (p < 0.001).
Conclusions
Young age, genotype 2, low HCV RNA level, RVR, and treatment adherence were significantly associated with SVR. In addition, platelet count was an independent predictive factor for SVR. Therefore, platelet count could be used to develop individualized treatment regimens and to optimize treatment outcomes in patients with chronic HCV infection.
INTRODUCTION
Chronic hepatitis C virus (HCV) infection is a major public health problem and is one of the main causes of serious liver disease worldwide [1-4]. Effective treatment for HCV infection is required to reduce the impact of this global health problem. The primary goal of administering antiviral agents, which eliminate detectable circulating HCV, is to cure the chronic HCV infection. The sustained virological response (SVR) has become an indication of curative therapy for chronic HCV infection, and is associated with both a histological improvement and a more favorable clinical outcome. Achieving an SVR is therefore an essential strategy in treating chronic HCV infection. However, the combination therapy of pegylated interferon (PEG-IFN) and ribavirin results in a SVR in only 40% to 50% of patients with HCV genotype 1 and in 70% to 80% of those with genotypes 2 or 3 [5,6]. In recent years, the directing antiviral agents (DAA) has improved cure rates of 80% to 100%, but many patients are still not available DAA therapy because of high cost [7].
Factors that may influence the rate of response to therapy are being investigated extensively, and the results are awaited with great interest. Although the HCV genotype and HCV RNA level are known to be the strongest predictors of SVR, several other factors have also been found to affect treatment responses [8]. Various studies have shown that histological factors (including the amount of fibrosis) are traditional predictors of response, regardless of the genotype [9,10]. In addition, the platelet count has been suggested as a reliable standard for assessing fibrosis [11].
The aim of this study was to evaluate the SVR and to identify the predictive baseline (pretreatment) factors and treatment-related factors associated with SVR in treatment-naïve patients with chronic HCV infection treated with the combination of PEG-IFN α-2a/-2b and ribavirin, especially in Asian country.
METHODS
Patients
This retrospective, multicenter study collected data at four tertiary referral hospitals (Soonchunhyang University Seoul, Bucheon, Cheonan Hospital, and Gangneung Asan Hospital) between June 2004 and July 2012. The following exclusion criteria were applied: (1) previous treatment for chronic HCV infection, (2) undergone hemodialysis, (3) presence of acute hepatitis, (4) unknown HCV genotype, (5) presence of hepatitis B virus co-infection, and (6) inadequate initial data. Of the 476 consecutive adult patients, 330 treatment-naive patients with chronic HCV infection were enrolled. This was a retrospective study without intervention or requirement for clinical specimens, and all of the data were analyzed anonymously, which meant that informed consent did not need to be obtained from the patients. The waiving of informed consent was approved by the Institutional Review Board (2009-04-012) at each participating center.
Treatment for chronic HCV infection
PEG-IFN α-2a/-2b plus ribavirin was administered for either 24 or 48 weeks depending on the HCV genotype. All patients were treated using standard protocols described in clinical practice guidelines, with either PEG-IFN α-2a (PEGASYS, Roche, Basel, Switzerland) or PEG-IFN α-2b (PEG-Intron, Schering-Plough, Kenilworth, NJ, USA) combined with ribavirin (Viramid, Ilsung Pharmaceuticals, Seoul, Korea). The patients were informed regarding the dosage of each drug and the treatment duration.
Measurement of clinical data and laboratory profiles
The diagnosis of cirrhosis was based on histology observations or clinical manifestations, laboratory data, and compatible abdominal imaging criteria. The laboratory data were evaluated according to treatment time for chronic HCV infection. The baseline laboratory results were assessed for the pretreatment (i.e., baseline) time point. During antiviral treatment, the HCV RNA levels were measured at baseline, and then at 4, 12, and 24 weeks after the end of the treatment. A baseline serum HCV RNA level of < 800,000 IU/mL was classified as low-level viremia. The HCV RNA level was measured using real-time polymerase chain reaction (Cobas AmpliPrep/Cobas TaqMan HCV test version 2.0, Roche Diagnostics, Basel, Switzerland; or Abbott Real Time HCV test, Abbott Diagnostics, Abbott Park, IL, USA). HCV genotyping was carried out via sequencing using a genetic analyzer (ABI 3130XL, Applied Biosystems, Hitachi, Tokyo, Japan). Information including treatment duration, dosage modification, and adherence to treatment were also assessed at the treatment cessation.
Evaluation of efficacy and adherence to treatment
Rapid virological response (RVR) and early virological response (EVR) were evaluated at 4, 12 weeks, respectively. Treatment for all HCV genotypes was stopped at week 12 if the HCV RNA decrease was less than 2 log10 IU/mL, which was in accordance with the guidelines [5,6]. The efficacy of treatment was assessed using the SVR rate, which was defined as undetectable serum HCV RNA at 24 weeks after the end of treatment, with a target of ≥ 80% adherence to treatment duration, PEG-IFN α-2a/-2b dosage, and ribavirin dosage. Therefore, a treatment adherence of ≥ 80/80/80 was defined as adhering to at least 80% of the scheduled interferon, ribavirin dosage and assigned treatment duration [12].
Statistical analysis
All treatment evaluations were assessed by intention-to-treat analysis. Patients who could not be judged as having achieved an SVR were considered non-SVR. Data are expressed as mean ± SD or number (%) values, as appropriate. When comparing the characteristics of patients in two different groups, the chi-square test and Fisher exact test were used for categorical data, and Student t test and Mann-Whitney U test were used for continuous variables. The results of the logistic regression analysis are reported as the odds ratio (OR) and 95% confidence interval (CI). A receiver operating characteristic (ROC) curve was generated for the variables that were statistically significant in multivariate analysis to assess the predictive accuracy of these models and to determine the optimal cutoff points for predicting the achievement of SVR. Area under the receiver operating characteristic curve (AUC) analysis was conducted to determine the discriminatory ability of the data. For all statistical tests, p < 0.05 was considered statistically significant. Data were analyzed statistically using SPSS version 17.0 for Windows (SPSS Inc., Chicago, IL, USA).
RESULTS
Baseline characteristics
The patients’ baseline characteristics are given in Table 1. A total of 330 patients (176 men, 154 women; median age, 49 years) who were treated with the combination of PEG-IFN α-2a/-2b and ribavirin were investigated in this study. Of these, 154 and 176 patients had genotypes 1 and 2, respectively. The serum HCV RNA level was 3.20 ± 1.56 × 10⁶ IU/mL, and 53.3% (176/330) of the patients had HCV RNA levels of < 800,000 IU/mL. The proportions of patients with an adherence of ≥ 80/80/80 and treatment duration of ≥ 80% were 65.7% and 83.0%, respectively; the corresponding values for patients who received ≥ 80% of the PEG-IFN α-2a/-2b and ribavirin dosages for the scheduled treatment were 80.6% and 83.3%.
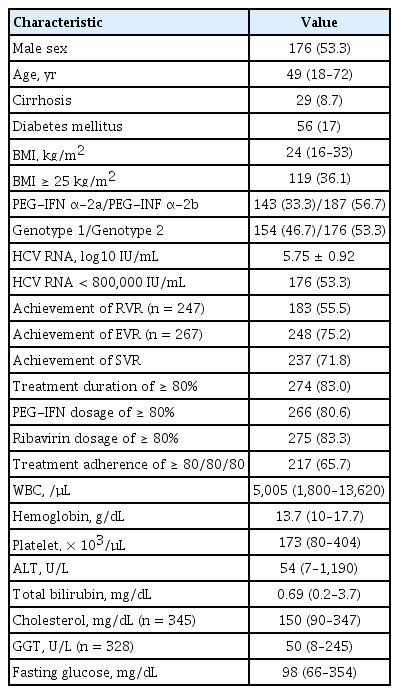
Baseline clinical characteristics (n = 330)
SVR to treatment
An SVR was achieved in 237 (71.8%) of the 330 treatment patients (Table 1). SVR rates for genotypes 1 and 2 were 63% (97/154) and 79.5% (140/176), respectively, by intention-to-treat analysis (p = 0.001). Although the SVR rate was significantly higher for genotype 1 than genotype 2 for the intention-to-treat analysis, there was no significant difference for the per-protocol analysis (74.7% vs. 84.4%, p = 0.087).
Predictive factors of SVR at baseline
Baseline factors that could be associated with an SVR were compared between SVR and non-SVR patients (Table 2). Univariate analysis revealed that the following factors could be significantly associated with SVR: age, HCV genotype, HCV RNA level (< 800,000 IU/mL), and baseline platelet count. Multivariate analysis of these significant baseline factors revealed that young age (OR, 1.037; 95% CI, 1.009 to 1.066; p = 0.009), genotype 2 (OR, 2.620; 95% CI, 1.482 to 4.633; p = 0.001), HCV RNA level of < 800,000 IU/mL (OR, 2.857; 95% CI, 1.610 to 5.050; p < 0.001), and baseline platelet count of > 150 × 103/μL (OR, 1.020; 95% CI, 1.013 to 1.027; p < 0.001) were significantly associated with achievement of SVR, independent of other factors.

Predictive factors of SVR at baseline
Predictive factors of SVR during treatment
Table 3 lists the results for the analysis of predictive factors of SVR related to the treatment. Of patients who achieved RVR and EVR, SVR was achieved by 82% (150/183) and 75.3% (186/248), respectively. Achievement of RVR (OR, 3.984; 95% CI, 2.020 to 7.874; p < 0.001), treatment adherence of ≥ 80/80/80 (OR, 4.058; 95% CI, 2.103 to 7.832; p < 0.001) were independently associated with SVR by multivariate analysis.
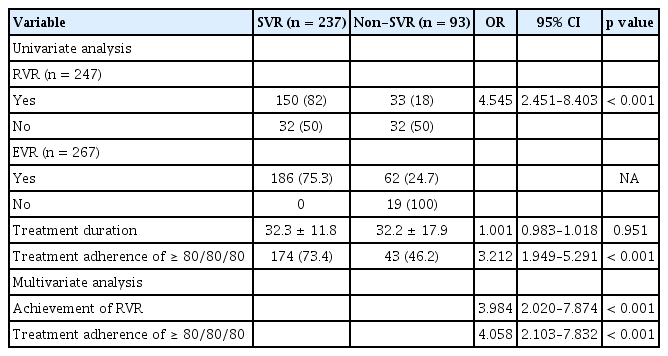
Predictive factors of SVR during treatment
Predictive factors of SVR according to genotype
Table 4 lists the results for the multivariate analysis of SVR predictors according to genotype. In 154 patients with genotype 1, young age (OR, 1.058; 95% CI, 1.021 to 1.098; p = 0.002), baseline platelet count of > 150 × 103/μL (OR, 1.020; 95% CI, 1.011 to 1.030; p < 0.001), achievement of RVR (OR, 2.890; 95% CI, 1.1740 to 7.143; p = 0.022), and treatment adherence of ≥ 80/80/80 (OR, 4.349; 95% CI, 1.764 to 10.722; p = 0.001) were independently associated with SVR. In 176 patients with genotype 2, baseline platelet count of > 150 × 103/μL (OR, 1.026; 95% CI, 1.011 to 1.040; p < 0.001), HCV RNA level of < 800,000 IU/mL (OR, 7.092; 95% CI, 2.299 to 21.739; p = 0.001), treatment adherence of ≥ 80/80/80 (OR, 3.422; 95% CI, 1.115 to 10.502; p = 0.032) were independently associated with SVR.
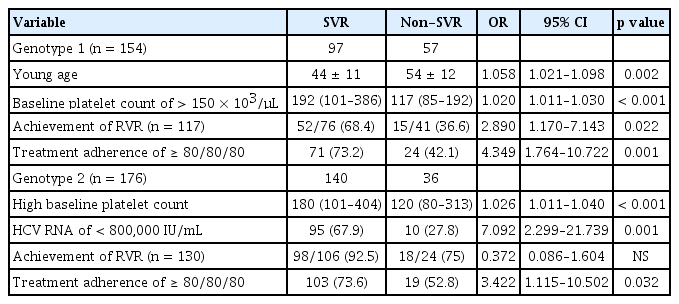
Predictive factors of SVR according to genotype (multivariate analysis)
Relationship between baseline platelet count and SVR
The significance of baseline platelet count on SVR rate was evaluated. ROC curves were constructed to determine the optimal cutoff points of platelet count for prediction of SVR. A baseline platelet count of > 150 × 103/μL count at baseline was a potential predictive factor for SVR in entire patients with chronic HCV infection: a baseline platelet count of > 150 × 103/μL had a sensitivity of 76.0%, a specificity of 83.9%, and an AUC of 0.873 (Fig. 1A). In patients with genotype 1 and 2, a baseline platelet count of > 150 × 103/μL had a sensitivity of 83.5% and 77.2%, a specificity of 77.2% and 80.7%, and an AUC of 0.782 and 0.868, respectively (Fig. 1B and 1C).
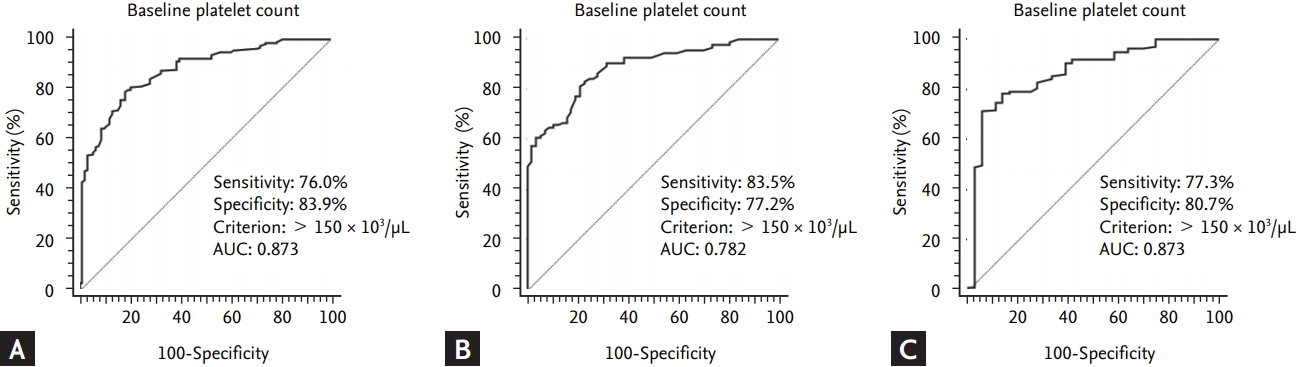
Receiver operating characteristic (ROC) curves were constructed to determine the optimal platelet-count cutoff points for the prediction of sustained virological response (SVR). (A) At baseline (i.e., pretreatment), a platelet count of > 150 × 103 /µL could be a predictive factor related to the SVR in entire patient with hepatitis C virus infection (area under the receiver operating characteristic curve [AUC] = 0.873). (B) In patients with genotype 1, a platelet count of > 150 × 103 /µL could be a predictive factor related to the SVR (AUC = 0.782). (C) In patients with genotype 2, a platelet count of > 150 × 103 /µL could be a predictive factor related to the SVR (AUC = 0.868). The solid line represents the ROC based on chance alone and has a c-statistic value of 0.5.
DISCUSSION
This study investigated the factors that may contribute to an SVR in treatment-naive patients with chronic HCV infection who are treated with the combination of PEG-IFN α-2a/-2b and ribavirin. Since baseline predictors of response are useful for advising patients about their likelihood of an SVR, and treatment-related predictors are useful for determining the treatment course and duration, factors that may influence the rate of an SVR to therapy have been investigated extensively [8]. The present study therefore focused on the SVR predictive ability of both baseline factors and treatment-related factors. Several predictors have been identified in previous clinical trials, of which the HCV genotype and HCV RNA levels have been considered the most important [5,8,13-15].
In the current study, the baseline (i.e., pretreatment) predictive factors of SVR were young age, genotype 2, HCV RNA level of < 800,000 IU/mL, and a baseline platelet count of > 150 × 103/μL. Similar to previous studies [15,16], the SVR rate for antiviral therapy was higher in younger patients than in older patients in the present study. As mentioned above, HCV genotype is one of the most important SVR predictors. Consistent with previous studies, we found that the SVR rate was higher in genotype 2 patients than in genotype 1 patients, by intention-to-treat analysis (63% vs. 79.5%, p = 0.001).
Interestingly, the SVR rates of both genotypes 1 and 2 in this study were higher than those reported previously [5,15,17]. However, the high SVR rate reported herein is compatible with the findings of previous Korean studies [18-20]. Although the reasons for this difference are largely unknown, the good outcomes of Eastern (including Korean) patients regarding treatment efficacy could be due to the favorable interleukin 28B (IL-28) gene polymorphism [21,22], the lower proportion of obese patients, and greater treatment adherence [12,19,20]. Another possible reason for the present outcome could be the low number of cirrhotic patients and the > 60% high rate of a treatment adherence of ≥ 80/80/80. In particular, the treatment was maintained for a sufficient period of time in 83% of patients. In the current study, adherence to treatment was an independent predictive factor for achievement of SVR, and the SVR rates of genotypes 1 and 2 patients were as high as 74.7% and 84.4%, respectively, when a per-protocol analysis was applied. It is well known that improved adherence to treatment can enhance SVR rates [12,18,23]. Therefore, the present findings suggest that efforts to improve adherence to treatment could increase the SVR rate among patients who obtain better outcomes on antiviral therapy.
A low baseline HCV RNA level is associated with a significantly higher probability of achieving SVR. Our results did confirm the importance of baseline HCV RNA levels (< 800,000 IU/mL) for achieving SVR by multivariate analysis [8,15].
While baseline predictive factors of SVR are useful for predicting the efficacy of antiviral therapy, they are not sufficient for clinical decision making. Therefore, knowledge of predictive factors during treatment would be extremely valuable. This study found that achievement of RVR and a treatment adherence of ≥ 80/80/80 were related to treatment-related predictive factors of SVR. This is consistent with it previously being shown that RVR at 4 weeks is an excellent predictor of SVR, especially in genotype 1 [24,25]. EVR, which is known to be one of the most important predictors of SVR, could not perform in regression analysis [26]. It would be impossible to analyses it as a predictive factor of SVR, because treatment was stopped in patients without EVR in accordance with the guidelines.
Another interesting finding of the present study is the association between platelet count and SVR in treatment for chronic HCV infection. It is well known that thrombocytopenia is associated with chronic HCV infection and could be significantly correlated with liver fibrosis stage [11,27]. In patients with chronic HCV infection, advanced fibrosis tends to be associated with a lower platelet count, and a decreased platelet count is in turn known to be associated with a diminished treatment response [28,29]. Mild thrombocytopenia is generally defined as a platelet count of ≤ 150 × 103/μL, and a platelet count of < 100 × 103/μL has been used to identify liver cirrhosis in patients with chronic viral hepatitis [11,30]. In the present study, the rate of liver cirrhosis did not differ significantly between SVR and non-SVR patients. Nevertheless, a baseline platelet count of > 150 × 103/μL was identified as a predictive factor for SVR in entire patients with chronic HCV infection. This suggests that even in the absence of definitive evidence of liver cirrhosis based on clinical measurements, a platelet count of ≤ 150 × 103/μL is associated with advanced fibrosis in patients with chronic HCV infection. In agreement with this result, it has been reported that patients with a baseline platelet count of > 120 × 103/μL had a higher probability of an SVR [31-33]. Thus, the findings of the present study suggest that thrombocytopenia is an important factor for SVR prediction; it is considered beneficial in predicting the response of patients treated with PEG-IFN plus ribavirin.
Treatment in patients with chronic HCV infection is changing from interferon based therapy to DAA. However, although DAA has high cure rate, many patients are not treated with DAA for cost and insurance problems [7]. Therefore, patients who have good baseline predictors such as a baseline platelet count of > 150 × 103/μL, young age, genotype 2 and low HCV RNA level can be treated with interferon based therapy instead of DAA.
This study was subject to several potential limitations. Selection bias was present due to the retrospective study design, and the unavailability of some data in the current study may have affected the results of the multivariate analysis. Despite these concerns, this study makes an important contribution to the understanding of predictive factors of SVR. Deviations from intention-to-treat analysis could introduce potential investigator bias with respect to interpretation of the results. This study did not investigate the IL-28 gene polymorphism. About 95% of Korean patients with chronic HCV infection have favorable IL-28 gene polymorphism to virologic response. Therefore, guidelines of the Korean Association for the Study of the Liver did not recommend the evaluation of IL-28 gene polymorphism for prediction of SVR. Finally, it was possible to underestimate the degree of fibrosis and cirrhosis, because a liver biopsy or indirect fibrosis diagnosis method such as fibroscan were not performed in all of the patients. To overcome this limitation, liver cirrhosis was diagnosed in accordance with criteria based on clinical guidelines. The possibility of cirrhosis may be suggested by the history, clinical manifestation, histology, or compatible laboratory and imaging criteria.
In conclusion, young age, genotype 2, low HCV RNA level, RVR, and treatment adherence were significantly associated with SVR. Another finding of this study demonstrates that platelet count appears to be a significant factor predicting a greater likelihood of SVR, and could thus be a useful predictor for SVR. Platelet count might therefore be useful for developing individualized treatments and optimizing treatment outcomes in patients with chronic HCV infection. Further studies are needed to confirm this.
KEY MESSAGE
1. Platelet count appears to be a significant factor predicting sustained virological response (SVR).
2. A baseline platelet count of > 150 × 103/μL was identified as a predictive factor for SVR.
Notes
No potential conflict of interest relevant to this article was reported.
Acknowledgements
This work was supported by the Soonchunhyang University Research Fund.