Left ventricular response after cardiac resynchronization therapy is related to early left atrial volume reduction
Article information
Abstract
Background/Aims
The current study aimed to elucidate a time-course change in left atrial volume after cardiac resynchronization therapy (CRT) and to verify factors associated with left atrial volume reduction (LAVR) and its prognostic implications.
Methods
The records of 97 patients were retrospectively reviewed after CRT. Echocardiographic data were analyzed at baseline before CRT, at early follow-up (FU) (≤ 1 year, median 6 months), and at late FU (median 30 months). Left ventricular volume response (LVVR) was defined as 15% reduction in left ventricular (LV) end-systolic volume (ESV). LAVR was classified into two groups by the median value at early FU: LAVR (≥ 7.5%) and no LAVR (< 7.5%).
Results
LV ESV index continuously decreased from baseline to early FU and from early FU to late FU (106.1 ± 47.4 mL/m2 vs. 87.6 ± 51.6 mL/m2 vs. 72.5 ± 57.1 mL/m2). LA volume index decreased from baseline to early FU, but there were no reductions thereafter (51.8 ± 21.9 mL/m2 vs. 45.1 ± 19.6 mL/m2 vs. 44.9 ± 23.0 mL/m2). The only echocardiographic factor associated with LAVR was change in E velocity (odds ratio [OR], 1.04; p = 0.002). Early LAVR (OR, 10.05; p = 0.002) was an independent predictor for late LVVR.
Conclusions
LAVR was related to reduction in E velocity, suggesting its relation with optimization of LV filling pressure. Early LAVR was a predictor for LVVR to CRT in long-term FU.
INTRODUCTION
Cardiac resynchronization therapy (CRT) improves symptoms and survival in patients with medically refractory heart failure and left ventricular (LV) systolic dysfunction with electrical dyssynchrony [1]. The beneficial clinical outcomes have mainly been attributed to significant reduction in LV end-systolic volume (ESV) [2]. Several studies have indicated that reduced left atrial (LA) size after CRT device implantation was also associated with favorable clinical outcomes [3,4], suggesting that reductions in both LA and LV volumes predict clinical outcomes in patients with an implanted CRT device. However, individual variability of reductions in LA and LV volumes after CRT has been described and a considerable proportion of patients showed discordant reductions in LA and LV volumes in a previous study [5].
CRT restores the homogeneous LV contraction pattern, thus reducing LV ESV and improving systolic function. CRT induces LV volume reduction (LVVR) that can be sustained for up to 3 years [6]. However, the time-course of changes in LA volume has not been well investigated after CRT. LA volume is a morphologic expression of the severity and chronicity of LV diastolic dysfunction and LV filling pressure because the left atrium is directly exposed to pressures in the LV that increase with decreased LV compliance during diastole [7]. Therefore, hemodynamic factors during diastole may determine LA volume reduction (LAVR) after CRT and the time-course of LAVR may be different from that of LVVR.
The objectives of this study were (1) to assess changes in LAVR after CRT device implantation, (2) to investigate the time-course relationship between LAVR and LVVR, and (3) to identify echocardiographic factors associated with LAVR and their clinical implications.
METHODS
Study population
Medical records of 97 consecutive patients who underwent CRT-pacemaker or CRT-defibrillator implantation between February 2010 and October 2016 at an adult heart failure clinic of a tertiary referral hospital (Severance Cardiovascular Hospital, Seoul, Korea) were retrospectively reviewed. Echocardiographic data at baseline before CRT device implantation, at early follow-up (FU) (≤ 1 year after device implantation), and at late FU (last echocardiography acquired during FU period) were analyzed. Patients were classified into two groups as follows according to the median value of LAVR at early FU: (1) LAVR and (2) No LAVR. LV response to CRT was defined as an absolute reduction in LV ESV ≥ 15% at FU echocardiography [5]. This study was approved by the Institutional Review Board of Yonsei University, Severance Hospital, Seoul, Korea (IRB No: 1-2013-0061). Written informed consent by the patients was waived due to a retrospective nature of our study.
Echocardiographic methods
LV end-diastolic volume (EDV) and ESV were measured using biplane disc methods from apical four-chamber and two-chamber views [8]. LV end-diastolic volume index (EDVI) and end-systolic volume index (ESVI) were LV EDV and ESV indexed for body surface area (BSA). LV ejection fraction (EF) was calculated using LV volumes. LA volume was calculated using the biplane area method. LA volume index (LAVI) was LA volume indexed BSA. Mitral inflow velocities were obtained using pulse wave Doppler in the apical four-chamber view. Early mitral inflow velocity (E) and late diastolic velocity were also measured, and the early mitral annular (e′) velocity was recorded from the septal mitral annulus. The E/e′ ratio was then calculated. Diastolic function was assessed by transmitral and tissue Doppler. According to mitral inflow and tissue Doppler pattern, patients were divided into grade 1 to 3 as follows: grade 1, relaxation abnormality; grade 2, pseudonormalization; and grade 3, restrictive LV filling pattern [9]. The calculated systolic pulmonary artery pressure was defined as: 4 × (maximum velocity of tricuspid regurgitant jet)2 + right atrial pressure. Right atrial pressure was estimated by measuring the inferior vena cava diameter and its response to inspiration [10].
Mitral regurgitation (MR) was graded as grade 0 to 4. The qualitative, semiquantative, and quantitative parameters used to grade MR were standard criteria based on the American Society of Echocardiography recommendations [11]. Changes between baseline and early FU (Δ) values were calculated for LV ESVI (ΔLV ESVI), LV EF (ΔLV EF), LAVI (ΔLAVI), E (ΔE) velocity, E/e′ (ΔE/e′), and MR (ΔMR) grade.
Clinical events
Patients who underwent baseline echocardiography were followed up across a median of 22 months (interquartile range, 12 to 33) for a composite endpoint that included cardiac death and inpatient admission for heart failure. The occurrence of clinical events was ascertained by reviewing hospital records and by telephone interview, as necessary.
Statistical analysis
Variables are presented as mean ± standard deviation or number (%). Paired t tests were used to compare time-course changes for echocardiographic variables after CRT device implantation. Groups were compared using chi-square statistics for categorical variables and Student’s t test for continuous variables. If distributions were skewed, the Mann-Whitney U or Kruskal-Wallis nonparametric tests were used as appropriate. The correlation among changes in echocardiographic variables was assessed using Pearson’s correlation coefficient for variables with a normal distribution and Spearman’s correlation coefficient for those with a non-normal distribution. To determine the independent factors associated with LAVR, univariate and multivariate logistic regression analyses were performed. A p value < 0.05 was considered statistically significant.
RESULTS
Echocardiography was performed in all 97 patients at baseline and at early FU (100.0%) and in 83 patients at late FU (85.6%). Late FU echocardiography was lost in 14 patients, including seven patients with cardiovascular mortality within 1 year after CRT and seven patients who had not undergone late FU echocardiography after 1 year. Early and late FU echocardiography were performed at a median of 6 months (interquartile range, 4 to 7) and 30 months (interquartile range, 21 to 38), respectively.
Baseline characteristics
Table 1 shows baseline characteristics of the study population. The mean age was 66 ± 12 years, and 46 patients (47.4%) were women. Ischemic heart failure was present in 12 patients (12.4%). Left bundle branch block (LBBB) was identified in 69 patients (71.1%), and mean QRS duration was 163.6 ± 21.9 msec. CRT pacemakers were implanted in 24 patients (24.7%). Median LAVR at early FU was 7.5%. There were no significant differences in baseline characteristics including diverse echocardiographic variables between LAVR and no LAVR groups.
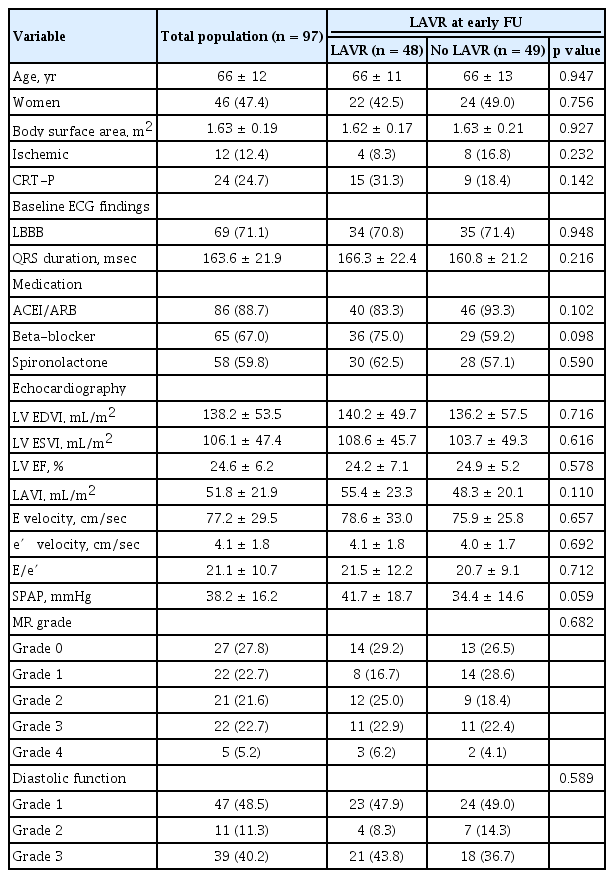
Baseline characteristics of study population
Echocardiographic data
Mean LV ESVI and LAVI at baseline were 106.1 ± 47.4 and 51.8 ± 21.9 mL/m2, respectively. As shown in Fig. 1, LV ESVI continuously decreased from baseline to early FU (106.1 ± 47.4 mL/m2 vs. 87.6 ± 51.6 mL/m2, p < 0.001) and from early to late FU (87.6 ± 51.6 mL/m2 vs. 72.5 ± 57.1 mL/m2, p < 0.001). In contrast, LAVI significantly decreased from baseline to early FU (51.8 ± 21.9 mL/m2 vs. 45.1 ± 19.6 mL/m2, p < 0.001), but there were no significant reductions thereafter (45.1 ± 19.6 mL/m2 vs. 44.9 ± 23.0 mL/m2, p = 0.599).
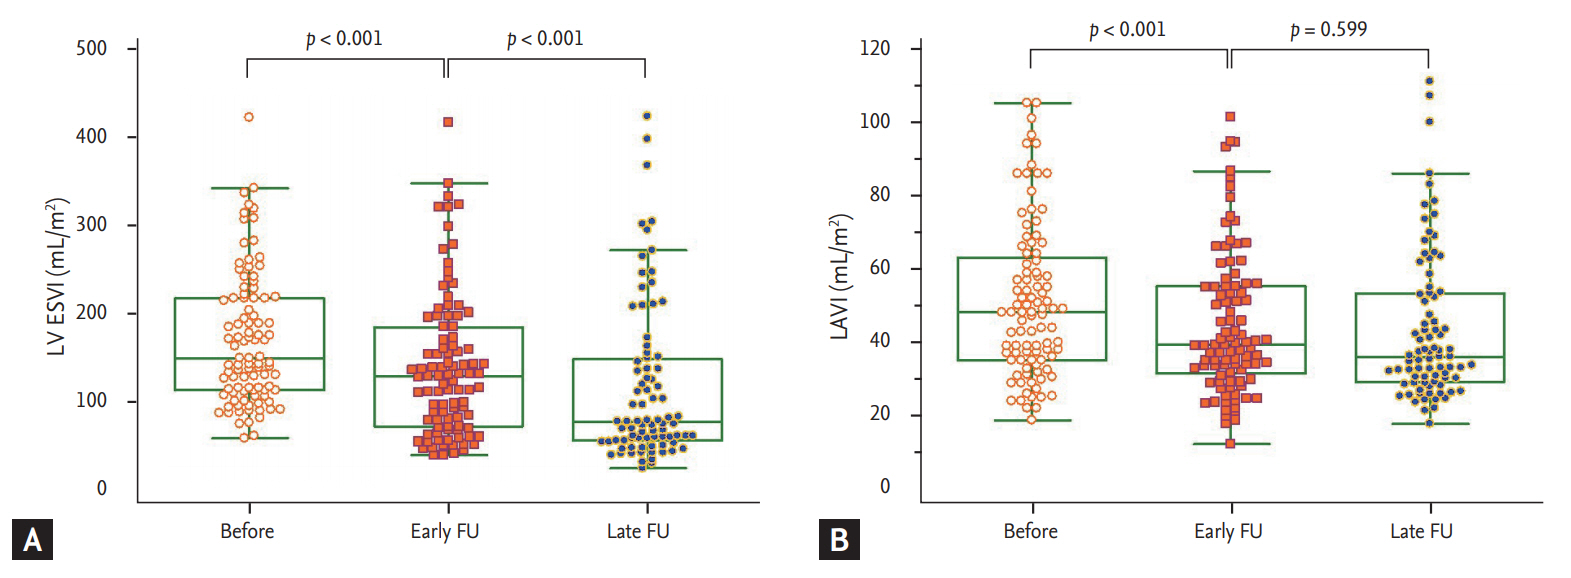
Time course changes in left ventricle and left atrium. (A) Left ventricular end-diastolic volume index (LV ESVI). (B) Left atrial volume index (LAVI). FU, follow-up.
Echocardiographic data at baseline, early FU, and late FU are shown in Table 2. LV EDVI, LV EF, MR grade, and diastolic function grade showed continuous changes from baseline to early FU and from early to late FU, similar to the changing pattern of LV ESVI. E velocity and E/e′ decreased from baseline to early FU, but there were no reductions thereafter, similar to the changing pattern of LAVI. There were no significant changes in e′ velocity from baseline to early FU (4.1 ± 1.8 cm/sec vs. 3.9 ± 1.3 cm/sec, p = 0.216), and e′ velocity increased at late FU (3.9 ± 1.3 cm/sec vs. 4.3 ± 1.3 cm/sec, p = 0.025).
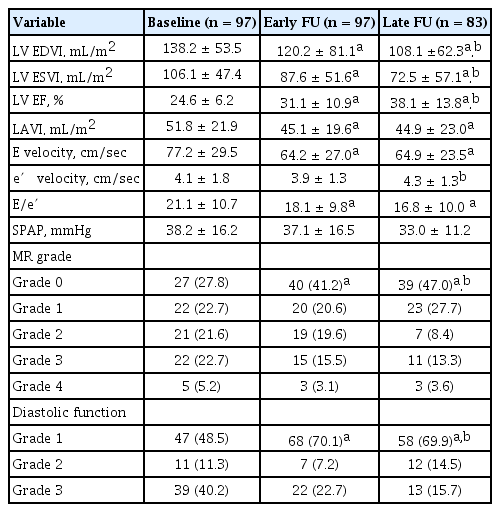
Comparison of time-course changes in echocardiographic variables
Factors associated with LAVR at early FU
Fig. 2 demonstrates simple correlations of ΔLAVI to ΔE velocity, ΔE/e′, ΔLV ESVI, and ΔLV EF. There were significant positive correlations between ΔLAVI and ΔE velocity (r = 0.616, p < 0.001) and between ΔLAVI and ΔE/e′ (r = 0.494, p < 0.001). However, no significant correlations were found between ΔLAVI, ΔLV ESVI, and ΔLV EF. Table 3 shows the results of logistic regression analysis for factors associated with LAVR at early FU. In univariate analysis, ΔLV ESVI, ΔEF, ΔE velocity, and ΔE/e′ were associated with LAVR (all p < 0.05), whereas baseline echocardiographic variables did not show any association with LAVR. In multivariate analysis, ΔE velocity was the only independent factor associated with LAVR, even after adjusting for ΔLV ESVI, ΔLV EF, ΔE/e′, and ΔMR grade (odds ratio [OR], 1.04; 95% CI, 1.02 to 1.07; p = 0.002).

Simple correlation between changes in left atrial volume index (LAVI) and other echocardiographic variables. (A) Early mitral inflow velocity. (B) Early mitral to mitral annular velocity ratio. (C) Left ventricular end-systolic volume index (LV ESVI). (D) Left ventricular ejection fraction (LV EF). E velocity, early mitral inflow velocity; e′ velocity, early mitral annular velocity.

Factors associated with higher left atrial volume reduction at early follow-up
Fig. 3 compares diastolic function before and early after CRT for the LAVR groups. There were no significant differences in diastolic function between the two groups at baseline before CRT (p = 0.589). There were more patients with grade 1 (87.5% vs. 53.1%) than grade 3 (10.4% vs. 35.4%) diastolic function in the LAVR group (p = 0.001).
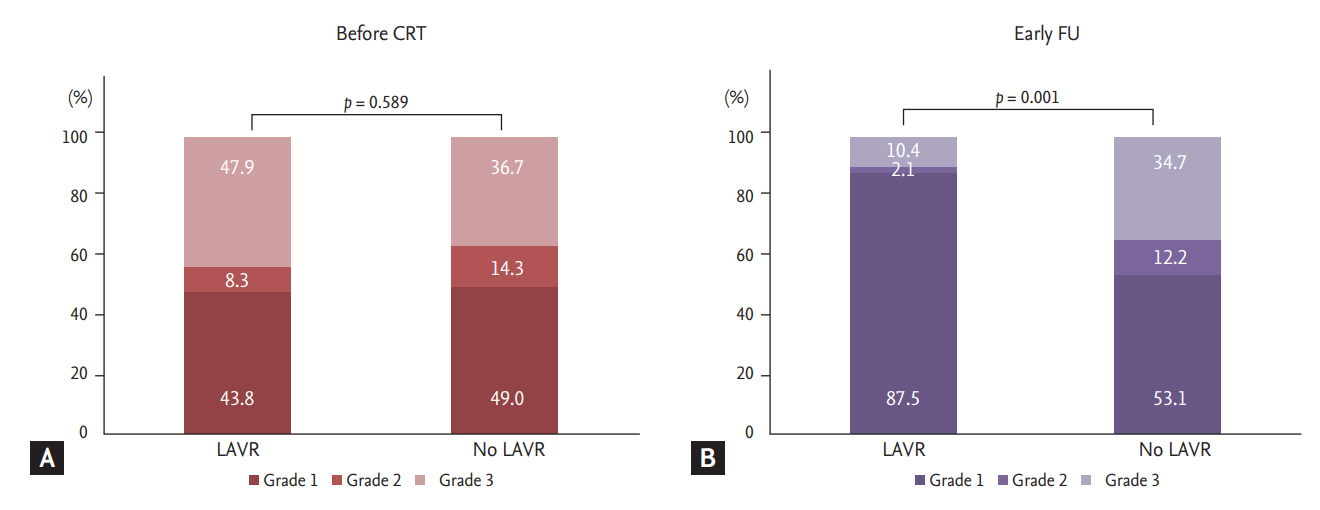
Comparison of changes in diastolic function before cardiac resynchronization therapy (CRT) and at early follow-up (FU) between left atrial volume reduction (LAVR) and no LAVR. (A) Diastolic function grade before CRT. (B) Diastolic function grade at early FU.
Factors associated with LV response to CRT
Among all 97 patients after CRT, 55 patients (56.7 %) had early LV response. The number of LV responses increased at FU, and 60 of 83 patients (72.3 %) had LV response at late FU. Fig. 4 compares the prevalence of LV response between LAVR groups according to FU period. There were no significant differences in LV response rates at early FU between the two groups (64.6% vs. 49.0%, p = 0.121). However, LV response rate at late FU was significantly higher in the LAVR group at early FU (83.3% vs. 61.0%, p = 0.029). ΔLV ESVI at late FU was higher in those with early LAVR compared to those without early LAVR (–26.3 ± 29.0 mL/m2 vs. –11.0 ± 24.8 mL/m2, p = 0.006), as well as percent changes in LV ESVI (–24.8% ± 25.2% vs. –12.7% ± 26.4%). Table 4 demonstrates multivariate analysis for determinants of late LV response. LAVR at early FU (OR, 6.94; 95% CI, 1.40 to 34.37; p = 0.018) and LVVR at early FU (OR, 12.35; 95% CI, 2.65 to 57.62) were independent predictors for the late response, even after adjustment for gender, LBBB, QRS duration, and baseline LV ESVI and LAVI.
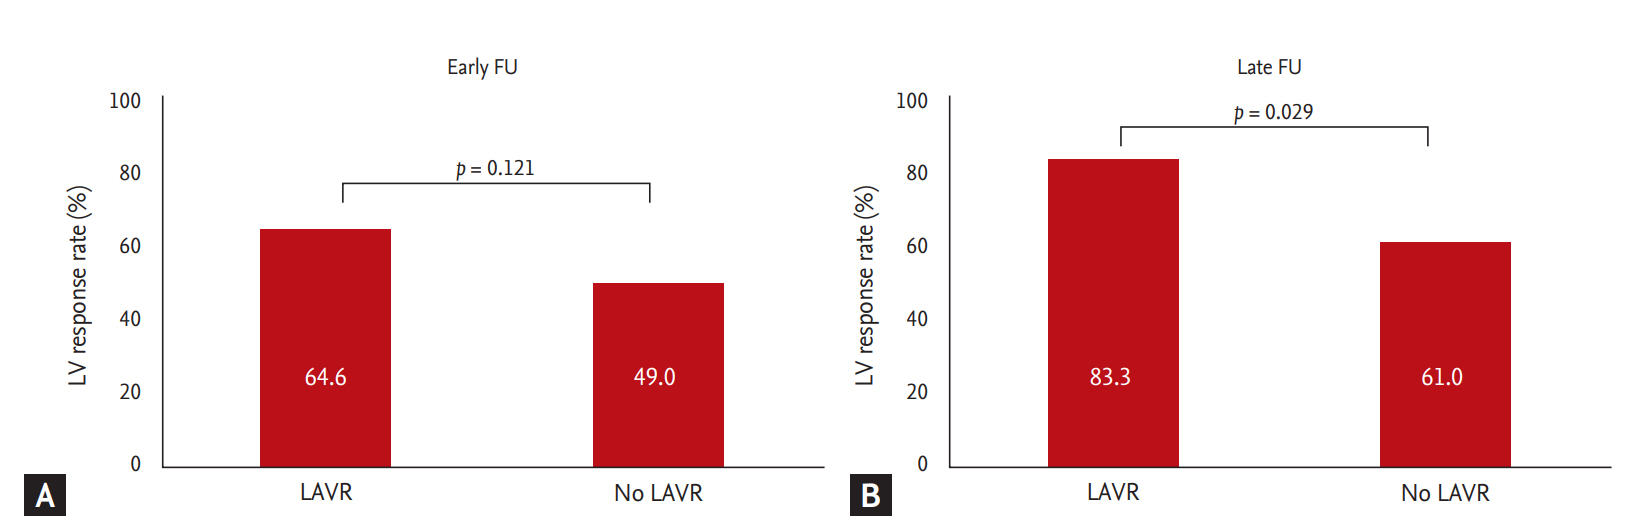
Comparison of left ventricular (LV) response between left atrial volume reduction (LAVR) and no LAVR. (A) Prevalence of LV response at early follow-up (FU). (B) Prevalence of LV response at late FU.
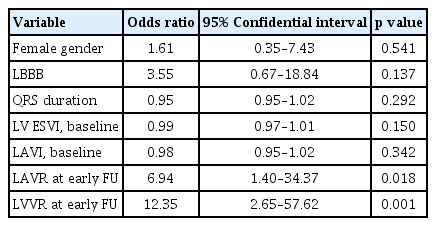
Multivariate analysis for predictors of left ventricular response at late follow-up
Clinical events and LAVR
Over the course of the study period, 26 patients (26.8%) experienced the composite endpoint. Specifically, 13 patients (13.4%) experienced death from cardiac causes and 13 patients (13.4%) experienced inpatient admissions for heart failure. Fig. 5 shows event-free survival rates for the composite endpoint stratified by LAVR at early FU. Patients with early LAVR demonstrated a trend of favorable event-free survival compared to those without early LAVR (log-rank p = 0.066).
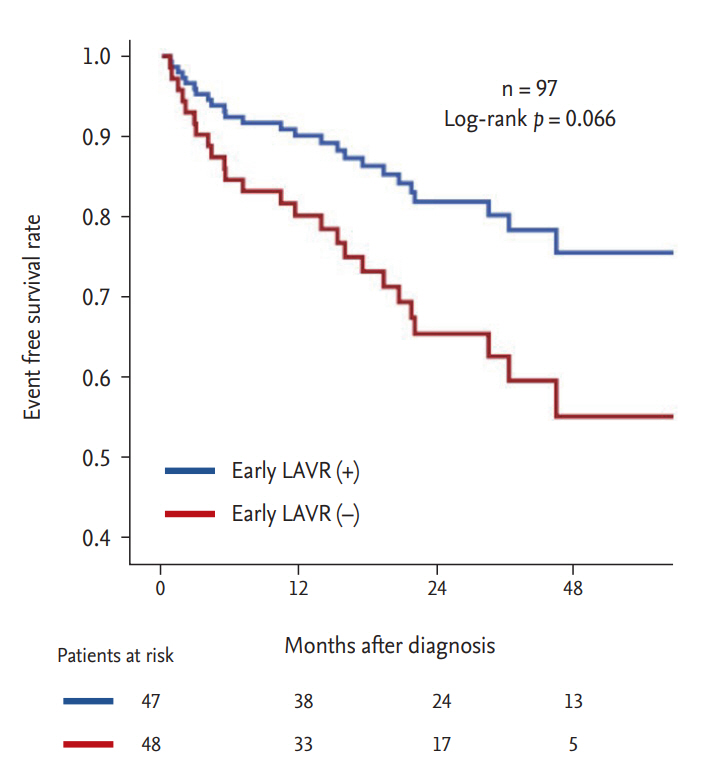
Comparison of event free survival rate for composite cardiovascular events stratified by left atrial volume reduction (LAVR) at early follow-up.
DISCUSSION
The principal findings of the current study examining longitudinal changes in LV and LA volume after CRT were that: (1) LAVR occurred early (median 6 months) after CRT whereas LVVR was sustained through the long-term FU period (median 30 months); (2) LAVR was closely associated with changes in E velocity and mitral inflow pattern, suggesting its relation with LV filling pressure and optimization of mitral inflow pattern; (3) early significant LAVR was closely related to long-term LV response to CRT.
Time course changes of LAVR and LVVR
CRT induces favorable changes in LV activation pattern, thus improving cardiac performance and reducing LV ESV [12,13]. Because CRT response is usually defined according to the percentage of LV ESV reduction [14], LVVR is an important determining factor for outcomes and functional improvement in patients with CRT device implants [2]. LVVR after CRT was reported to be a better predictor of long-term survival than clinical response evaluated by improvement in New York Heart Association class or the 6 minutes walking test [15].
LVVR usually accompanies LAVR [16-18], but discrepant LAVR and LVVR has been reported in approximately 20% of patients at 1 year after CRT, in which patients with discordant LA and LVVR showed more favorable outcomes compared to lesser volume reduction of both chambers [5]. LAVR was maximized in the earlier period compared to LVVR and then stagnated, suggesting a discrepancy in the time-course changes of LA and LV volume that resulted in discrepant LAVR and LVVR at 1 year after CRT. LAVR was also a predictor for late LV response. Therefore, more favorable outcomes in patients with discordant LA and LVVR compared to lesser volume reduction of both chambers could be explained by this time gap in which LVVR follows LAVR. More than 1 year long-term FU is necessary to define LV response to CRT, especially in patients with a favorable LAVR during the early FU period.
Associated factors with LAVR
We found that ΔE velocity or ΔE/e’ was more associated with early LAVR than ΔLV ESV or ΔLV EF. That is, LAVR was more closely related to hemodynamic variables during diastole, such as E velocity, E/e′, and MR severity rather than LV volumetric or functional parameters. This finding also explains the discrepant LAVR and LVVR values after CRT [5], which might be because different factors determine LAVR and LVVR.
Interestingly, E velocity was the most important factor for early LAVR in our study. It was more important than E/e′, a well-known estimation of LV filling pressure. E velocity is directly influenced by LA pressure and LV diastolic function, whereas e′ is influenced by LV relaxation and independent of LA pressure. E/e′, correcting E velocity for the influence of relaxation (e′), is traditionally considered to reflect LV filling pressure [19]. A plausible explanation for the stronger association of E velocity to LAVR over E/e′ in the current study is that e′ is unreliable in LBBB or biventricular pacing, resulting in inaccurate E/e′ for assessing LV filling pressure [20]. E velocity adjusted by CRT optimization [21,22] could be the most important determinant for LAVR following CRT since E/e′ or e′ may be inaccurate in populations of electrical dyssynchrony and severe heart failure [22]. Larger in-depth studies are warranted to definitively identify any association between E velocity, diastolic functional recovery, and CRT optimization.
LAVR as surrogate marker for CRT response
Both LAVR and LVVR at early FU were independent factors for long-term CRT response. Since echocardiographic CRT response is usually defined using the criteria of 15% reduction of LVESV, it is not surprising that early LVVR was an independent predictor for long-term CRT response in the current study. More interestingly, early LAVR independently predicted future CRT response. LAVR has been reported to predict clinical outcomes in patients with a CRT device implant [3,4,23]. In addition to LV systolic function, several factors may be involved in the pathophysiology of LAVR in patients with heart failure after CRT device implantation. According to Frank-Starling’s law, LA enlargement may occur as a compensatory mechanism to maintain LA stroke volume when LV filling pressure is elevated [24,25]. Reduction of LV filling pressure and LA pressure leads to decreased LA size. MR, caused by distortion of the mitral apparatus in the presence of dyssynchrony, may be reduced by CRT with a consequent decrease in LA pressure and volume [13]. CRT may induce LAVR through optimization of atrioventricular and interventricular delay [26-28], as efficient ventricle preloading through a properly timed atrial contraction has been shown to improve stroke work [29]. Considering the above-described factors, LAVR is a useful surrogate marker reflecting complex variables such as LA pressure, MR severity, and atrioventricular optimization after CRT device implantation. LAVR could be used as a surrogate marker for optimally adjusted status of CRT for each individual after device implantation. This explains why LAVR at early FU, a marker for early CRT optimization, predicted favorable LVVR during long-term FU. The clinical impact of early LAVR demonstrated a trend for favorable clinical outcomes (combined cardiac death and inpatient hospitalization) in the early LAVR group. Further studies with large numbers of patients are warranted.
Limitations
The current findings were based on a retrospective analysis, which prevents inference of a causal relationship among the variables. Nevertheless, all medical records and echocardiographic images were carefully reviewed to avoid possible biases. This was a pilot study, and further larger studies are required to conclude this hypothesis. Our study population consisted of a high prevalence of women and non-ischemic cardiomyopathy. Therefore, application of this data to other populations should be cautious. Data regarding functional status of the left atrium is lacking, and further studies using LA functional variables such as strain would be useful to better define the relationship of LA size and function to CRT response. Since changes in E velocity were related to changes in LV volume, early LA volume changes may be partially influenced by early changes in LV volume. However, mitral inflow pattern reflecting LV diastolic properties was also profoundly improved in the early LAVR group, suggesting improved diastolic dysfunction in the early phase of this group. Clinical data reflecting exercise performance, such as cardiopulmonary exercise tests and 6-minute walking tests, are lacking in this study. CRT optimization and medications, including dosages of each drug for heart failure, were administered according to the attending physician’s preference for each patient. There was no standardized protocol for the entire study population.
KEY MESSAGE
1. Left atrial volume reduction (LAVR) significantly occurred within 1 year after cardiac resynchronization therapy (CRT).
2. LAVR at early follow-up (LAVR ≥ 7.5%, within 1 year) was closed related to changes in early mitral inflow velocity.
3. LAVR at early follow-up was an independent predictor for the long-term left ventricular response to CRT.
Notes
No potential conflict of interest relevant to this article was reported.