Characteristics of kidney transplantation recipients over time in South Korea
Article information

Abstract
Background/Aims
Detailed nationwide information regarding the recent status and time trends of kidney transplantation (KT) in South Korea is limited.
Methods
We performed a nationwide, population-based cohort study using the national claims database of Korea. We included KT recipients from 2008 to 2016, and their demographic and clinical characteristics were collected. The prognostic outcome was graft failure consisted of patient death and death-censored graft failure (DCGF).
Results
We studied 14,601 KT recipients with median follow-up duration of 3.96 years. The median age at the time of transplantation consistently increased from the past, and proportion of underlying diabetes mellitus prominently increased, reaching 35.6% in 2016. The preemptive KT accounted for approximately 30% of the total transplantation cases. The recipients showed a 10-year cumulative graft survival rate of 71.8%, consisting of 10-year DCGF free survival of 77.6% and patient survival of 92.8%. Age ≥ 20 and < 30 years, age ≥ 70 years, underlying history of diabetes, non-preemptive transplantation, and poor compliance on tacrolimus and mycophenolic acid were the significant risk factors associated with worse DCGF outcome. The economic cost of KT showed prominently increasing trends, reaching a total insured fee of > 60,000,000$ in 2016. However, the expansion was mainly burdened by the national insurance service but not by the patients.
Conclusions
In South Korea, the number of kidney transplantation in elderly or in patients with comorbidities has been increasing. Complex clinical factors were associated with medication compliance and patient prognosis.
INTRODUCTION
Kidney transplantation (KT) is the best kidney replacement therapy method in terms of prognosis and quality of life for end-stage renal disease (ESRD) patients. Considering the globally emerging ESRD prevalence, accessibility to and prognosis of KT have been an important medical issue. Identifying the epidemiologic change in recipients’ characteristics and their prognosis is one of the essential evidences to guide public policy regarding KT [1].
South Korea is one of the developed countries that are suffering from a population-aging problem, which is associated with critically increasing prevalence of ESRD [2]. According to a recent report, South Korea has the 6th highest incidence rate of ESRD worldwide, which reached over 300 per million people in 2016 [3]. From the first KT cases in the year 1969, the number of transplantation cases has been prominently increasing in the country. Recognizing the clinical and socioeconomic importance of KT, the Korean Network for Organ Sharing (KONOS) has published annual reports about the characteristics of transplantation including kidney cases [4]. However, detailed information of medication usage, prognosis, and socioeconomic cost of KT in the nation has been scarcely described, although other annual reports in various regions provided an important insight regarding the era of transplantation [5-7].
In this study, we aimed to reveal the nationwide characteristics of KT in South Korea, including information such as medication compliance, prognosis, and insured medical costs that are firstly reported in the nation, by analyzing the Health Insurance Review & Assessment Service (HIRA) claims database, which includes complete claims information of people with Korean nationality. Moreover, we sought to describe the recent trends of KT in South Korea, and to generate epidemiologic evidence that can guide future policies and clinical practice.
METHODS
Ethical approval
This study was approved by the Institutional Review Board (IRB) of Seoul National University Hospital (IRB No. E-1805-003-941). The requirement for informed consent was waived by the IRB as the study analyzed an anonymous database provided by the HIRA of the Republic of Korea. The study was conducted in accordance with the Declaration of Helsinki.
Study setting and population
Nationwide health insurance is provided in South Korea through the National Health Insurance Service for all people with Korean nationality. The claims information is reviewed and finalized in the HIRA of the country. Given that KT surgery is an insured medical service, we could identify KT recipients and their characteristics by reviewing the HIRA database. We included all KT recipients from 2008 to 2016, who were identified by the specific surgery codes. We excluded those who received multi-organ transplantation. The patients who received kidney transplantation abroad were also not included in this study, as they lack the specific surgery codes and timing of transplantation could not be identified.
Data collection
Baseline clinical or epidemiologic characteristics of the study population were collected at the time of transplantation. We also collected age, sex, and previous main dialysis method. Preemptive KT was defined when KT was performed without dialysis or with dialysis for < 3 months. Previous comorbidities were reviewed in the prior 1-year medical histories, including diagnostic codes and drug prescription records, and presence of underlying hypertension and diabetes mellitus were assessed.
The insured medical fees were included, and median cost per patient and total sum in the nation were calculated. We also described the patient cost and the National Health Insurance Service cost separately. It is should be noted that the government expanded the insurance coverage during the study period, and the overall insurance coverage ratio for the ESRD category continuously increased from 74.6% to 79.9% from 2010 to 2015 when referring to the national report [8]. For instance, the usage of rituximab as the primary desensitized agent was insured from 2009, and that of plasmapheresis was insured from 2012. The Luminex assay for donor specific antibody was covered by the insurance from 2011, whereas the panel reactive antibody test was insured throughout the study period.
Records of induction immunosuppressants included the use of anti-thymocyte globulin, interleukin 2 inhibitors, and anti-CD3 antibody. Given that patients who used anti-CD3 antibody were few, they were not included in the multivariable regression analysis. Desensitization therapy history was also identified, including use of rituximab and plasmapheresis prior to KT. Non-insured desensitization therapy before the health insurance coverage expansion was not identifiable in the dataset. The history of maintenance immunosuppressant use was identified from reviewing the claims database after the KT date. To assess the medication compliance of the maintenance immunosuppressive agents, we calculated the 1-year medication possession ratio (MPR) during a year from transplantation using the equation below [9]. We defined the poor compliance state as 1-year MPR < 95%, taking into consideration the clinical importance of maintenance immunosuppressants in kidney transplant recipients.
Outcome variables
Patient follow-up was performed until censoring of the claims data or December 31, 2017. We included graft failure, consisted of death-censored graft failure (DCGF) and mortality, as the prognostic outcome for the study. DCGF was determined by re-initiation of maintenance dialysis after transplantation, and the first date of successive dialysis sessions for 3 months was the outcome date. Given that direct death date was not included in the HIRA database, we used an operative definition for mortality as absence of any claims for more than a year. When we compared this operative definition to the death registry of a government organization, the match rate was approximately > 95%. Graft failure was a merge from DCGF and patient mortality.
Statistical analysis
We presented the categorical variables as numbers (percentage) and continuous variables as median values (interquartile ranges). Kaplan-Meier survival curves were plotted to demonstrate the prognostic outcomes. The study population was stratified according to the transplant years, and whether a significant time-trend was tested and shown with p values for trend. Given that all subjects had at least 1-year of follow-up, 1-year outcome risks according to era were additionally investigated with multivariable cox regression analysis, adjusted for age (continuous), sex, history of hypertension or diabetes mellitus, and previous dialysis method (preemptive, hemodialysis, peritoneal dialysis, both, or others). Risk factor analysis for poor compliance of maintenance immunosuppressants was performed with the logistic regression analysis by back-elimination method. All statistical analyses were performed using the R program version 3.6.0 (R Foundation for Statistical Computing, Vienna, Austria), and two-sided p values < 0.05 were implemented to indicate statistical significance.
RESULTS
Characteristics of KT recipients
We studied a total of 14,601 KT recipients, who did not undergo multi-organ transplantation in this study. The median follow-up duration was 3.96 years (interquartile range, 1.94 to 6.32). The number of KT was 1,147 cases in the year of 2008 and showed an increasing trend, reaching 2,194 cases in 2016 (Table 1). We identified that KT in the elderly population prominently increased, and in 2016, > 15% of KT recipients were aged ≥ 60 years. Along with this aging trend, the proportion of those with hypertension or diabetes comorbidities also increased during the study period.
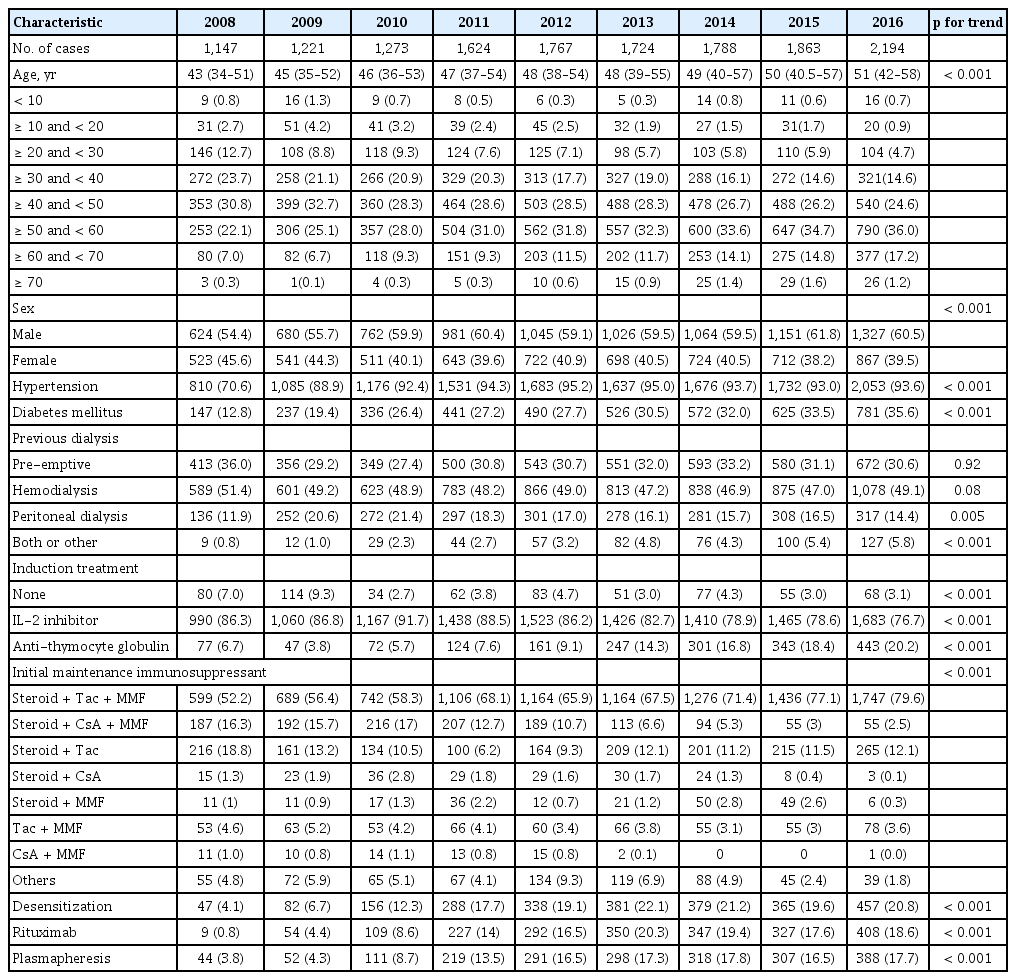
Characteristics of the kidney transplant recipients included in the study
Preemptive KT was performed for approximately 30% of total transplantation cases steadily. Along with the aging trend, the number of patients receiving both peritoneal dialysis and hemodialysis also increased compared to that in the past years. Regarding induction treatment, the proportion of recipients who received anti-thymocyte globulin prominently increased, whereas the use of interleukin-2 inhibitors decreased relatively. Among the initial maintenance immunosuppressant combinations, the triple combination of tacrolimus, steroid, and mycophenolic acid was the most common, and approximately 80% of the KT recipients received this combination therapy as the initial maintenance immunosuppressant in 2016. On the other hand, use of cyclosporine decreased continuously. The number of transplant cases with insured desensitization treatment prominently increased between 2009 and 2012, which accounted approximately 20% of the total KT cases from year 2013.
Prognosis of the study population
The Kaplan-Meier survival curves showing the DCGF, mortality, and graft failure outcomes are presented in Fig. 1. There was a rapid decrease in the survival curve regarding DCGF within 1 year, and the survival showed a relatively consistent slope afterwards. Considering censoring, the 10-year DCGF cumulative incidence was approximately 22.4%, with 10-year death risk of 7.2% and 10-year graft failure cumulative incidence of approximately 28.2%.

The Kaplan-Meier survival curves showing the transplant-related prognosis of the study population. The X-axes indicate time (years) and the Y-axes indicate cumulative survival. Outcomes are (A) death-censored graft failure, (B) mortality, and composite (C) graft failure. The survival tables are presented below the survival curves.
Given that all patients had at least 1 year of follow-up, we further analyzed the 1-year outcomes and compared them according to time-eras (Table 2). The studied recipients showed 1-year graft survival of 89.9%, consisting of 1,180 (8.1%) 1-year DCGF cases and 326 (2.2%) death events. Although the 1-year DCGF outcome did not differ according to the time-eras, 1-year death outcome was better in the recent periods. In addition, 1-year graft failure outcome was significantly better in the years 2011 to 2013 and 2014 to 2016 than in 2008 to 2010 in our multivariable analysis, and the result was marginally significant in the univariable model. The improvement in prognosis compared to the recent periods was more prominent when we investigated the adverse outcomes for the total study period, but certain difference in follow-up duration was present (Supplementary Table 1).
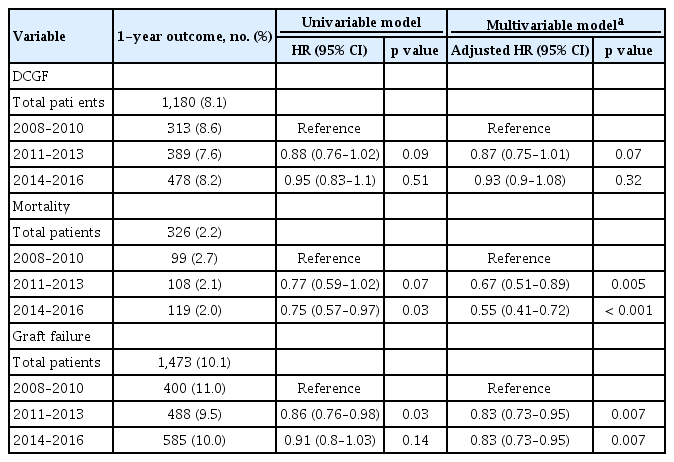
Analysis for 1-year outcomes according to era
In our risk factor analysis for DCGF or death (Table 3), the multivariable model showed that age ≥ 20 and < 30 years or age > 70 years, non-preemptive case, and underlying diabetes mellitus were independent risk factors of poor prognosis. The desensitized transplant or transplantation of children or juveniles were significantly associated with increased risk of DCGF in the univariable model, but their statistical significance disappeared when other clinical characteristics were adjusted. On the other hand, the risk of death was elevated in the older recipients than the youngest age group. Previous exposure to dialysis compared to preemptive transplantation, diabetes mellitus, and the absence of hypertension were associated with increased risk of patient mortality in the multivariable model. Receiving desensitization therapy was not associated with the risk of death in the univariable model but it was associated with the risk of modest significance when the other variables were adjusted for.
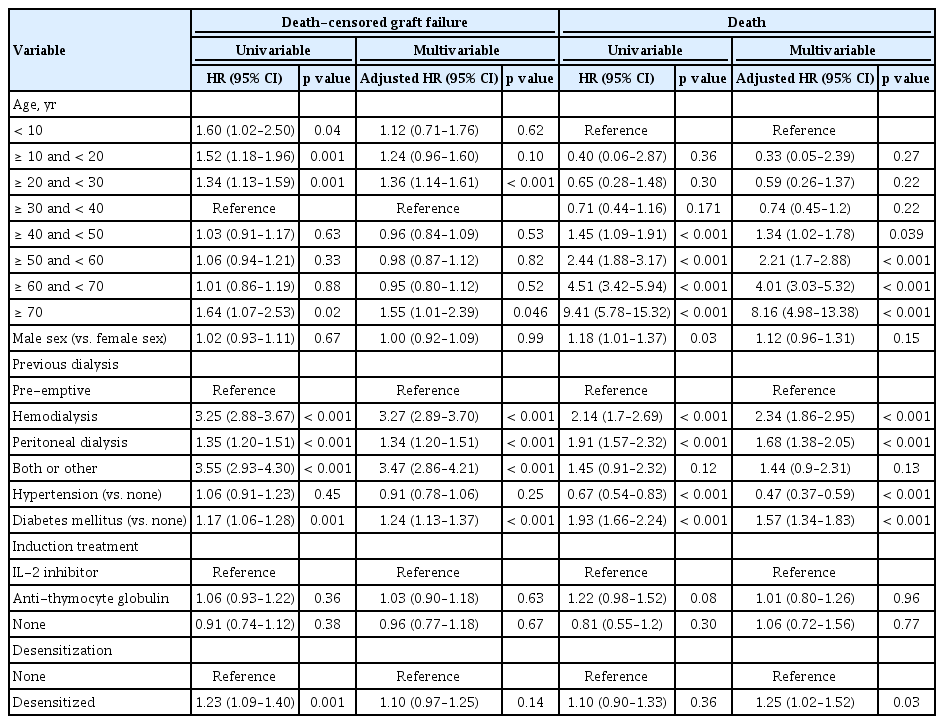
Analysis for risk factors associated with the risk of death-censored graft failure or death
Maintenance immunosuppressants
The overall main medication compliance, including tacrolimus, steroids, and mycophenolic acid improved compared to that in the past (Supplementary Table 2). The proportion of KT recipients who achieved 1-year MPR of ≥ 95% was 98.8% (tacrolimus), 90.3% (steroids), and 89.5% (mycophenolic acids) for each drug category in 2016.
When we investigated other clinical factors associated with failure to reach 1-year MPR ≥ 95% (Supplementary Tables 3-5), non-preemptive transplantation cases, or those with underlying hypertension histories had a better compliance rate for calcineurin inhibitors. Regarding mycophenolic acids, age ≥ 30 years, female patients, or those without baseline hypertension showed a relatively higher failure rate of reaching 1-year MPR ≥ 95%. For corticosteroids, age ≥ 30 and < 60 years, female sex, and preemptive transplantation were the significant risk factors of poor compliance.
When we assessed the prognosis according to a poor compliance state (Table 4), poor compliance (1-year MPR < 95%) for tacrolimus and mycophenolic acid was significantly associated with worse DCGF outcome. On the other hand, 1-year MPR < 95% of cyclosporine or steroids did not show a significant association with the DCGF prognosis.

Risk of death-censored-graft failure according to poor medication compliance status
Insured medical costs during the peri-transplantation period
The total medical costs during the peri-transplantation period (1 month before transplantation to 3 months after transplantation) prominently increased, reaching more than 63,669,150 $ in 2016, which was approximately 2.7 times of that in 2008 (Fig. 2). This was particularly evident in terms of the costs paid by the National Health Insurance Service, as median patient cost remained similar, or slightly decreased, nearing approximately 2,000$, whereas the median insurance cost per patient was increasing. Such trend was similarly identified even when we stratified the preemptive and non-preemptive cases (Supplementary Fig. 1). The difference in cost for insured medical service between the preemptive and non-preemptive transplantations was not large, as the median patient cost ranged from 2,000$ to 3,000$, and the median insurance cost per patient was 19,000$ to 25,000$, after the year 2010, regardless of the transplantation types.

Insured medical fee during the study period. The histograms indicate the sum of insured medical fee during the peri-transplantation period, which was defined as the period from 1 month before the transplantation to 3 months after the date of transplantation, following the left Y-axes. The dark grey histograms indicate the insured fee covered by the National Health Insurance Service, and the light-grey histograms indicate the fee paid by the patient. The line graphs indicate the median cost per patient, also collected during the peri-transplantation period, following the right Y-axes. The blue line graph indicates the median cost burdened by the National Health Insurance Service, and the red line graph indicates the median cost paid by the patient. The currency exchange rate was 1181.5 South Korean won for 1 US dollar.
DISCUSSION
In this nationwide cohort study in South Korea, we described the recent trends of transplantation characteristics in the nation. Transplantation for elderly ESRD patients has become more common age ≥ 30 years in recent years than in the past. Despite this aging trend, the overall graft prognosis, particularly mortality outcome, was better in the recent periods. Medical compliance was partially improved during the study period, while certain risk factors for poor compliances were identified herein. The overall economic cost for transplantation has prominently increased, and the government paid for > 50,000,000$ during the peri-transplantation period of 2,194 recipients in the year 2016.
Being one of the most important treatment strategies for the emerging ESRD population, the national cost for KT is an important issue. Thus, future improvements in donor allocation, donor shortage, discrepancy in accessibility to transplant, prognosis of recipients, and socioeconomic cost for transplantation are still necessary. In several countries, certain annual reports and nationwide studies described the characteristics of KT in their nations [5-7,10-12]. In South Korea, KONOS issued important annual reports regarding the characteristics of KT in the nation [4], and further information regarding detailed characteristics, prognosis, medication usage, and economic cost was warranted [13]. By this nationwide cohort study, we successfully described the recent trends of KT in South Korea, including information that was not available in the previous reports. Given that the prevalence of ESRD is critically increasing in South Korea, wherein the aging problem is rapidly progressing, our study may give important perspectives not only for understanding the recent trends, but also for predicting important social and medical issues in the future [14]. Particularly, transplantation cases among the elderly population with more comorbidities and requiring desensitization therapy have been increasing, suggesting that transplantation in complex medical situations will be an important medical issue in the near future.
Considering that ESRD prevalence is even more increasing and that relatively old ESRD patients more commonly undergo transplantations in the recent years, further expanding the demands for transplantation, the problem of donor shortage may be even more aggravated in the future [2]. Transplantation from extended donor criteria may be considered for potential elderly recipients; however, to ensure that this would lead to better prognosis, clinical evidences for safety in the nation both in donors and recipients are warranted. In addition, this donor shortage or old-age transplant issue may eventually lead to socioeconomic discrepancy in the accessibility of KT. Future investigations to assess whether socioeconomic deprivation is related to different KT accessibilities will be important in South Korea [15]. In addition, our finding showing desensitization was not an independent risk factor for DCGF in our multivariable model indicates that such advanced intervention could be actively implemented to increase the donor pool [16]. Still, as the majority of the desensitized transplantation cases would be from the blood group mismatched donors, whether highly sensitized recipients show a similar prognosis to the others in South Korea should be assessed in a future study with longer follow-up duration and information of the degree of sensitization [17,18].
The overall prognosis of KT in South Korea was comparable to those of other developed countries [5-7]. However, the graft failure rate seemed relatively worse when compared to pure Asian population in the recent OPTN/SRTR annual data. A further study is warranted to clearly dissect the prognosis of KT recipients, including more detailed information of donors (e.g., number of human leukocyte antigen mismatches, deceased donor) [1,13]. On the other hand, the prognosis regarding mortality was better in the recent years than in the past years, although high-risk transplant cases have been relatively more common in the recent years. With a longer follow-up duration, there would be more clear evidence on whether prognosis of KT has improved, and identification of a target population in which further improvement is necessary would be possible.
Medication usage or interventions regarding KT has been changing in South Korea, and such information is rarely reported before. Desensitization therapy or induction with anti-thymocyte globulin was more frequently implemented in the recent periods, which may be related to the increased proportion of receiving allograft from blood type mismatched or HLA incompatible donors. Usage of cyclosporine has decreased, whereas tacrolimus was the commonly prescribed calcineurin inhibitors. Although the medication compliances for major maintenance immunosuppressants showed an improving trend, there was still a certain patient group with an increased risk of failure to reach sufficient maintenance immunosuppressant administration. KT recipients with specific age ranges those who are female, or those without previous dialysis may be the group of interest in whom compliance improvement should be encouraged and side effects should be monitored. Moreover, given that transplant prognosis was significantly worse in those with poor compliance to tacrolimus or mycophenolic acid, the patients at risk for poor compliance should be thoroughly followed up for appropriate prescription.
Lastly, along with the increased number of ESRD patients who benefitted from transplantation than the past, the socioeconomic cost for insured medical service during the peri-transplantation period modestly increased. Given that transplantation results in reduced overall healthcare costs and improved prognosis for ESRD patients than dialysis [16,19], such investment may further be expanded in the future to ameliorate the increasing burden of ESRD [20]. An interesting finding was that the median cost paid by the patients remained similar, whereas the cost paid by the National Health Insurance Service was increased both in sum and median values. This may imply that the government had expanded health insurance support and successfully limited the increment in patient burden, further contributing to the increased number of KT in recent years. The number of ESRD patients waiting for transplantation and consequently KT-associated costs would similarly increase in the near future, as KT is currently the best treatment option for most ESRD patients. Healthcare providers and the government should make efforts to secure appropriate accessibility to KT by preventing financial obstacles.
Our study has several limitations and unanswered questions that warrant further research. First, the study results are based on a national claims database that has innately limited sensitivity. There might have been certain unavailable medical information outside the nation or hidden inaccuracy regarding insurance codes. In addition, although MPR is a useful surrogate marker to identify compliance in the claims database, it cannot detect the actual dose of drug administered to each patient. Second, certain variables, specifically regarding donor information, actual death information, and non-insured medical costs or non-insured desensitization therapy, were not included in this study. A further study linking other nationwide transplantation databases may additionally reveal important characteristics of transplantation in South Korea. However, as we have validated our operative death definition in another death registry in the nation and our finding was true regarding insured medical costs, we believe that such limitation may not critically alter the main message of our study. Third, social factors related to trends in transplantation in South Korea were hard to be included in detail. Given that transplantation is one of the medical services that is largely affected by socioeconomic status, additional consideration for such external factors may be necessary. Lastly, although our study has a descriptive value, an additional effort should be taken to investigate how to overcome the remaining issues in transplantation, including accessibility, prognosis, donor safety, or socioeconomic cost, in the future. Health care providers should develop countermeasures to handle the major shifts, which were identified in this study, in the era of transplantation in South Korea.
In conclusion, the characteristics of transplant recipients in Korea were changing, and the aging issue was also present in the field of KT. Although the number of transplantation cases increased and improvement regarding prognosis was observed, this accompanied a modest increase in the economic cost of the society. Clinicians and health care providers should mind the findings to improve the quality of medical services for KT recipients.
KEY MESSAGE
1. The number of kidney transplantation has been increased in Korea reaching over 2,000 cases in 2016.
2. The characteristics of transplant recipients in Korea were changing, and the aging issue was present in the field of kidney transplantation.
3. The prognosis of kidney transplantation in Korea showed improving trends in the recent periods.
Supplementary Materials
Insured medical fee during the peri-transplant period in (A) non-preemptive and (B) preemptive transplantation case, respectively. The histograms indicate the sum of insured medical fee during the peri-transplant period, which was defined as from 1 month before to 3 months after the date of transplantation, following the left y-axes. The dark grey histograms indicate the insured fee covered by the national health insurance service, and the light-grey histograms indicate the fee paid by the patient. The line graphs indicate the median cost per patient, also collected during the peri-transplant period, following the right y-axes. The blue line graphs indicate the median cost burdened by the national health insurance service, and the red line graphs indicated the median cost paid by the patient. The currency exchange rate was 1,181.5 South Korean won for 1 US dollar.
Risk factors for poor medical compliance (1-year MPR < 95%) for calcineurin inhibitor
Notes
No potential conflict of interest relevant to this article was reported.
Acknowledgements
This study was supported by a grant from the Ministry of Health and Welfare, Republic of Korea (grant number: HI18C1604).