Risk for metabolic syndrome in the population with visceral fat area measured by bioelectrical impedance analysis
Article information
Abstract
Background/Aims
To investigate whether visceral fat area (VFA) measured by bioelectric impedance analysis (BIA) was associated with metabolic syndrome in subjects with and without obesity.
Methods
A total 23,202 participants who underwent medical check-ups were assessed. Participants were stratified by body mass index (BMI) and VFA. We evaluated six different groups for metabolic syndrome: Group 1 (normal weight and low VFA), Group 2 (normal weight and high VFA), Group 3 (overweight and low VFA), Group 4 (overweight and high VFA), Group 5 (obesity and low VFA), and Group 6 (obesity and high VFA).
Results
Metabolic syndrome traits and metabolic syndrome were significantly more prevalent in the high-VFA (≥ 100 cm2) subgroup in each BMI group. Adjusted logistic regression analyses revealed that the odds ratio for metabolic syndrome compared with Group 1 was the highest in Group 6 (24.53; 95% confidence interval [CI], 21.77 to 27.64). Notably, the odds ratio of Group 2 was higher than that of Group 3 (2.92; 95% CI, 2.30 to 3.69 vs. 2.57; 95% CI, 2.23 to 2.97).
Conclusions
Our study demonstrates that the combination of BMI assessment and VFA determination by BIA may be a useful method for predicting the risk of metabolic syndrome. The VFA by BIA may be a useful target for interventions to improve metabolic syndrome.
INTRODUCTION
Due to recent changes in eating habits and lifestyle, the prevalence of obesity is increasing worldwide [1,2], regardless of race, age, and gender, and the incidence rates and complications of obesity-related diseases are increasing. People with obesity are more likely to develop metabolic disorders such as metabolic syndrome, type 2 diabetes, hypertension, dyslipidemia, ischemic heart disease, stroke, fatty liver, gallbladder disease, and thyroid disease [2-4].
Visceral fat plays an important role in the development of metabolic and cardiovascular diseases [5-7]. However, body mass index (BMI), the main measure used to determine obesity, does not account for the amount of muscle and fat, but simply accounts for body weight [8]. Therefore, there is a limit to predicting obesity-related disease. In addition, it is possible to evaluate abdominal obesity through the measurement of waist circumference [9], but there are limitations in that body fat percentage cannot be measured directly, and the reproducibility is poor due to large errors in the measurements [10]. Methods for measuring visceral fat area (VFA) include dual energy X-ray absorptiometry, computed tomography (CT), and magnetic resonance imaging; however, these methods require expensive equipment and exposure to radiation, which limits their use. Current body composition analysis through bioelectrical impedance analysis (BIA) is the most widely used method because it has the advantage of measuring body fat and muscle mass easily and inexpensively [11-13].
In this study, we analyzed the relationship between metabolic syndrome in the obesity group defined by BMI and the obesity group defined by the VFA determined by bioelectrical impedance and assessed the risk of metabolic syndrome by subdividing the groups according to the combination of BMI and VFA.
METHODS
Study population
We identified 43,837 adults (≥ 18 years old) who underwent voluntary routine check-ups at the National Health Insurance Service Ilsan Hospital between January 2011 and December 2015. When participants underwent multiple examinations, we analyzed the data from their first visit. We excluded participants with BMI less than 18.5 kg/m2. In total, 23,202 participants were included in this study. This study was approved by the Institutional Review Board of the National Health Insurance Service Ilsan Hospital (IRB No.: 2017-04-043-002). Written informed consent by the patients was waived due to a retrospective nature of our study.
Data collection
The participants arrived at the hospital after an overnight fast. Clinical and laboratory data were collected during the health examination. The height and weight of each participant were measured while he/she maintained a straight standing posture while wearing a light examination suit and no shoes, and the BMI was calculated. The waist circumference was measured mid-way between the lowest rib and the iliac crest. Visceral fat area was measured by a trained nurse using an InBody 720 (Biospace Co., Seoul, Korea) according to the manufacturer’s protocol. The following clinical and laboratory data were collected: age, body weight (kg), body mass index, smoking, drinking habits, waist circumference (cm), systolic blood pressure (mmHg), diastolic blood pressure (mmHg), uric acid (mg/dL), total cholesterol (mg/dL), high-density lipoprotein cholesterol (HDL-C; mg/dL), low-density lipoprotein cholesterol (LDL-C; mg/dL), triglycerides (mg/dL), fasting glucose (mg/dL), hemoglobin A1c (HbA1c, %), gamma-glutamyl transferase (GGT, U/L), aspartate aminotransferase (AST, U/L), and alanine aminotransferase (ALT, U/L).
Definitions
The cut-off point for obesity for Asians is defined by the World Health Organization as a BMI of 23.0 kg/m2 [14]. The participants were divided into three groups by BMI: normal weight (18.5 to 22.9 kg/m2), overweight (23 to 24.9 kg/m2), and obesity (≥ 25 kg/m2). The definition of obesity by VFA was set as VFA ≥ 100 cm2 [15].
Participants were categorized into six groups according to the combination of BMI and VFA. The six groups were (Fig. 1): (1) normal weight and VFA < 100 cm2 (Group 1); (2) normal weight and VFA ≥ 100 cm2 (Group 2); (3) overweight and VFA < 100 cm2 (Group 3); (4) overweight and VFA ≥ 100 cm2 (Group 4); (5) obesity and VFA < 100 cm2 (Group 5); and (6) obesity and VFA ≥ 100 cm2 (Group 6).
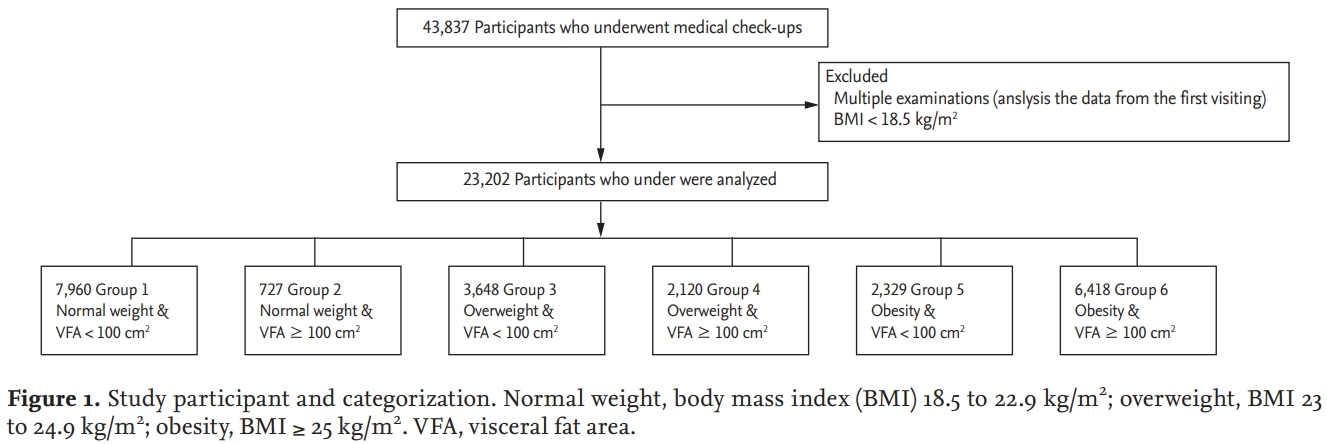
Study participant and categorization. Normal weight, body mass index (BMI) 18.5 to 22.9 kg/m2; overweight, BMI 23 to 24.9 kg/m2; obesity, BMI ≥ 25 kg/m2. VFA, visceral fat area.
Metabolic syndrome was defined in accordance with the National Cholesterol Education Program Expert Panel on Detection, Evaluation, and Treatment of High Blood Cholesterol in Adults, Adult Treatment Panel III. Participants were defined as having metabolic syndrome if they had three or more of the following five factors: (1) waist circumference: male ≥ 90 cm, female ≥ 80 cm; (2) triglycerides: ≥ 150 mg/dL or use of medication; (3) HDL-C: male < 40 mg/dL, female < 50 mg/dL or use of medication; (4) blood pressure ≥ 130/85 mmHg (systolic blood pressure ≥ 130 mmHg or diastolic blood pressure ≥ 85 mmHg) or use of medication; and (5) fasting glucose ≥ 100 mg/dL or use of medication.
Statistical analysis
Continuous variables are presented as mean ± standard deviation. Categorical variables are presented as count (percentage). Differences between groups were tested by Student’s t test for continuous variables and the chi-square test for categorical variables. Multiple logistic regression analysis was used to determine the risk of metabolic syndrome in each of the six groups. First, we used the base model for the BMI and VFA at baseline. Model 1 was adjusted for age and sex, while Model 2 was adjusted for age, sex, diabetes mellitus, hypertension, alcohol intake, and smoking. The associations are presented as odds ratios (ORs) with 95% confidence intervals (CIs). All statistical analyses were performed with SAS 9.4 (SAS Institute, Cary, NC, USA). A p value below 0.05 was considered statistically significant.
RESULT
Baseline characteristics of study population
The demographic and clinical characteristics of the participants are shown in Table 1. The mean age was 47.6 years for women and 47.9 years for men. The mean VFA was 82.2 cm2 in women and 106.5 cm2 in men. The prevalence of metabolic syndrome in women and men was 19.6% and 29.7% respectively. The mean BMI, blood pressure, uric acid, total cholesterol, LDL-C, triglycerides, fasting blood glucose, GGT, AST, and ALT levels were significantly higher in men than in women. The mean HDL-C level was significantly higher in women than in men. Table 2 displays the correlations between VFA and various other parameters. The VFA correlated positively with BMI, blood pressure, uric acid, total cholesterol, LDL-C, triglycerides, fasting blood glucose, GGT, AST, and ALT levels, but negatively with HDL-C level.

Clinical characteristics of the study population stratified by gender

Correlation between VFA and other variables
Main characteristics of the groups defined by BMI and VFA
We divided participants into six groups according to the combination of BMI and VFA. The clinical characteristics of participants by gender according to BMI and VFA are shown in Tables 3 and 4. In men, the prevalence of metabolic syndrome was 6.1% in Group 1, 13.3% in Group 2, 13.1% in Group 3, 21.5% in Group 4, 25.4% in Group 5, and 56.2% in Group 6. In women, the prevalence of metabolic syndrome was 4.3% in Group 1, 21.6% in Group 2, 12.1% in Group 3, 30.9% in Group 4, 33.9% in Group 5 and 62.2% in Group 6. The subgroups of participants with VFA ≥ 100 cm2 were generally older and had greater BMI and waist circumference than those with VFA < 100 cm2. In addition, VFA ≥ 100 cm2 was associated with the presence of hypertension, diabetes mellitus, metabolic syndrome, and metabolic parameters.

Clinical characteristics of male according to BMI and VFA

Clinical characteristics of female according to BMI and VFA
Presence of metabolic syndrome in groups defined by BMI and VFA
In variable-adjusted models, we estimated the risk of metabolic syndrome in each group defined by BMI and VFA (Table 5). In Model 1, the odds ratios for metabolic syndrome compared with Group 1 were 2.91 (95% CI, 2.31 to 3.67), 2.64 (95% CI, 2.29 to 3.04), 5.27 (95% CI, 4.55 to 6.11), 7.62 (95% CI, 6.63 to 8.75), and 25.44 (95% CI, 22.60 to 28.63) in Groups 2, 3, 4, 5, and 6, respectively. In Model 2, the respective odds ratios for metabolic syndrome compared with Group 1 were 2.92 (95% CI, 2.30 to 3.69), 2.57 (95% CI, 2.23 to 2.97), 5.16 (95% CI, 4.44 to 6.00), 7.45 (95% CI, 6.47 to 8.56), and 24.53 (95% CI, 21.77 to 27.64) in Groups 2, 3, 4, 5, and 6.

The odds ratio of metabolic syndrome in the group stratified by the combination of body mass index and visceral fat area
DISCUSSION
The following results were obtained through this study. First, VFA estimated by BIA correlated well with waist circumference and metabolic syndrome components. Although previous studies have shown similar results regarding VFA [11,12,16,17], our study demonstrated the usefulness of VFA estimation by BIA in a large number of participants. Visceral fat is known to be associated with insulin resistance and diabetes [18]. Our study revealed that VFA was also associated with HbA1c level. Additionally, we found that VFA was associated with the level of uric acid. Uric acid is not included in the diagnostic criteria for metabolic syndrome, but recent studies have revealed that increased uric acid level plays a causative role in the pathogenesis of metabolic, renal, and cardiovascular diseases and leads to increased mortality [19-21].
Second, when participants were divided into six groups, the odds ratio for metabolic syndrome tended to increase with group number, and the odds ratio for metabolic syndrome in Group 6 was very high at 24.53. Interestingly, when the normal-weight group was divided based on VFA, the odds ratio for metabolic syndrome in Group 2 (normal weight and VFA ≥ 100 cm2) was 2.92 compared with Group 1 (normal weight and VFA < 100 cm2). Additionally, the odds ratio for metabolic syndrome in Group 2 was higher than that in Group 3 (overweight and VFA < 100 cm2). The odds ratio for metabolic syndrome increased dramatically from 7.45 to 24.53 when participants with obesity based on BMI were further divided based on VFA (Group 5 vs. Group 6). These results suggest that VFA is an important component and cause of metabolic syndrome. Previous studies have demonstrated that VFA is associated with metabolic syndrome components and have proposed 100 cm2 as a reasonable cut-off point for VFA, suggesting that VFA < 100 cm2 may be an important factor for improvement [15,22]. Visceral fat is associated with a greater cardiometabolic risk than subcutaneous fat or high BMI [23,24]. The adipocytokines induced by visceral fat are closely related with metabolic disorders [25], which develop into various metabolic and cardiovascular diseases. Visceral fat reduces the production of defensive adipocytokines such as adiponectin [25,26]. Changes in adiponectin in obesity play an important role in the development of metabolic and cardiovascular complications [25,27]. Circulating adiponectin level was found to correlate with VFA but not BMI in subjects with obesity [28].
The clinical significance of our study is as follows. The combination of BMI assessment and VFA determination by the BIA method allowed the diagnosis of individuals with an unrecognized but relatively high risk of metabolic syndrome (such as those with normal BMI and VFA greater than 100 cm2). In addition, our study confirmed that the risk of metabolic syndrome was significantly lower (OR, 7.45 vs. 24.53) when VFA was less than 100 cm2 in participants with obesity based on BMI. In other words, VFA (cut-off point of 100 cm2) may be a useful target for interventions to improve metabolic syndrome.
The present study had several limitations. First, our study was limited by its cross-sectional and single-center retrospective design. Second, exercise as a habitual parameter was not evaluated in the present study because the data was not correctly acquired. However, the influence of this limitation was reduced by the large sample size in our study. Third, VFA was not measured by a standard method such as CT, which is the most accurate and reliable method. However, VFA determined by BIA correlates well with that determined by CT [17,29].
In conclusion, this study demonstrated that the combination of BMI assessment and VFA determination by BIA may be a simple and useful method for predicting the risk of metabolic syndrome. The VFA by BIA may be a useful target for interventions to improve metabolic syndrome. Future interventional trials are needed to confirm the usefulness of targeting the VFA to improve metabolic syndrome.
KEY MESSAGE
1. Visceral fat area estimated by bioelectrical impedance analysis correlated well with waist circumference and metabolic syndrome components.
2. The combination of body mass index assessment and visceral fat area determination by the bioelectrical impedance analysis method allowed the diagnosis of individuals with an unrecognized but relatively high risk of metabolic syndrome.
3. Visceral fat area (cut-off point of 100 cm2) by bioelectrical impedance analysis may be a useful target for interventions to improve metabolic syndrome.
Notes
No potential conflict of interest relevant to this article was reported.
Acknowledgements
This study was supported by a grant from the National Health Insurance Service Ilsan Hospital, Republic of Korea. The authors acknowledge the effort of the health screening group at the National Health Insurance Service Ilsan Hospital, Republic of Korea.