Food intake and its effect on the species and abundance of intestinal flora in colorectal cancer and healthy individuals
Article information

Abstract
Background/Aim
It is known that an imbalance in the intestinal f lora plays a crucial role in colorectal cancer (CRC), but the effect of food consumption patterns on the types of intestinal flora remains to be clarified. We aimed to analyze the associations between food intake and intestinal flora in healthy and CRC individuals.
Methods
Food intake data were recorded using the Food Frequency Questionnaire (FFQ). The composition and diversity of the intestinal flora detected by 16S rRNA gene sequencing, and the data were analyzed by R version 3.1.1 software.
Results
Higher intake of red meat or pickled foods, and lower intake of white meat, fruits, vegetables, beans, nuts were found in the CRC group compared with the healthy group. Higher levels of Fusobacteria and Proteobacteria, and lower levels of Firmicutes were observed in the CRC group. Partial correlation analysis revealed that the intake of fruits, beans, and nuts was negatively correlated with Proteobacteria and Fusobacteria, but pickled food was positively correlated with Fusobacteria (p < 0.05). Fish, beans, and nuts intake was negatively correlated with Escherichia (p = 0.01). Multiple regression analysis revealed that vegetable oil (odds ratio [OR], 0.26; 95% confidence interval [CI], 0.13 to 0.82), vegetables (OR, 0.26; 95% CI, 0.10 to 0.64), eggs (OR, 0.26; 95% CI, 0.10 to 0.69), pickled foods (OR, 21.02; 95% CI, 6.02 to 73.45), and red meat (OR, 4.23; 95% CI, 1.68 to 10.60) had an impact on CRC risk.
Conclusions
The species and abundance of intestinal flora varies between CRC and healthy individuals and may be affected by their food preference.
INTRODUCTION
Colorectal cancer (CRC) is the second most commonly diagnosed cancer in females and the third in males worldwide [1]. Approximately 25% of individuals diagnosed with CRC have a family history of the disease, but 75% of CRC cases are not hereditary, indicating that genetics and environmental factors contribute to the pathogenesis of CRC [2]. Accumulating evidence suggests that the gut microbiota and its metabolites may be the proximate environmental factors for CRC. The initiation and progression of CRC occurs in an altered intestinal environment that includes changes in the gut microbiota [3]. The intimate crosstalk between the gut microbial community and the host’s epithelium layer is a crucial factor for cell proliferation and differentiation, gene expression in host epithelial cells, and the regulation of inflammation, which is a significant driver of rectal carcinogenesis [4].
The human gut hosts roughly a thousand different bacterial species. Gut microbial diversity is affected by host genotype [5] and a range of environmental factors [6]. Among all environmental factors, dietary parameters play a critical role in shaping the gut microbiota [7]. The diet has an essential impact on the composition and function of the gut microbiota, which is more relevant to environmental factors rather than genetic background [8]. Numerous epidemiologic studies have identified that specific dietary patterns can either promote the development of CRC or offer protection from it. The two most studied diets are the Western diet and the Mediterranean diet (MD). The Western diet, characterized by high red meat, high fat, and low fiber content, is thought to be a significant contributor to CRC incidence, while the MD, consisting of high fiber foods, i.e., fruits, vegetables, and whole grains, has been shown to be protective against CRC [9]. However, the effect of food intake on the species of intestinal bacteria is unclear, and inconsistent results also exist [10]. The inner mechanisms of diet that induce CRC may be complicated, and require elucidation.
Dietary compounds are a source of energy and metabolites for gut bacteria [7]. Cereals contain resistant starch and non-starch polysaccharides such as β-glucan and arabinoxylans, which resist digestion in the upper gastrointestinal tract, making them an essential fuel for the microbiota of the gut [11]. Consumption of whole cereal grains (WCGs) has been linked to improvements in metabolic syndrome (Mets) by altering the composition and function of the gut microbiota in humans and other mammals [11]. An animal study revealed that commercial oat bran or hulled barley-derived β-glucan significantly increased Lactobacillus and Bifidobacterium populations and decreased the number of Enterobacteriaceae in a dose-dependent manner in male rats [12]. In rats, switching from a low-fat diet to a high-fat diet altered the microbiota composition with an increase in Firmicutes and decrease in Bacteriodetes [13].
In humans, evidence for the direct effect of fat on the gut microbiota is still lacking due to the constant mixing of meat and fat with fiber in the human diet [10]. Compared to a single type of food, i.e., meat or vegetable, the dietary structure may play a more significant role in the composition of the gut flora. The analysis of the effect of a particular food on the bacterial flora based on the dietary pattern may provide insight on the relationship between diet and CRC carcinogenesis. Unfortunately, most studies examining nutrition and gut flora focus on a single food for a short amount of time, such as administering a diet consisting solely of animal foods and then observing the immediate changes in the gut microbiota [14]. The long-term dietary intake may alter the microbial community structure and overwhelm inter-individual differences in microbial gene expression, which may subsequently play a significant role in CRC carcinogenesis compared with short-term dietary habits [14]. Quantitative analysis of the role of long-term diet in CRC is complicated, either in perspective or in a retrospective study. Given that the intestinal flora can potentially contribute to the development of diseases in genetically at-risk individuals, the intestinal flora could be a promising tool to study the relationship between diet and CRC. Understanding the role of long-term dietary patterns in the intestinal flora will help further our comprehension of the influence of food on the intestinal environment [15].
To elucidate the effects of food intake on the intestinal flora based on the southern Chinese dietary pattern, we recruited healthy individuals and patients with CRC. The long-term nutritional habits were derived from a fFood Frequency Questionnaire (FFQ), and the association between food intake and the species and abundance of intestinal flora was assessed.
METHODS
Patients
This study, including participant recruitment, questionnaire information collection, and all experimental protocols, was approved by the Shantou Universi ty Medical College Institutional Review Board (approval number: 2017-19). Patients provided written informed consent for the collection of samples and subsequent analysis. From January to December 2017, 100 newly diagnosed CRC patients were enrolled in our study, while 100 healthy individuals were recruited as normal controls. The dietary patterns were collected using the FFQ from 100 CRC patients and 100 healthy subjects. Among them, 27 CRC patients and 25 healthy subjects agreed to provide feces for gut microbial composition analysis.
To clarify whether microflora diversity was affected by the different dietary patterns, healthy people and CRC patients were separated into two groups, in which subgroups were further divided according to the food intake (more or less) over the 12 months. The species and abundance of microflora were compared in these subgroups. Fecal samples collected before the start of the bowel preparatioand were stored at −80°C. All patients and healthy individuals were of Han Chinese origin and were living in Guangdong Province in southeast China. Individuals with a history of polyps, adenomas, or other diseases related to cancer were excluded.
Cancer was staged according to the tumor-node-metastasis (TNM) classification. Clinical data extracted from medical records, and information including Duke’s stage, chemotherapy, histological and pathological types, and serum levels of carcinoembryonic antigen (CEA) and carbohydrate antigen 19-9 (CA19-9) before surgery recorded from medical records. All healthy subjects were included as controls if they had no functional digestive disorders, and had not used antibiotics, probiotics, or prebiotics prior to enrollment in the study.
Dietary pattern data collection
An informational questionnaire was structured to collect demographic characteristics (age, gender, height, weight, and body mass index [BMI]), educational and income levels, occupation, marital status, race, and history of smoking and alcohol consumption. The usual dietary intake during the previous year was assessed using a 66-item semi-quantitative FFQ) that contained food items. The questionnaire was completed to estimate the subject’s natural food and beverage intake over the past year. The FFQ was chosen because it is a complete tool to estimate intakes over an extended time [16]. The questionnaire has five possible responses ranging from “never or less than once per month” to “more than seven times per week.”
Participants were asked to recall their frequency (daily, weekly, monthly, never) of consumption of each food item and the estimated portion size, using a standard unit of 50 g or natural units, e.g., bottles. The food items were categorized a priori into 13 food groups (e.g., fruits, vegetables, grains, red meat, white meat [except fish], beans and nuts, and fish). Each response was converted to the corresponding frequency factor. For each subject, a record was made of the disease history and dietary status during the past year before the cancer diagnosis.
DNA extraction from feces and 16S rRNA amplicon sequencing
Bacterial genomic DNA was extracted from fecal samples using the AllPrep DNA/RNA kit (Qiagen, Valencia, CA, USA). Qualified DNA was used to construct a library (or libraries), and only qualified libraries were used for sequencing. Paired-end sequencing reads were obtained as demultiplexed libraries per sample. The following primers were used: 16S amplicon polymerase chain reaction (PCR) forward primer (V3 region 341F): ACTCCTACGGGAGGCAGCAG; 16S amplicon PCR reverse primer (V4 region 806R): GGACTACHVGGGTWTCTAAT; (V4 region 515F): GTGCCAGCMGCCGCGGTAA; (V4 region 80the 6R): GGACTACHVGGGTWTCTAAT.
Statistical analysis
The bacterial species were analyzed based on operational taxonomic units (OTUs) and taxonomic ranks. Within the dataset, we identified a total of 1,214 OTUs based on 97% sequence similarity (equal to bacterial species level). The indices were calculated by Mothur (v1.31.2), and the corresponding rarefaction curve was drawn by R software version 3.1.1 (R Foundation for Statistical Computing, Vienna, Austria). The obtained data were used to perform bioinformatic analyses. Fecal microflora diversity was assessed in CRC patients and healthy individuals.
Categorical and continuous variables were examined by the chi-square test and two-sample t test. Age and BMI were calculated as adjusted factors in the following analyses. In the multivariate analysis, significant variables from the univariate analysis were selected and manually entered into the model step by step. The combined and interactive effects between dietary factors and gut microflora were estimated by binary logistic regression. Correlations between specific food groups and bacterial abundance were assessed using the Spearman correlation coefficient [7]. The data are expressed as the median ± interquartile range. The level of significance was set at p ≤ 0.05, and p ≤ 0.10 was considered a trend. The data were analyzed using SPSS version 20.0 software (IBM Co., Armonk, NY, USA), and all p values represent two-sided statistical tests.
RESULTS
General characteristics in CRC patients and healthy individuals
From January to December 2017, 100 newly diagnosed CRC patients were enrolled in our study, with 54 males and 46 females, and their average age was 60.33 ± 13.4 years. There were 100 healthy individuals (52 males and 48 females) that were recruited as normal controls in this study, and their average age was 59.60 ± 12.9 years. There was no significant difference between the CRC group and the control group in terms of age, sex, education level, and occupation. The BMI index in the CRC group (23.10 ± 3.46 kg/m2) was insignificantly higher than that in the control group (22.58 ± 3.02 kg/m2) (p = 0.26). For the history of previous digestive tract diseases, the prevalence of gastrointestinal ulcer and appendicitis in the CRC group was significantly higher than that in the control group (p < 0.05 for both); there was no significant difference in the incidence of cholecystitis (p > 0.05) between the two groups.
There was no statistical difference in alcohol consumption history and frequency (p > 0.05) between the CRC group and the healthy group. In the CRC group, the number of patients who smoked more than one pack (20 cigarettes) per day was significantly higher than that in the control group (p < 0.01). There was a significant difference in the amount of exercise between the CRC group and the control group (p < 0.01). Tumor markers (CEA and CA199), inflammatory parameters including neutrophil to lymphocyte ratio (NLR), platelet to lymphocyte ratio (PLR), and lymphocyte to monocyte ratio (LMR), as well as liver function indices (ALT, AST), were significantly higher in the CRC group as compared to the controls (p < 0.001 for all). Hemoglobin was significantly lower in the CRC group as compared to the controls (p < 0.001). There was no significant difference in the other biochemical and hematologic parameters between the two groups. The patient characteristics of CRC patients and healthy individuals are shown in Table 1.
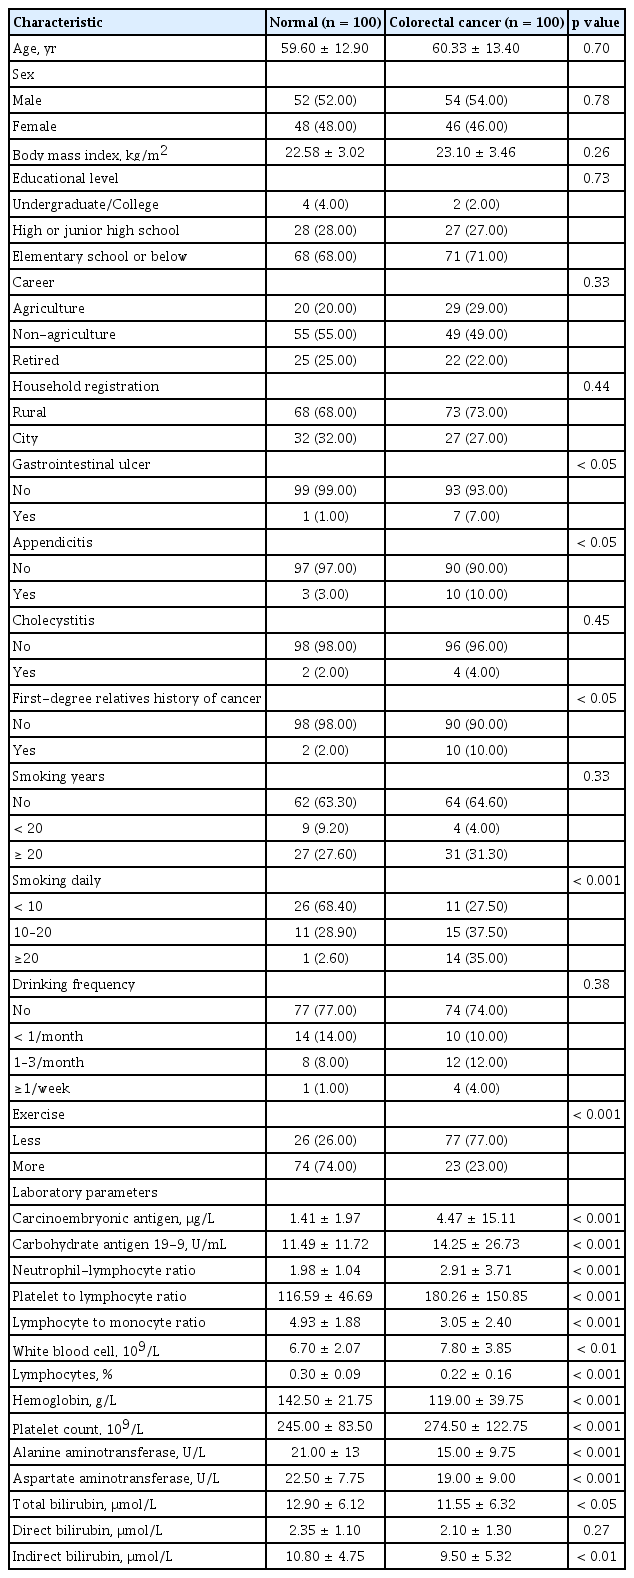
Comparison of general characteristics between 100 patients with colorectal cancer and 100 healthy population
Food intake in CRC patients and healthy individuals
The dietary patterns derived from the FFQ were analyzed, and it was determined that there was no statistical difference in daily meal times and regularity between the CRC and control group (p > 0.05), but there was a significant difference in terms of having night snack habits (p < 0.01), and the proportion of people with the habits of late-night eating was significantly higher in the CRC group compared with the healthy controls. The amount of drinking water for the CRC group was significantly lower than that of the healthy group (p < 0.01).
The results revealed that the frequency and amount of red meat or pickled food intake in the CRC group were significantly higher than those in the controls (p < 0.01), while the healthy group had a higher frequency and amount of fish, shrimp, or other seafood intake compared with the CRC group (p < 0.01). The intake frequencies of pulses and soy products (p < 0.05), fruits (p < 0.01), vegetables (p > 0.05), coarse grains (p < 0.01), and dairy products (p < 0.01) were lower in the CRC group compared with the healthy group. The frequency of the daily consumption of cooking oil between the CRC group and the control group was statistically different (p < 0.01). Additionally, the CRC individuals preferred to use lard for cooking, while the healthy control group preferred to use vegetable oil (Table 2).
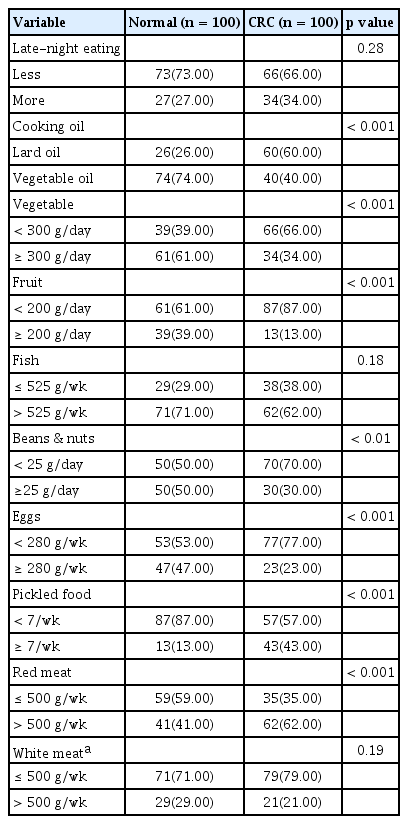
Comparison of different dietary habits between CRC and healthy group
Comparison of the species and abundance of intestinal flora in CRC and healthy individuals
Microflora diversity was assessed in CRC patients and healthy individuals. Our results showed that the intestinal flora differed between CRC patients and healthy controls at either the phylum, family, or genus level, with changes in the abundances of commensal and pathogenic bacterial taxa. CRC patient-matched microbiomes showed an enrichment of Proteobacteria and a depletion of Firmicutes. The relative abundance of Fusobacteria and Proteobacteria in the CRC group was significantly higher than that of the normal controls, while the Firmicutes in the CRC group was significantly lower than that of normal controls. Next, the top fifteen bacterial genera were analyzed. Bifidobacterium, Clostridium, Blautia, Lachnospira, Roseburia, Faecalibacterium, and Ruminococcus were found to be significantly higher in the normal group than in CRC patients, while Escherichia, Parabacteroides, Fusobacterium, and Veillonella presented in significantly higher proportions in CRC patients than in control subjects. To conclude, there was a significant difference in the microflora between CRC patients and healthy individuals in our study. Differences in the bacterial flora between the two groups are summarized in Fig. 1.
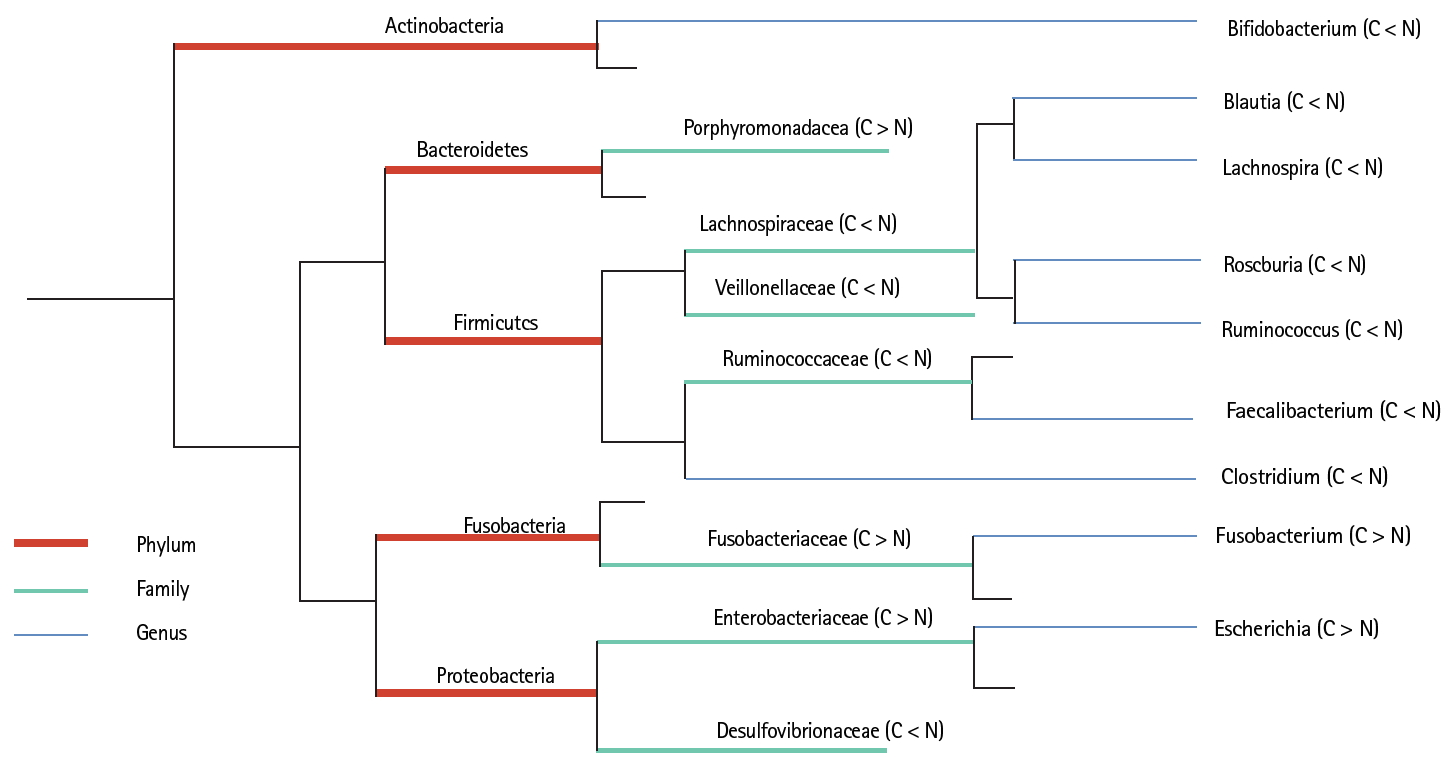
Comparison of gut microflora structure in colorectal cancer (CRC) and healthy individuals. C stands for colorectal cancer group, and normal (N) stands for the healthy control group. At the level of phylum, family, and genus, the species with significant differences in the relative abundance of the two groups were analyzed and compared (p < 0.05). Among them, orange represents the level of the phylum; green represents the level of the Family; blue represents the genus level.
Comparison of intestinal flora according to the amount of food intake
To clarify whether the microflora diversity was affected by the different dietary patterns, healthy people and CRC patients were separated into two groups, in which sub-groups were further divided according to the food intake (more or less) over the 12-month period. The species and abundance of microflora were compared in these sub-groups. At phylum levels, the abundance of Firmicutes was higher in the normal group than that in the CRC group. On the contrary, Proteobacteria was higher in CRC patients as compared to the normal group, but there was no significant difference in each food sub-group. Fusobacteria increased only in the CRC group, especially in sub-groups that consumed higher quantities of pickled food and red meat. CRC patients with decreased intake of eggs, fruits, fish, and beans and nuts had higher levels of Fusobacteria. Euryarchaeota was only observed in the CRC group. A boxplot was used to visually display the differences in the diversity among subgroups (Fig. 2A).
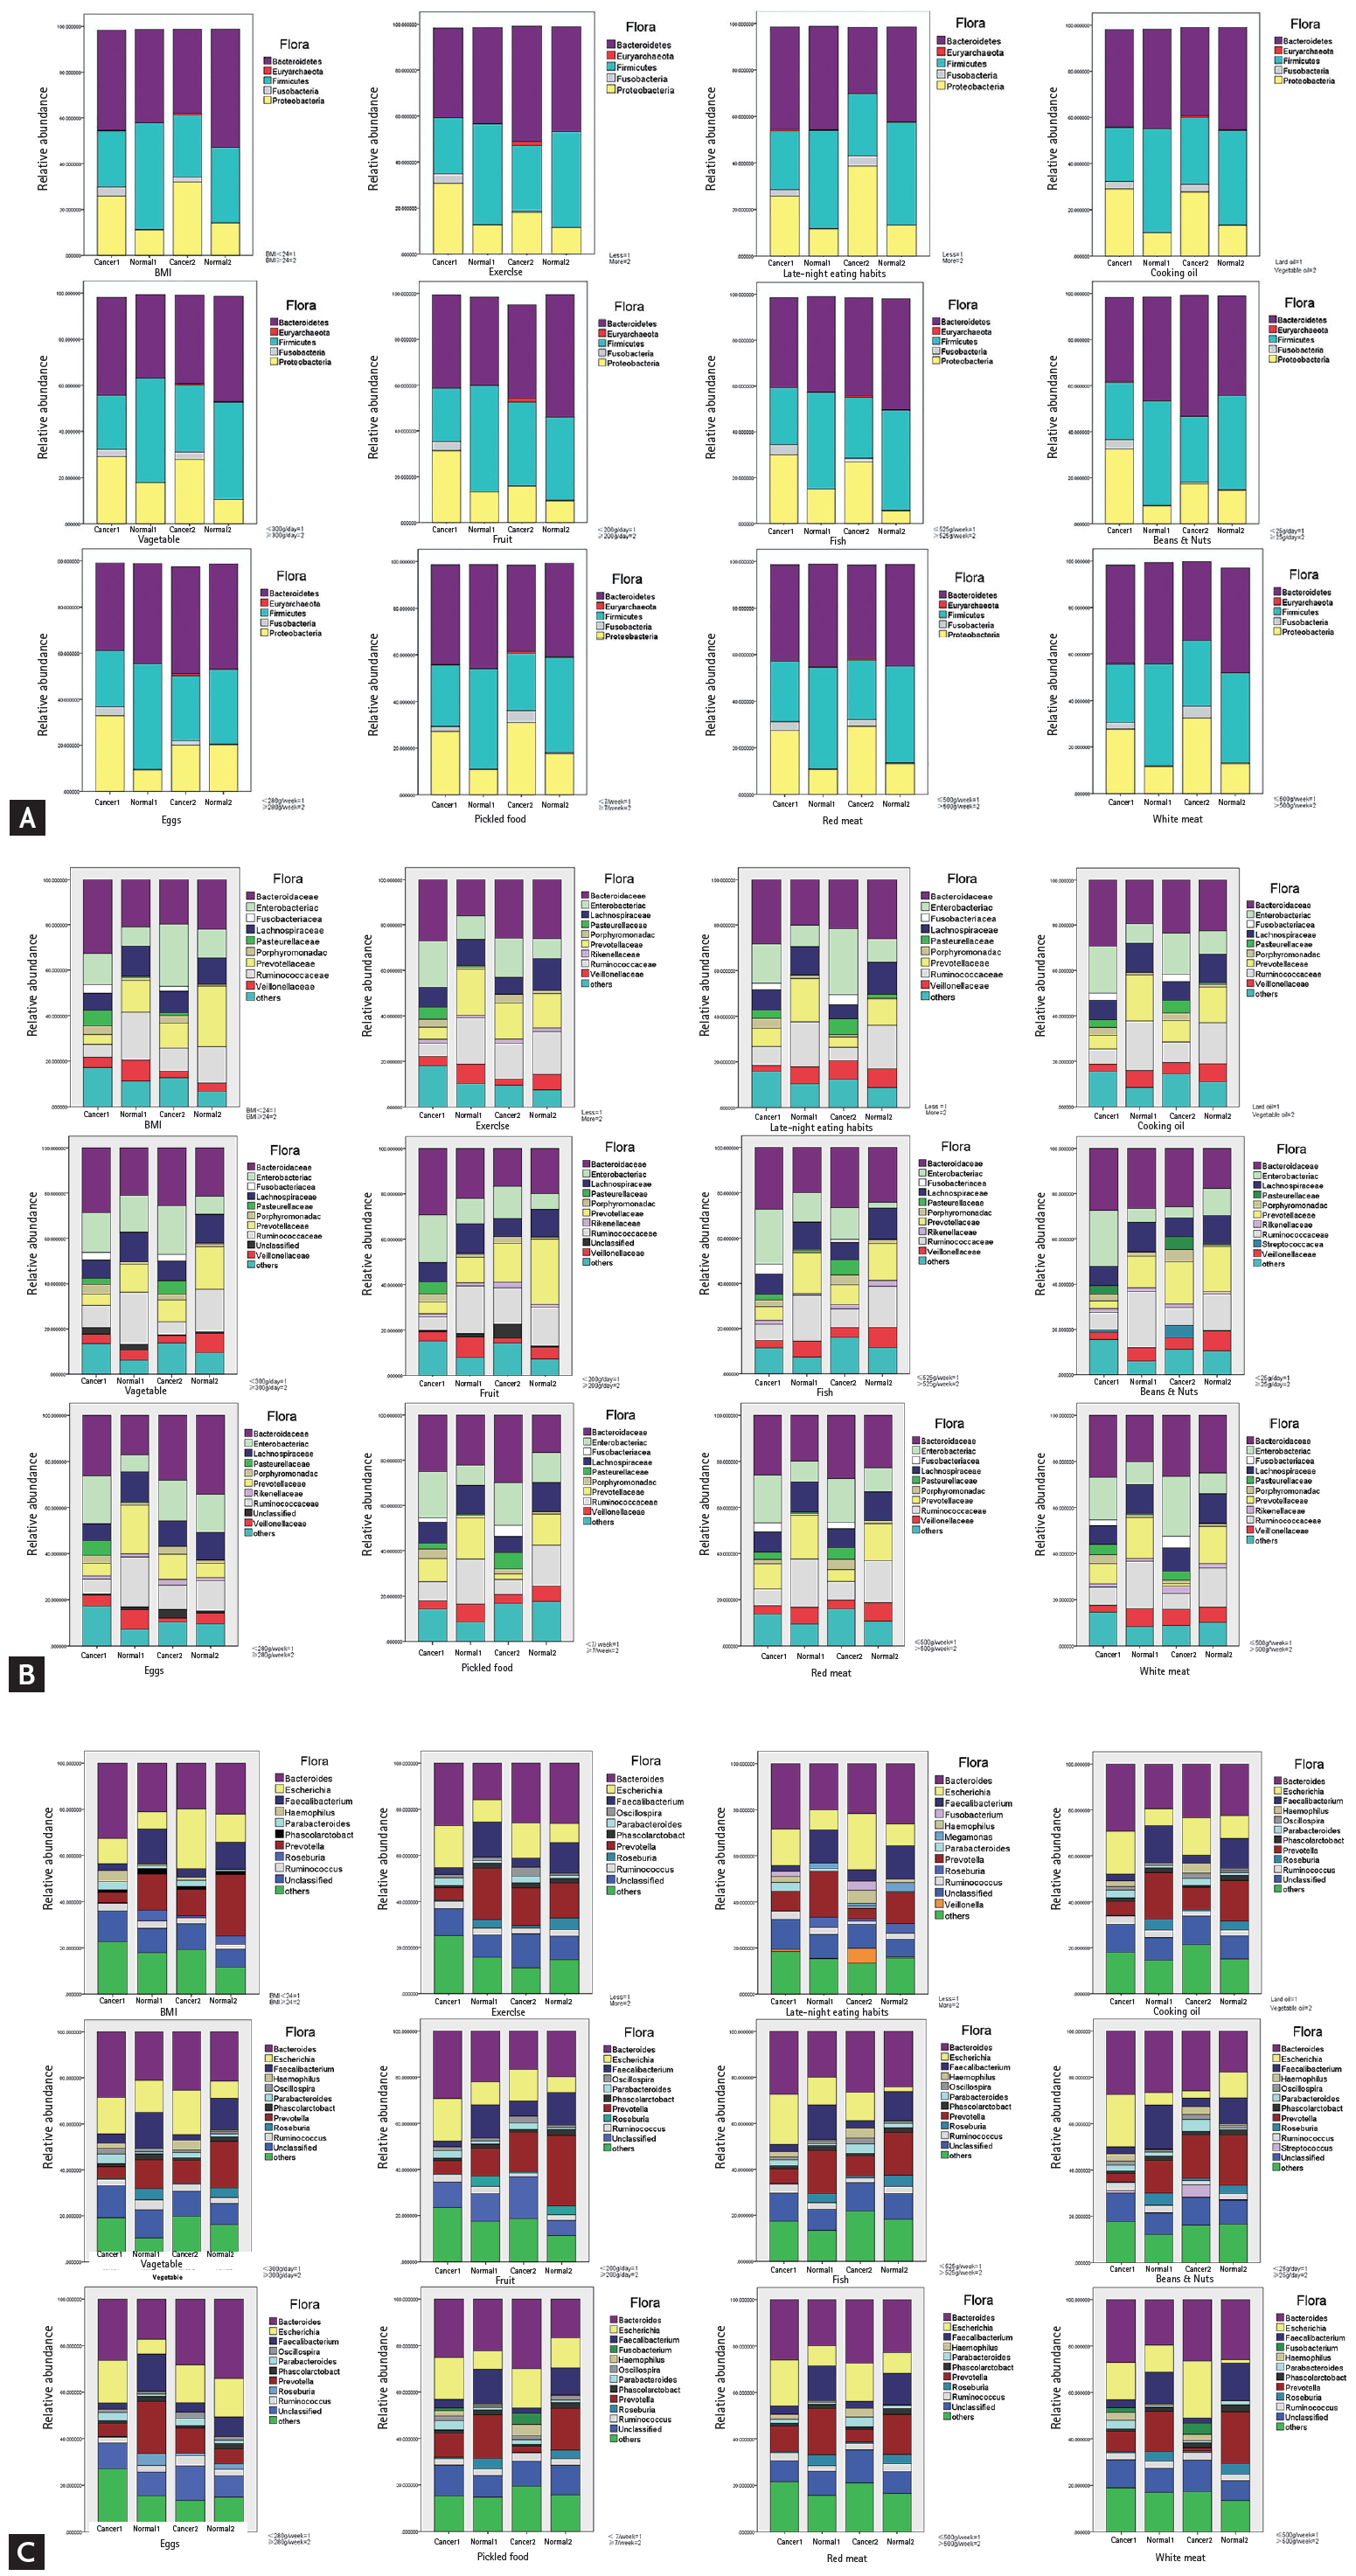
In the (A) phylum, (B) family, (C) genus level, a comparison of microflora in colorectal cancer (CRC) and the healthy group separated by the amount of food intake, body mass index (BMI) index, living habits, etc. According to the 12 indicators of food intake/frequency, BMI, and living habits, the colon cancer patient group and the healthy group were divided into cancer 1, cancer 2, normal 1 and normal 2 according to the classification of each index. The effects of different gradings of 12 indicators on the intestinal fascia of four groups were analyzed and compared. Refer to the Chinese standard BMI index ≥ 24 to indicate overweight.
At the family levels, Enterobacteriaceae, Fusobacteriaceae, Pasteurellaceae, and Porphyromonadaceae were significantly higher in the CRC group than in the normal group (p < 0.05). In the CRC group, patients with greater consumption of red meat or less beans, fruits, and fish tended to harbor more Enterobacteriaceae. An abundance of Fusobacteriaceae was observed in the groups that consumed more red meat and pickled food, or less fish. Individuals that ate less eggs and fruits, or more fish, beans, and pickled food tended to have more Pasteurellaceae in the cancer groups. In contrast, Lachnospiraceae, Ruminococcaceae, and Veillonellaceae were significantly higher in the normal group than those in the CRC group. Food intake had little effect on the abundance of Lachnospiraceae. An abundance of Prevotellaceae was observed in normal individuals that consumed more vegetables, fruits, beans, and nuts, but in the CRC group, patients that consumed more pickled food and red meat had quite lower amounts of Prevotellaceae (Fig. 2B). We further analyzed the flora at the genus level. A largely reduced abundance of Escherichia was found in CRC and healthy individuals with more fish intake. However, red meat or pickled foods had little effect on Escherichia. Vegetables, beans, nuts, and pickled food play a more important role than other foods in the abundance of Prevotella (Fig. 2C).
To further test the above conclusion, a partial correlation was used to analyze the intimate relationship between food and microflora in CRC and healthy individuals. The individual variables in the equation were tested separately. In the entire group, red meat (R = 0.61, p = 0.02) was positively correlated with Enterobacteriaceae, while fruit intake (R = –0.64, p = 0.01) was negatively associated with Enterobacteriaceae. White meat was positively correlated with Bacteroidaceae (R = 0.55, p = 0.04) and Pasteurellaceae (R = 0.57, p = 0.03), and eggs (R = 0.71, p < 0.01) were positively correlated with Porphyromonadaceae and negatively correlated with Prevotellaceae (R = –0.56, p = 0.04). Beans and nuts (R = –0.53, p = 0.05) were negatively correlated with Ruminococcaceae. In the CRC group, beans and nuts (R = –0.56, p = 0.03) were negatively correlated with Enterobacteriaceae, and were positively correlated with Prevotellaceae (R = 0.55, p = 0.03). At the genus level, late-night eating (R = –0.58, p = 0.03), fruit (R = –0.63, p = 0.02), and red meat (R = 0.69, p = 0.01) were moderately correlated with Escherichia. Roseburia was negatively correlated with red meat (R = –0.53, p = 0.05) intake. Other parameters, including white meat intake, were positively associated with Bacteroides (R = 0.55, p = 0.04) and Haemophilus (R = 0.54, p = 0.04). Similarly, egg intake was positively associated with Bacteroides (R = 0.64, p = 0.01) and Parabacteroides (R = 0.71, p < 0.01), while eggs were negatively associated with Provetella (R = –0.56, p = 0.04). There was also a negative correlation between lard and Ruminococcus (R = –0.56, p = 0.04) (Tables 3 and 4).
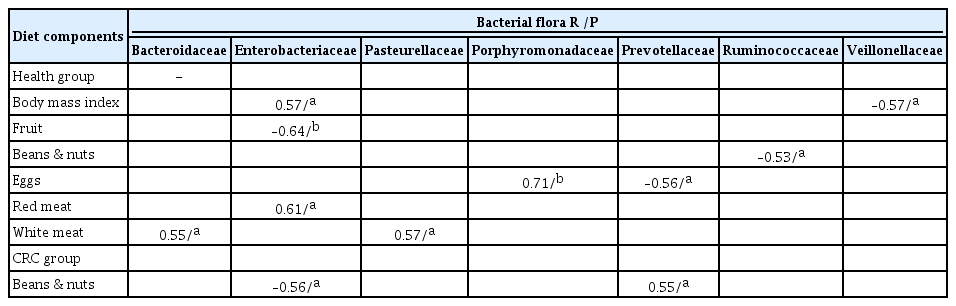
The associations between bacterial flora and diet components at the family level
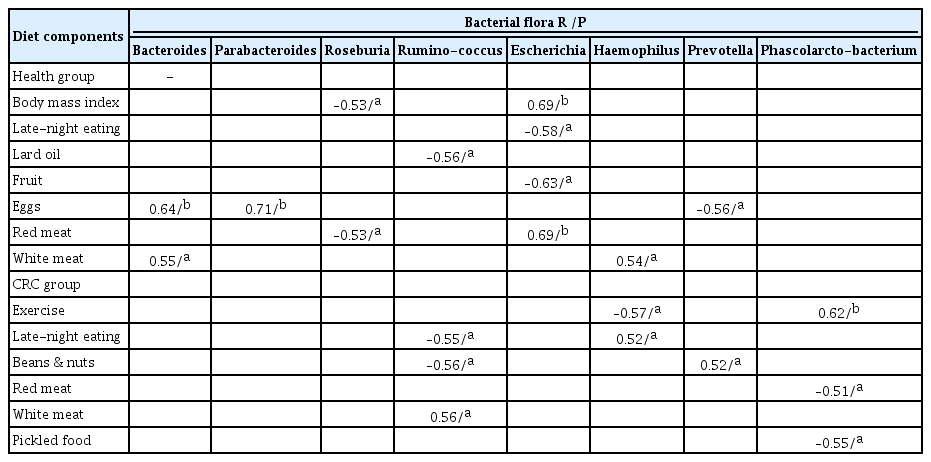
The associations between bacterial flora and diet components at the genus level
Prevotella/Bacteroidetes ratio in each food sub-group
The Prevotella/Bacteroidetes ratio of the healthy group was significantly higher than that of the CRC group. Although increased intake of fruits and beans induced a higher Prevotella/Bacteroidetes ratio, the effect was not significant in the CRC group. However, a greater bean and nut intake increased the Prevotella/Bacteroidetes ratio in both the healthy and CRC groups (p < 0.01). Our results indicated that some dietary factors might have the same tendency to affect the intestinal flora of healthy people and CRC patients, but the efficacy is more evident in healthy people (Fig. 3).
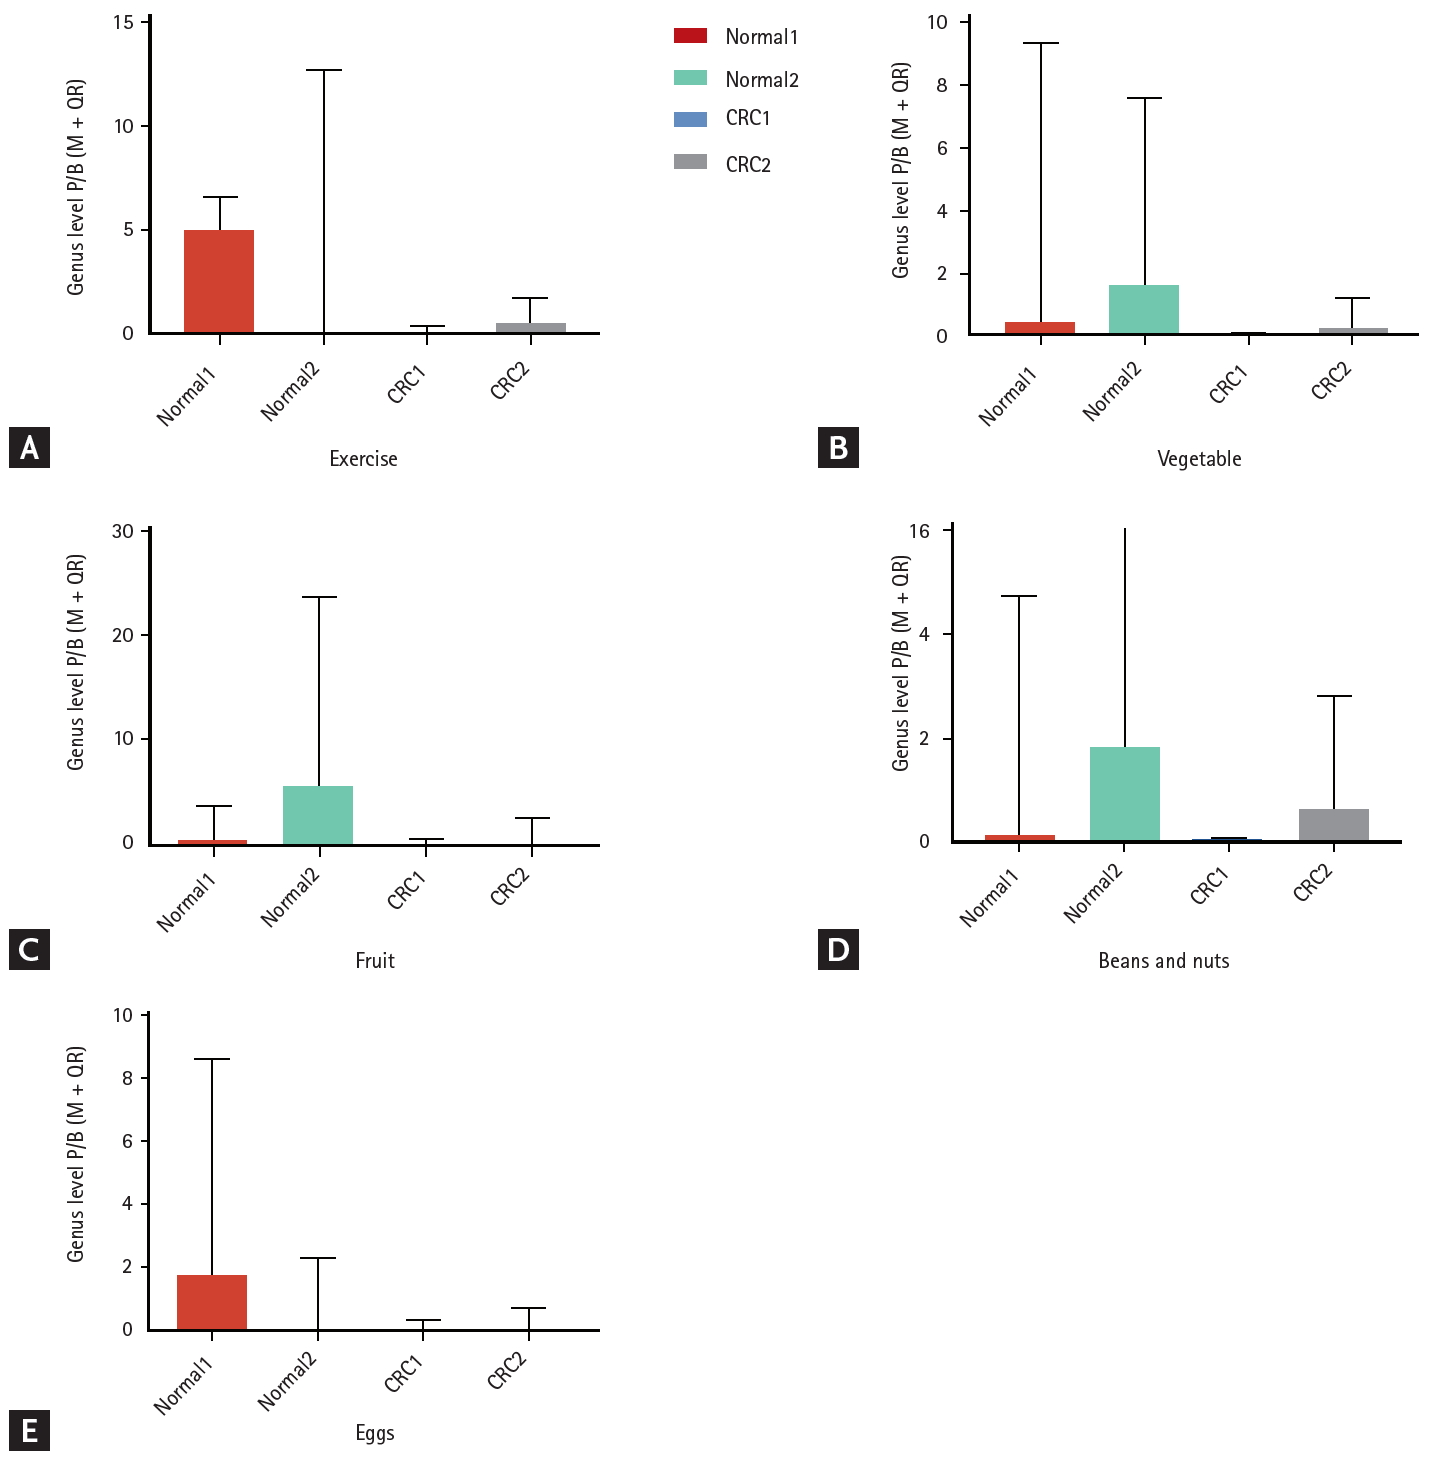
The ratio of Prevotella/Bacteroidetes (P/B) in subgroups. (A) Effect of exercise frequency on P/B ratio between healthy control populations and colorectal cancer patients. (B) Effect of vegetable intake on P/B ratio between healthy control populations and colorectal cancer patients. (C) Effect of fruit intake on P/B ratio between healthy control populations and colorectal cancer patients. (D) Effect of intake of beans & nuts on P/B ratio between healthy control populations and colorectal cancer patients. (E) Effect of egg intake on P/B ratio between healthy control populations and colorectal cancer patients. Colon cancer patients, and healthy control populations were divided into cancer1, cancer 2, normal1, and normal2, according to the classification of each index. CRC, colorectal cancer; M±QR, median±interquartile range.
Risk factors for CRC carcinogenesis
We further evaluated which factors are more significant in the pathogenesis of CRC with a multivariate regression analysis model. After adjusting for confounding factors, the results showed that vegetable oil (odds ratio [OR], 0.33; 95% confidence interval [CI], 0.13 to 0.82), vegetables (OR, 0.26; 95% CI, 0.10 to 0.64), eggs (OR, 0.26; 95% CI, 0.10 to 0.69), pickled food (OR, 21.02; 95% CI, 6.02 to 73.45), and red meat (OR, 4.23; 95% CI, 1.68 to 10.60) had an impact on CRC risk. Among them, excessive intake of pickled food and red meat were risk factors, while regular consumption of vegetable oil, and eating more vegetables and eggs were protective factors (Table 5).

Odds ratios and 95% confidence intervals for colorectal cancer by dietary habits
DISCUSSION
Dietary patterns play important roles in CRC carcinogenesis. In this study, all participants were Chinese who lived in a southern coastal area where the staple foods consisted of rice and vegetables, with a small amount of meat (either red meat, fish, or seafood). Rice and vegetables occupied two-thirds of the total diet. Vegetables and meat were cooked mainly by frying and steaming, with vegetable oil or animal fat (mainly lard). Although the eating habits are similar to those of the Mediterranean diet, there has recently been a significant increase in the incidence of CRC in this area.
Although the eating habits of the inhabitants are generally similar under the entire demographic background in this study, we still found that there was a significant difference in food preferences between CRC patients and healthy people. In this study, individuals with CRC were inclined to consume higher amounts of red meat and pickled foods, and lower amounts of fish, shrimp, and other seafood. Significantly lower consumption of pulses and soy products, fruits, vegetables, coarse grains, and dairy products was also found in CRC patients. A more hostile gut environment can occur as a result of higher consumption of red meat or processed meat. The gut microbiota metabolizes proteins from red meat to nitrosamine and heterocyclic amines, and these metabolites are risk factors for CRC development [17]. Therefore, higher red meat consumption is a well-recognized factor that is associated with a higher CRC risk [18], although it does not seem to apply to all people [10]. However, our data showed that pickled foods play a more important role in CRC pathogenesis rather than red meat.
The impact of diet on intestinal flora has been extensively studied, indicating that diet could re-shape the community structure of the gut microbiota [10,14]. An animal-based diet was observed to increase the abundance of bile-tolerant microorganisms (Alistipes, Bilophila, and Bacteroides) and decrease the levels of Firmicutes [14]. Specifically, high-fat consumption may increase the proportion of gram-negative bacteria in the gut while reducing the abundance of some gram-positive bacteria such as Bifidobacterium [19]. In our study, the CRC group exhibited enrichment of Proteobacteria and a depletion of Firmicutes, which was closely related to food preference. Based on logistic regression analysis, we found that pickled food had significant effects on the abundance of Fusobacteria, which accounted for the greater impact of pickled food on Fusobacteria than that of red meat. Pickled foods are a favorite food of the local inhabitants, and previous epidemiological studies determined that pickled foods were closely related to CRC carcinogenesis in China [20]. Our study reveals that pickled foods may induce CRC through increasing Fusobacteria.
Gut dysbiosis can lead to over-representation of certain bacterial species that can promote colon carcinogenesis by either favoring chronic inflammation or local immunosuppression [21]. Escherichia was the main pathogenic bacteria found in our CRC patients, and it occurred at increased frequency in patients with CRC and inflammatory bowel disease [22]. Escherichia and Fusobacterium have been shown to be highly correlated with CRC by activating immune cells that release cytokines, such as interleukin (IL)-6 and IL-17, which drives inflammation and affects carcinogenesis [23]. The Western diet enhances susceptibility toward the pathogenic potential of adherent invasive Escherichia coli [24]. Our results revealed that fish, beans, and nuts significantly influence the abundance of Escherichia, and healthy individuals with more fish intake had far less Escherichia, indicating that intestinal flora is primarily affected by food intake that may shape the gut bacterial communities in a dose-dependent manner. Species- and strain-level variations can contribute to functional differences between individuals that are important in a clinical context [25]. Our study found that the effect of food on the intestinal flora may be different between CRC patients and healthy people, but the mechanism remains to be further studied.
The gut microbiota composition varies among individuals within and between communities [26]. A strong association was observed between long-term consumption of a protein and animal fat-rich diet with Bacteroides predominance and that of a carbohydrate-rich diet with Prevotella predominance [7]. This phenomenon is remarkable in native Africans (with high consumption of complex fiber) and African-Americans (with high consumption of protein), with the microbiota dominated by Bacteroides in African-Americans and by Prevotella in native Africans [27]. Bacteroides and Prevotella act as the driving taxa that explain inter-individual differences and delineate the main sources of variation [28]. A differential abundance of Bacteroidetes and Prevotella was found in Chinese and Indian subjects, due to the difference in their diet [29].
Both Bacteroides and Prevotella were the dominant flora in the individuals included in our study. Bacteroides abundance is relatively constant regardless of the foods consumed. Prevotella is known to be associated with an indigestible carbohydrate-rich diet, particularly grains such as whole wheat and barley [30]. Studies revealed that Prevotella is more prevalent in populations that consume a vegan or vegetarian diet [31]. Among the foods we studied, only fruits, beans, and nuts were found to play a significant role in the amount of Prevotella. The studied individuals consumed rice as a staple food, and whether the effect of fruits and nuts on Provetella is based on the premise of rice as a staple food, or whether fruits and nuts exert additional effects on Provetella requires further studies.
Recent studies raise the possibility that the intake of WCGs and their components can selectively modulate the microbiota composition, suggesting that WCGs can exert a prebiotic effect on Bifidobacterium and Lactobacillus spp. [32]. Bifidobacterium prevents gastrointestinal disorders such as diarrhea, IBD, and CRC [33]. Consumption of plant protein was observed to increase the Bifidobacterium and Lactobacillus genera, and decrease the pathogenic bacterial species of the Bacteroides and Clostridium genera [34]. The carbohydrate-based Asian diet drives the colonization of Bifidobacteria [29], but the abundance of Bifidobacteria was only found in our healthy individuals, revealing that individual differences still exist. There is the possibility that an overall association was modified or confounded by other dietary factors. The composition of the gut microbiota is highly dynamic and different for each human individual and changes over time [35].
In CRC carcinogenesis, the species and abundance of flora are equally important. Some bacteria are easily ignored due to their very low abundance. The diversity of the flora, especially those important but less abundant flora existing in the gut, increases the difficulty of the analysis. The gut microbiota may be successfully enriched with a beneficial bacterium or a selected cocktail of bacteria so as to improve the antitumor immunity [3]. Therefore, a classification based on compositional patterns would potentiate microbiota-based diagnostics, therapies, or prevention of disease, with implications for personalized treatment through nutritional, microbial, and pharmaceutical interventions [28]. Classification of flora according to probiotics or pathogenicity will be beneficial for evaluating the role of flora in the genesis of CRC. Firmicutes and Bacteroidetes are the dominant phyla in the gut [36]. A previous analysis of gut microbial communities resulted in proposed “enterotypes” that were dominated by Bacteroides, Prevotella, and Ruminococcus [37]. The dichotomy in the Prevotella/Bacteroides ratio was also observed between human populations with intake of significantly higher proportions of dietary fiber and meat [38]. Prevotella (when no enterotype was reported) was enriched in individuals with non-Western and/or fiber-rich diets [14,39]. An increase in Bacteroides, which tends towards lower overall diversity, has been linked to CRC [27]. In the current study, we attempted to analyze the effects of various foods on the Prevotella/Bacteroides ratio that was significant in the healthy group as compared to the CRC group, indicating that food affects the intestinal flora with different efficacies in CRC patients and in healthy people.
Identification and characterization of the significant patterns related to human gut microbiota configurations remain challenging [28]. Presently, there is no simple description of this complex landscape across large populations and geographies, in part because some taxa vary monotonically among individuals, while most others show bimodal or more complex distributions [28]. The role played by a gut bacterium in cancer occurrence and response to therapy is still in its infancy and needs to be transferred from mouse models to human beings [3]. Dietary modulation of CRC risk may be a result of the effects on the gut microbiota composition [40]. Understanding how dietary intake contributes to microbiota composition and stability in early life is essential for dietary recommendations and for designing clinical interventions for microbiota-associated diseases [15].
KEY MESSAGE
1. There was a significant difference in the food preferences between individuals with colorectal cancer (CRC) and healthy individuals.
2. The intestinal flora of CRC patients is significantly different from that of healthy people, higher levels of Fusobacteria and Proteobacteria, and lower levels of Firmicutes were observed in the CRC group.
3. The correlation exists between the intake of food and intestinal f lora. Among the foods, vegetable oil, vegetables, eggs, pickled foods, and red meat had marked impact on CRC risk.
Notes
No potential conflict of interest relevant to this article was reported.
Acknowledgements
This study supported by the Shantou Science and Technology Project (grant numbers: 180709174010328), the Guangdong Medical Research Project (grant numbers: B2019181), the Shantou Science and Technology Project (Grant No.201718239).