Distribution of serum uric acid levels and prevalence of hyper- and hypouricemia in a Korean general population of 172,970
Article information
Abstract
Background/Aims
We investigated the distribution of serum uric acid (SUA) levels and estimated the prevalence of hyperuricemia and hypouricemia in the Korean population.
Methods
This cross-sectional study used data from the Korean Genome and Epidemiology Study and included 172,970 participants (58,981 men and 113,989 women) aged 40 to 79 years. Hypouricemia and hyperuricemia were defined as SUA level ≤ 2.0 mg/dL and > 7 mg/dL, respectively. The prevalence of hyperuricemia and hypouricemia was evaluated by age and sex.
Results
The mean SUA levels were significantly higher in men than in women (5.71 ± 1.27 mg/dL vs. 4.21 ± 0.96 mg/dL, p < 0.001). The mean SUA levels and prevalence of hyperuricemia increased with age in women but not in men. The overall prevalence of hyperuricemia and that in men and women was 50.82, 133.25, and 8.17 per 1,000 persons, respectively; the overall prevalence of hypouricemia and that in men and women was 4.16, 1.10, and 5.75 per 1,000 persons, respectively. The prevalence of hypouricemia in men was similar across all age groups; however, that in women was the highest in the age group of 40 to 49 years and the lowest in the age group of 50 to 59 years.
Conclusions
The distribution of SUA levels and prevalence of hyperuricemia and hypouricemia differed according to age and sex. Age and sex should be considered in studies on uric acid-related diseases.
INTRODUCTION
Uric acid is the final product of endogenous and exogenous purine nucleotide breakdown in the human body [1,2]. Approximately 70% of serum uric acid (SUA) is excreted by the kidneys, while the remaining amount is excreted by the intestinal tract [3]. High SUA level, known as hyperuricemia, is an important risk factor for various systemic diseases, including gout, hypertension, type 2 diabetes, chronic kidney disease, and cardiovascular disease [4]. In addition, low SUA level tends to be detrimental to the human body. Hypouricemia may be associated with the development of renal dysfunction [5] and neurodegenerative diseases, such as Parkinson’s disease and Alzheimer’s disease [6,7]. Since the SUA level outside the normal range of values is associated with diseases, maintaining a balanced SUA level may aid in preventing the onset of associated diseases.
Many studies have reported that the distribution of SUA levels can vary depending on age, sex, and environmental factors [8–11]. However, no previous study has evaluated the distribution of SUA levels among Koreans using a large-scale population-based design. We investigated the distribution of SUA levels according to age and sex in the Korean population, including the prevalence of hyper- and hypouricemia.
METHODS
Study population
The Korean Genome and Epidemiology Study (KoGES) is a consortium project consisting of six prospective cohort studies categorized as population-based and general environmental model studies [12]. The data used in this study were from the health examinees (HEXA) study, which is a cohort study set up to investigate the genetic and environmental etiology of common complex diseases, such as type 2 diabetes mellitus, hypertension, metabolic syndrome, and cardiovascular diseases [12]. As specimens were prepared and stored using standard protocols for validation of biomarkers, the bias of the laboratory was controlled by the measuring instrument.
The data collected during 2004 to 2013 were extracted for this study [12]. The KoGES_HEXA study includes community-dwellers and participants recruited from the national health examinee registry, that is, men and women aged ≥ 40 years at baseline. A total of 173,357 participants (age range, 40 to 79 years) were included in this cohort (Fig. 1). We collected information on age, sex, body mass index, alcohol, smoking, hypertension, diabetes mellitus, myocardial infarction, cardiovascular event, thyroid disease, and malignancy. For chronic kidney disease (CKD), the definitions of Modification of Diet in Renal Disease estimating glomerular filtration rate (MDRD-eGFR) < 60 mL/min/1.73 m2 and CKD-Epidemiology Collaboration (CKD-EPI) < 60 mL/min/1.73 m2 were used. Individuals with missing data on age, sex, and SUA level were excluded. Participants being treated for gout during the study period were also excluded. A total of 90 participants with missing data and 297 participants on gout medication were excluded. The study protocol was approved by the Institutional Review Boards of the Hanyang University Hospital (IRB No. HYUH 2016-01-024). Informed consent was waived by the board.
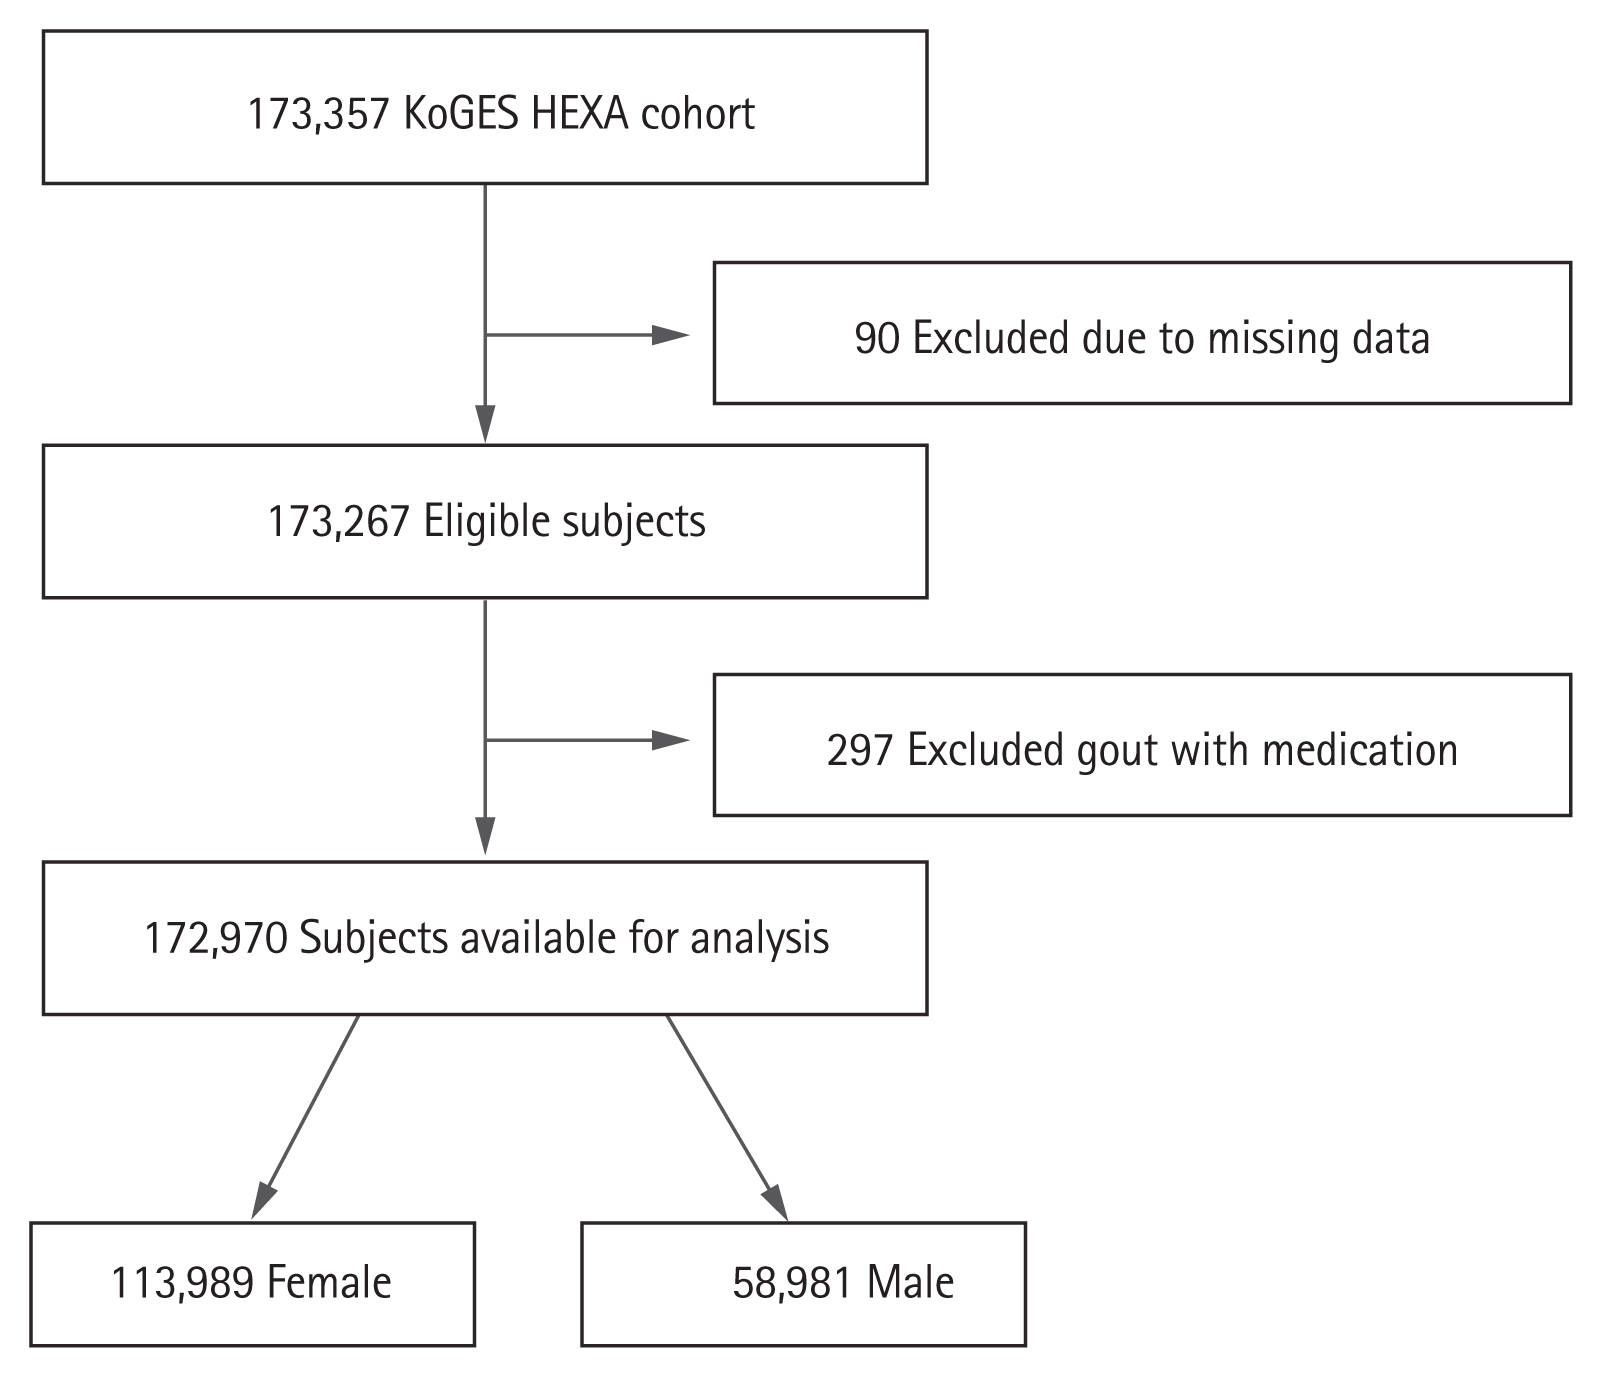
Flowchart for participant eligibility. KoGES, Korean Genome and Epidemiology Study; HEXA, health examinees.
Definition of hyperuricemia and hypouricemia
Hyperuricemia was defined as SUA level > 7.0 mg/dL in men and women based on previous studies [13–15]. We used this definition to determine the prevalence of hyperuricemia in the present study. Additionally, we included the definition of hyperuricemia as SUA level > 7.0 mg/dL in men and SUA level > 6.0 mg/dL in women from other studies [16,17]. Hypouricemia was defined as SUA level ≤ 2.0 mg/dL, according to previous studies [10,11,18]. The prevalence of hyperuricemia and hypouricemia in all participants was calculated for two definitions. Moreover, we examined the prevalence of hyperuricemia and hypouricemia excluding CKD-EPI patients because CKD has a significant effect on SUA levels from the definition of SUA level > 7.0 mg/dL.
Statistical analysis
All data were summarized as mean ± standard deviation or count (percentage). The frequency of an SUA level was the proportion of participants with that specific SUA level in the total sample. Age- and sex-specific prevalence of hyperuricemia and hypouricemia was calculated. The chi-square trend test was used to assess the difference in prevalence of hyperuricemia and hypouricemia according to age. Confidence intervals for crude and standardized prevalence rates were calculated using the Wilson score method and gamma distribution. A p values < 0.05 were considered statistically significant. All statistical analyses were performed using IBM SPSS statistical software version 23 for Windows (IBM Corp., Armond, NY, USA) and R version 3.4.3 (The R Project for Statistical Computing, Vienna, Austria).
RESULTS
The flow chart capturing participant eligibility is shown in Fig. 1. A total of 172,970 participants (58,981 men and 113,989 women) were included in this study. Demographic and clinical characteristics of the participants are shown in Table 1. The mean age of men and women was 53.97 ± 8.81 and 52.63 ± 8.09 years, respectively (p < 0.001). Most of the variables had significantly higher values in men than in women (p < 0.001); however, thyroid disease and malignancy rates were higher in women than in men (p < 0.001). The mean SUA level was significantly higher in men than in women (5.71 ± 1.27 mg/dL vs. 4.21 ± 0.96 mg/dL, p < 0.001).
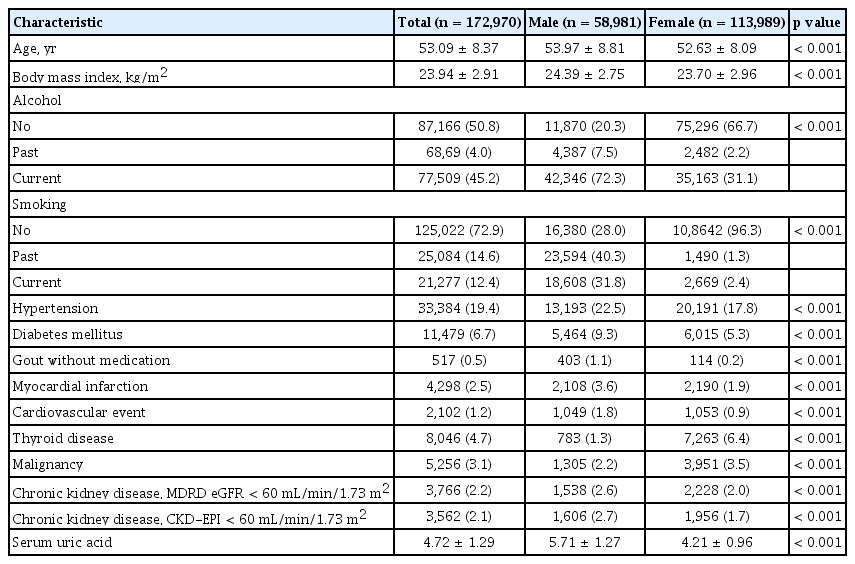
Clinical characteristics of the participants
Distribution of SUA levels
Histograms of SUA levels are shown in Fig. 2A and 2B. The range of SUA levels was wider in men than in women. Overall, women had a lower average SUA level than men, regardless of age (Fig. 2C). Concurrently, for women, the average SUA level tended to increase with age, while for men it peaked around the age of 40 years, decreasing gradually until the age of 60 years before it increased again around the age of 70 years.
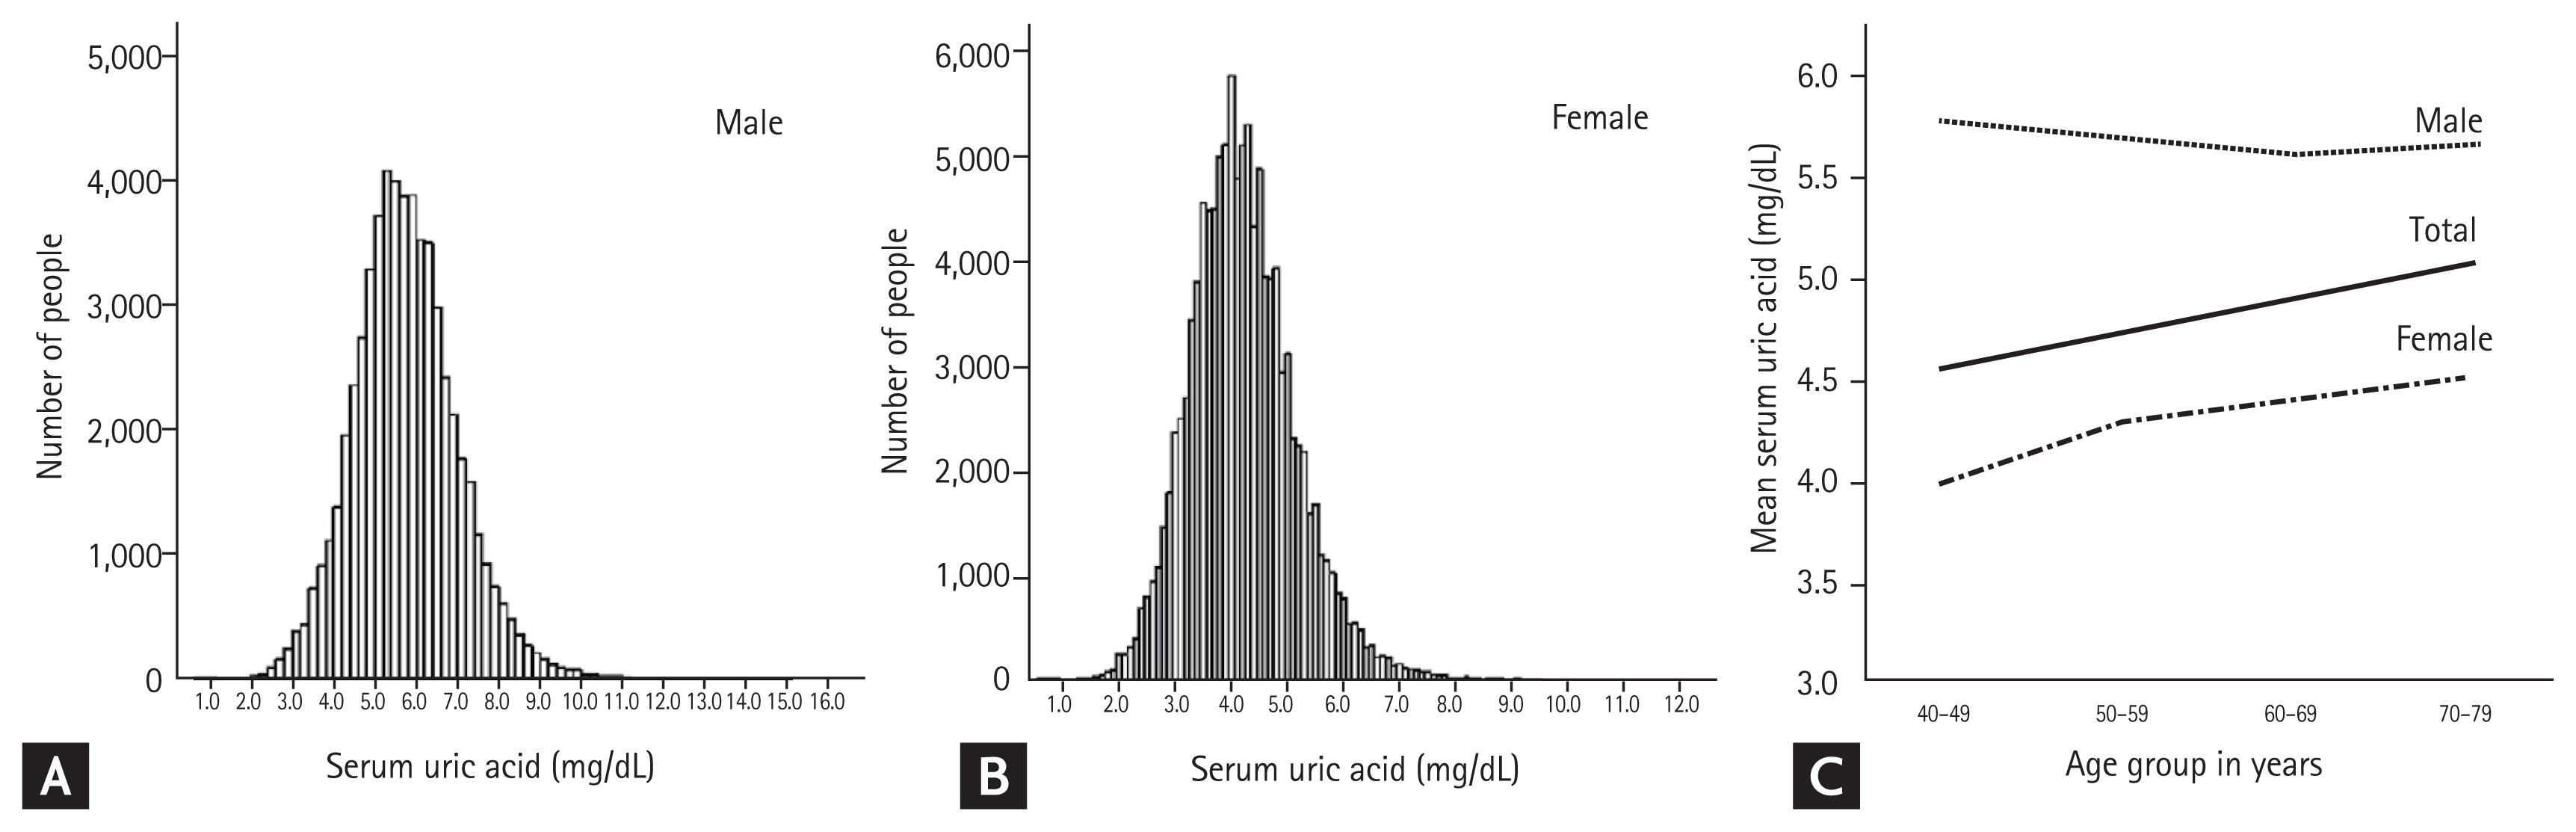
Distribution of the serum uric acid level in men (A) and women (B) and the mean serum uric acid level stratified by age and sex (C).
Prevalence of hyperuricemia
The overall prevalence of hyperuricemia (SUA > 7.0 mg/dL) was 50.82 per 1,000 persons (95% confidence interval [CI], 49.79 to 51.86); in men, it was 133.25 per 1,000 persons (95% CI, 130.53 to 136.01), and in women, it was 8.17 per 1,000 persons (95% CI, 7.66 to 8.71) (Table 1 and Fig. 3A). The overall prevalence of hyperuricemia increased with age. However, stratified by sex, the prevalence tended to gradually increase in women, while among men, it decreased between the age of 40 years and 60 years and then, gradually increased above the age of 70 years (Fig. 3A). Therefore, the pattern of serial prevalence differed between men and women (p < 0.001).
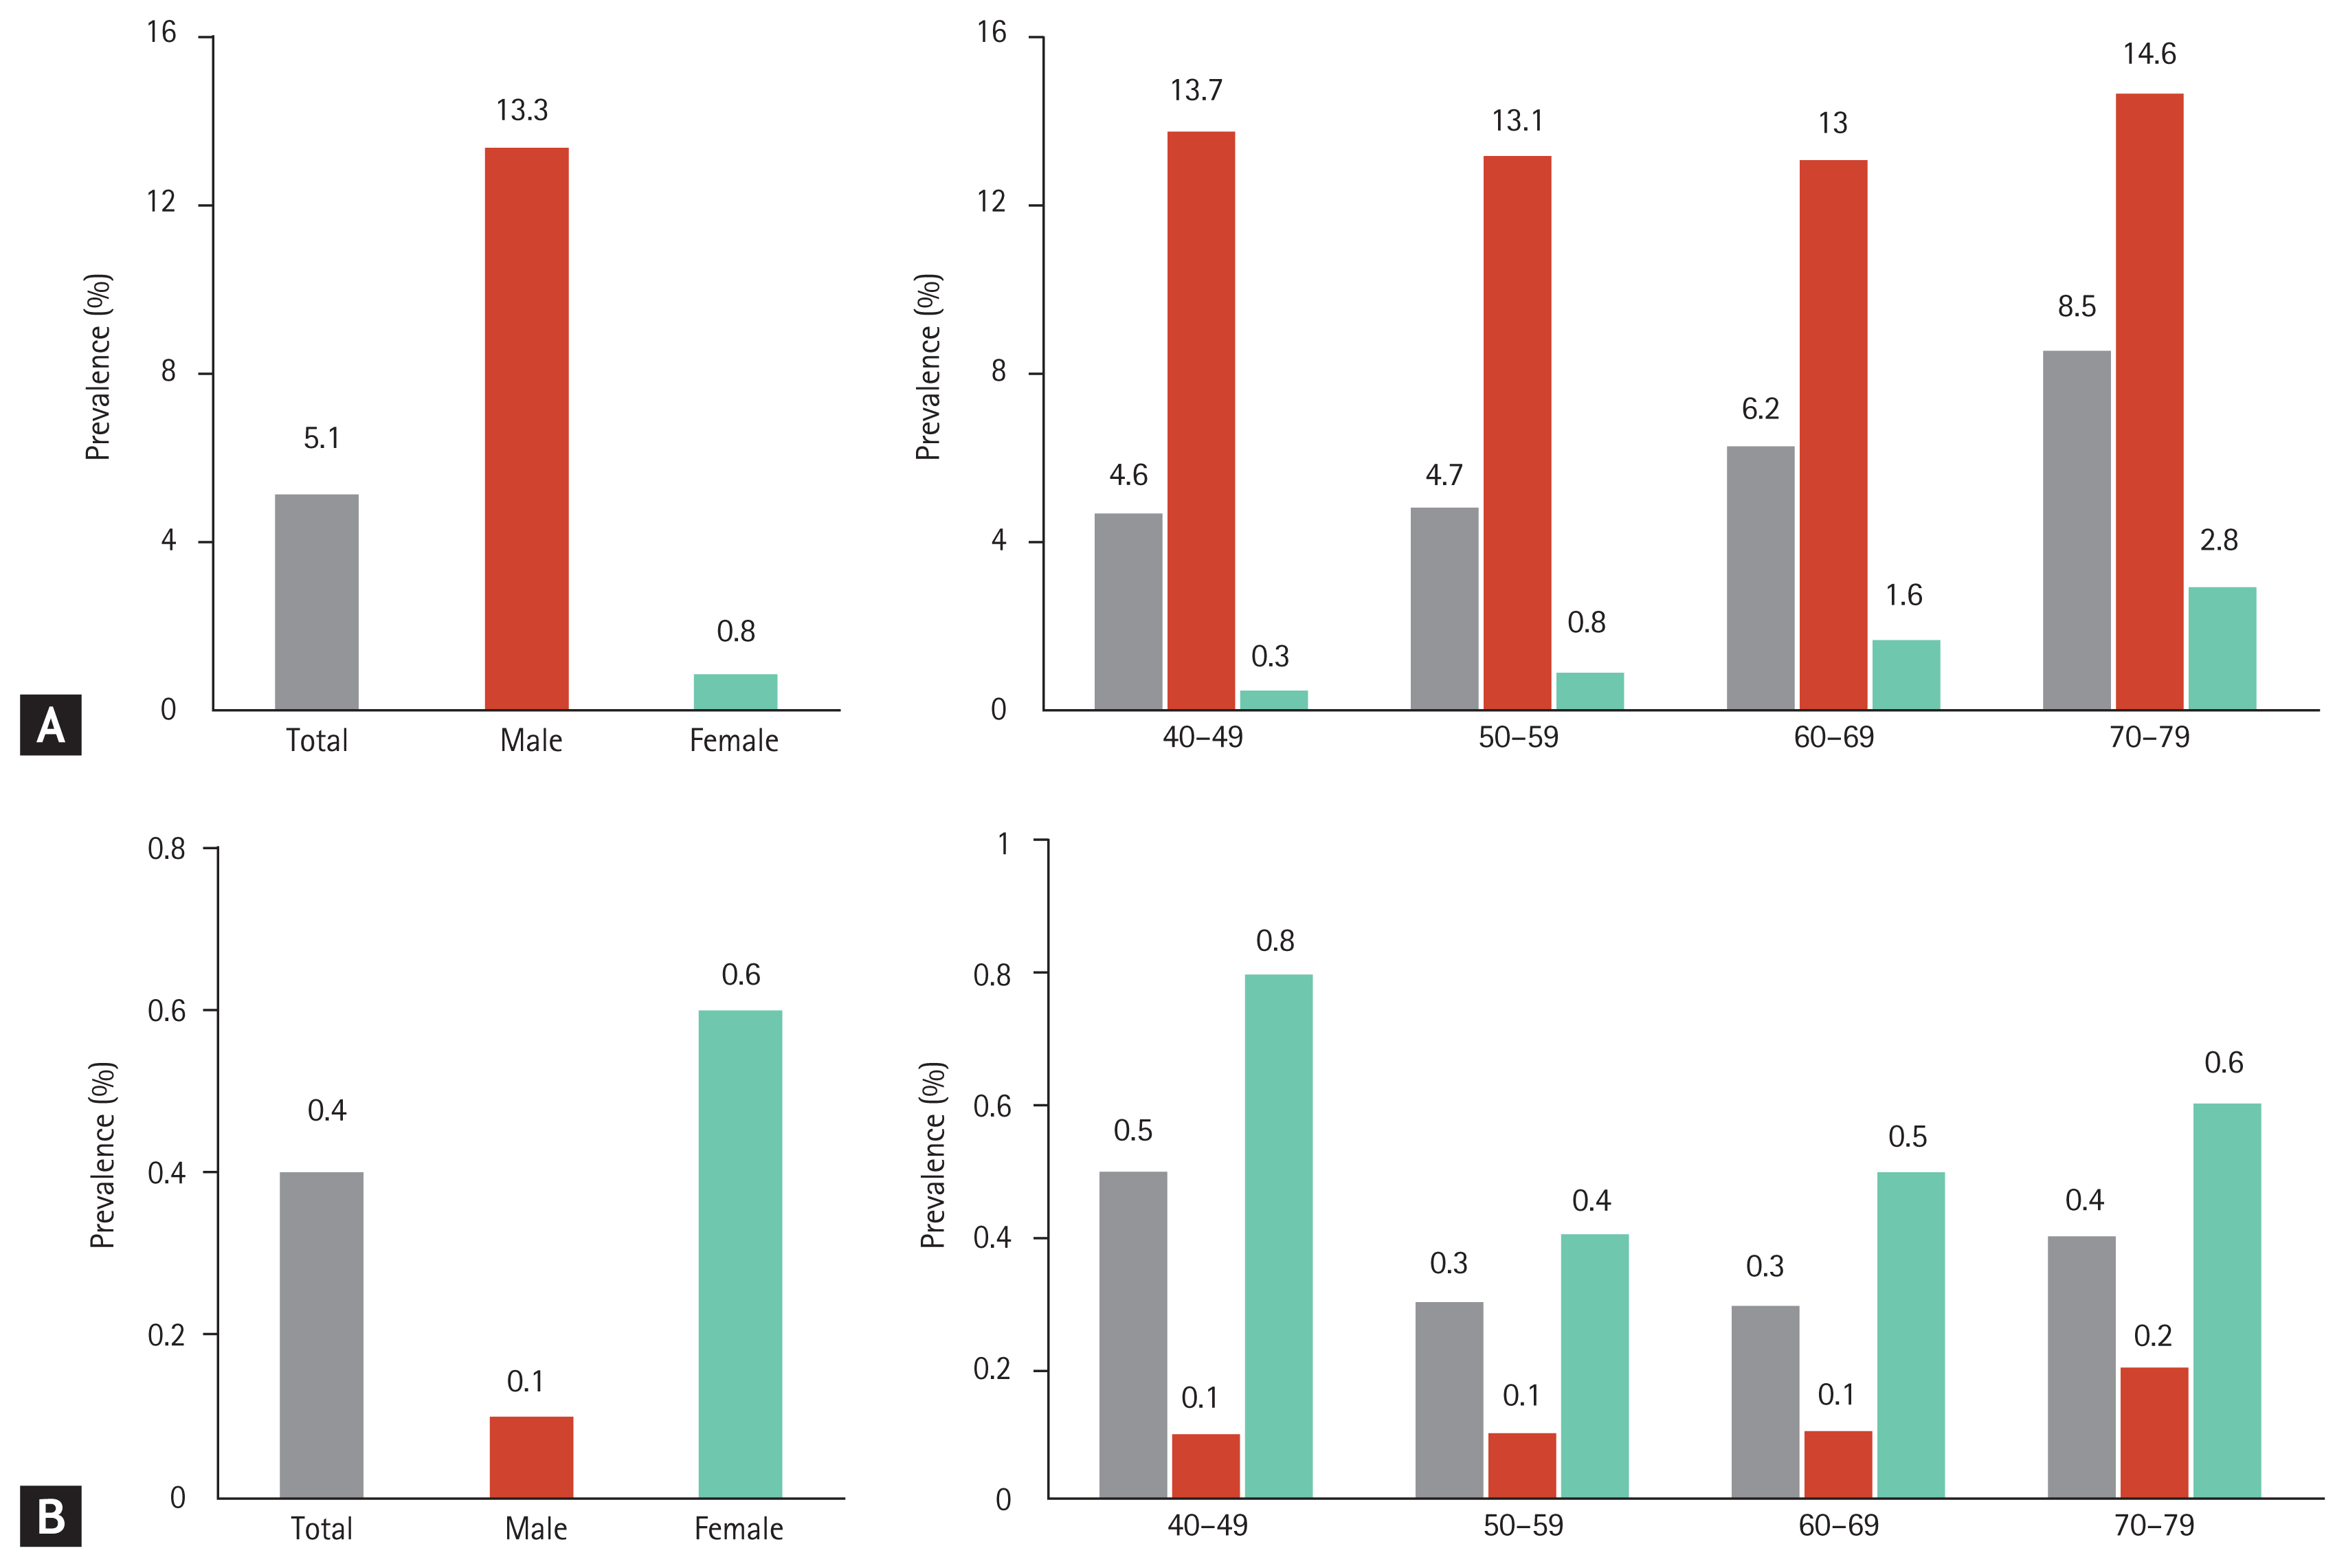
Prevalence of hyperuricemia (A) and hypouricemia (B) stratified by age and sex.
Based on a different definition of hyperuricemia (SUA > 7.0 mg/dL in men and SUA > 6.0 mg/dL in women), the overall prevalence was 69.35 per 1,000 persons (95% CI, 68.16 to 70.55), which was slightly higher than that reported based on the definition using SUA > 7.0 mg/dL. Meanwhile, the prevalence in women was 4.44 times higher using this definition than that reported with a cut-off of SUA > 7.0 mg/dL (36.28 per 1,000 persons, 95% CI, 35.21 to 37.39).
Prevalence of hypouricemia
The overall prevalence of hypouricemia was 4.16 per 1,000 persons (95% CI, 3.87 to 4.48); in men, it was 1.10 per 1,000 persons (95% CI, 0.86 to 1.40), and in women, it was 5.75 per 1,000 persons (95% CI, 5.32 to 6.20) (Table 2 and Fig. 3B). The overall prevalence of hypouricemia decreased among the participants aged 40 to 60 years and increased among participants aged > 70 years. Among men, the prevalence of hypouricemia was similar across all age groups, while among women, it peaked among the participants aged 40 to 49 years and was lowest among participants aged 50 to 59 years (Fig. 3B). Therefore, age-based prevalence of hypouricemia differed between men and women (p = 0.044).
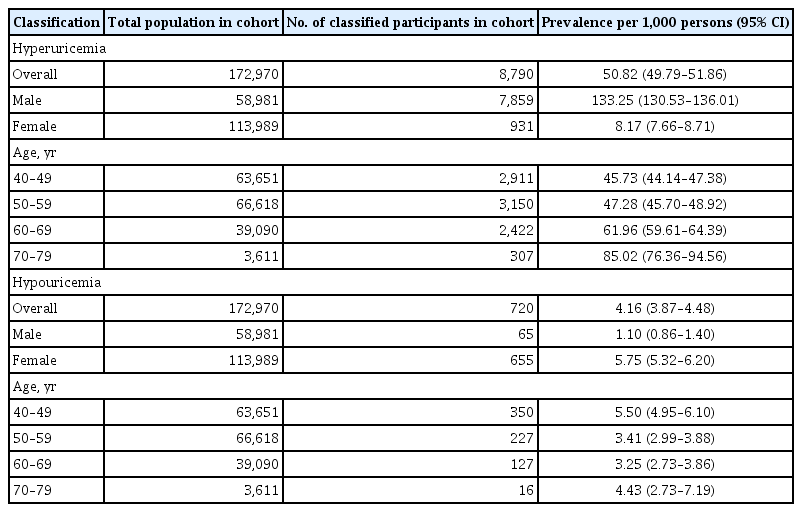
Prevalence of hyperuricemia (serum uric acid > 7.0 mg/dL) and hypouricemia (serum uric acid ≤ 2.0 mg/dL) in the Korean population
Prevalence of hyper- and hypouricemia excluding CKD patients
We investigated the prevalence of hyper- and hypouricemia, excluding CKD patients based on CKD-EPI calculation (Table 3). In the revised sample, the prevalence of hyperuricemia was lower in both men and women when CKD patients were excluded (133.25 and 8.17 per 1,000 persons, respectively) than when CKD patients were included in the analysis (Table 2). Moreover, although the prevalence in this revised sample increased with age, and the rate of increase was lower than that in a sample including CKD patients. There was no significant change in the prevalence of hypouricemia with age after inclusion of CKD patients in the analysis.
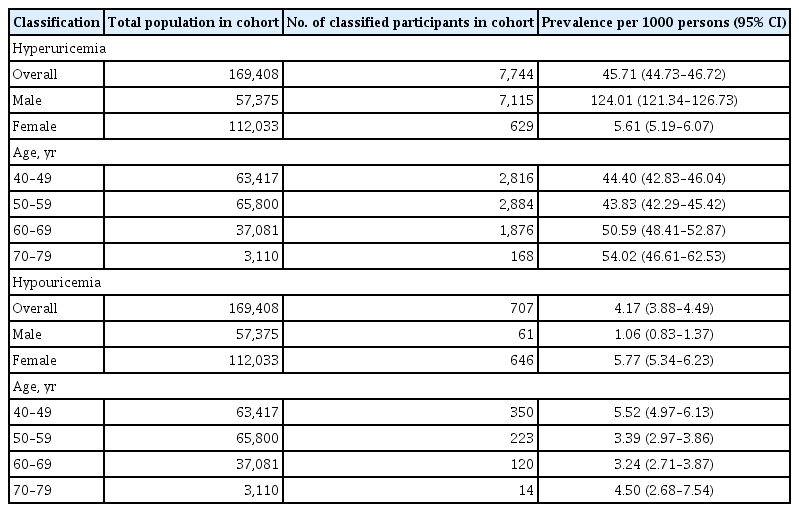
Prevalence for hyperuricemia (serum uric acid > 7.0 mg/dL) and hypouricemia (serum uric acid ≤ 2.0 mg/dL) excluding chronic kidney disease (CKD-EPI < 60 mL/min/1.73 m2) in the Korean population
DISCUSSION
We evaluated the distribution of SUA levels and prevalence of hypouricemia and hyperuricemia in the Korean population. SUA levels followed different distribution patterns according to age and sex. The prevalence of hyperuricemia was approximately 16 times higher in men than in women, while the prevalence of hypouricemia was approximately five times higher in women than in men.
In this study, the mean SUA level for men and women was 5.71 ± 1.27 and 4.21 ± 0.96 mg/dL, respectively, and both of these values were slightly lower than the values reported in a recent study based on a sample of 5,548 Koreans (5.83 and 4.36 mg/dL in men and women, respectively) [16]. Concurrently, SUA levels reported in this study were lower than those reported in recent large-scale studies in Japan (6.0 ± 1.4 and 4.5 ± 1.1 mg/dL in men and women, respectively) [19] and China (6.23 ± 1.38 and 4.38 ± 1.11 mg/dL in men and women, respectively) [20]. A study based in the United States reported that the mean SUA level was 4.4 mg/dL in white women; 4.9 mg/dL in black women; 5.8 mg/dL in white men; and 6.0 mg/dL in black men [21]. Therefore, the average SUA level may differ according to sex, race, and place of residence. Consequently, the criteria for uric acid-related diseases, including hyperuricemia or hypouricemia, may differ according to these factors.
There have been several studies on hyperuricemia (defined as SUA level ≥ 7.0 mg/dL in men and SUA level ≥ 6.0 mg/dL in women) in Korea. Among them, single-center studies using health screening data reported the prevalence of hyperuricemia in men and women as 14.3% and 2.2%, respectively, in a sample of 6,461 participants [22] and 15% and 4.1%, respectively, in a sample of 2,297 participants [23]. Meanwhile, national surveillance data-based estimates were 17.0% and 5.9%, respectively (5,548 participants) [16]. The discrepancies between these studies and the present study findings might be owing to the differences in sample composition, estimate methodology, and timeframe of the study. We believe that the present estimates based on data from 172,970 participants are a robust representation of the distribution of SUA levels in the Korean population.
Zhu et al. [8] investigated the prevalence of hyperuricemia and gout using the National Health and Nutrition Examination Survey 2007 to 2008. Although these data originated a decade ago, the prevalence of hyperuricemia was much higher in that report than in this study (overall 26.6%). The authors suggested that the prevalence of hyperuricemia increased with age and that this increase was associated with a Western diet and lifestyle, as well as complications, such as obesity and hypertension, and the use of drugs, such as diuretics and aspirin.
In our study, the prevalence of hyperuricemia was highest among men and women in their 70s; however, the pattern of age-dependent prevalence was different between men and women. The prevalence in women tended to increase gradually, but the prevalence among men decreased until the age of 60 years before it increased again over the age of 70 years. These results are comparable to the results reported by Kim et al. [16], as well as those from studies in the Chinese and Japanese populations [24,25]. Considering these findings, it is unlikely that these sex-based differences are due to nutrition, lifestyle, obesity, or medication. The reasons for the increased prevalence of hyperuricemia among middle-aged men are unclear. Future laboratory research elucidating the biological and sex- and age-specific factors determining SUA levels is warranted.
A few previous studies have reported the prevalence of hypouricemia, although there is no conclusive evidence on the relationship between hypouricemia and neurological disease [26,27]. Son et al. [18] have reported that the overall prevalence of hypouricemia was 1.39%, which differed between inpatients and outpatients treated at a single center (4.14% vs. 0.53%). This evidence indirectly suggests a relationship between hypouricemia and comorbidity. Meanwhile, Kuwabara et al. [11] showed that the prevalence of hypouricemia in patients undergoing an annual health check-up was 0.19% and 0.58% in two evaluated centers.
Considering the relatively high prevalence of CKD among older adults [28,29] and the association between CKD and SUA levels [30], CKD might be a risk factor for hyperuricemia in older age. In the present study, the relative decrease in the prevalence of hyperuricemia among older adults after excluding patients with CKD supports the hypothesis that CKD is associated with hyperuricemia. In addition, Park et al. [29] suggested that CKD prevalence in Korea (8.2%) was lower than that in the United States (13.1%) and China (10.8%). CKD prevalence might be an important factor underpinning the differences in the prevalence of hyperuricemia between countries.
Wakasugi et al. [10] conducted a population-based cross-sectional study examining the association between hypouricemia and kidney function. They reported that the prevalence of hypouricemia was 0.2% and 0.4% in men and women, respectively. In our study, the prevalence of hypouricemia was 1.10 per 1,000 persons in men and 5.57 per 1,000 persons in women. These sex-based differences in prevalence might be related to hormonal differences between men and women [31]. In addition, the prevalence in men was comparable across age groups, while the prevalence in women was the highest in the 40s age group. Previous studies have suggested that menopause may affect SUA levels; however, the exact mechanism has not been elucidated [10,32].
This study has several limitations. First, the cohort used in this study included participants aged 40 years or more, as the KoGES was established to investigate the genetic and environmental etiology of common complex diseases, such as type 2 diabetes mellitus, hypertension, obesity, metabolic syndrome, osteoporosis, cardiovascular disease, and cancer with long-term follow-up, and the causes of death among Koreans. Second, as the SUA level was only measured once, it was not possible to check whether hypouricemia or hyperuricemia was transient or persistent, which should be confirmed in a follow-up study. Third, this study did not control for medication use which might have affected the results, as certain medications can increase or decrease SUA levels. Although patients treated for gout during the study period were excluded from analysis, the possibility that the data may be distorted due to medication-related effects cannot be eliminated. Fourth, changes in environmental factors might affect the epidemiology of SUA levels during follow-up. Finally, this cohort is likely to be affected by chronic diseases, which might have impacted our findings. However, an examination of a relationship between chronic diseases and SUA levels was beyond the scope of this study.
In conclusion, this study reported the distribution of SUA levels and prevalence of hyper- and hypouricemia according to sex and age based on a large nationwide health examinee cohort. We found that the distribution of the SUA level differed according to age and sex. Therefore, prior to the study of diseases associated with SUA levels, it is necessary to establish a normal range of SUA levels according to age and sex.
KEY MESSAGE
The distribution of serum uric acid levels differed according to age and sex.
The prevalence of hyperuricemia was 133.25 per 1,000 persons in men and 8.17 per 1,000 persons in women.
The prevalence of hypouricemia was 1.10 per 1,000 persons in men and 5.75 per 1,000 persons in women.
Acknowledgements
This study was conducted with bioresources from the National Biobank of Korea, the Centers for Disease Control and Prevention, Republic of Korea (KBP-2016-011). This work was supported by the 2018 Inje University research grant.
Notes
Conflict of interest
No potential conflict of interest relevant to this article was reported.