Water-soluble coenzyme Q10 provides better protection than lipid-soluble coenzyme Q10 in a rat model of chronic tacrolimus nephropathy
Article information
Abstract
Background/Aims
Coenzyme Q10 (CoQ10), is a promising antioxidant; however, low bioavailability owing to lipid-solubility is a limiting factor. We developed water-soluble CoQ10 (CoQ10-W) and compared its effects with conventional lipid-soluble CoQ10 (CoQ10-L) in an experimental model of chronic tacrolimus (Tac) nephropathy.
Methods
CoQ10-W was developed from a glycyrrhizic-carnitine mixed layer CoQ10 micelle based on acyltransferases. Chronic nephropathy was induced in rats with 28-day Tac treatment; they were concomitantly treated with CoQ10-L or CoQ10-W. CoQ10 level in plasma and kidney were measured using liquid chromatography–mass spectrometry. CoQ10-W and CoQ10-L effects on Tac-induced nephropathy were assessed in terms of renal function, histopathology, oxidative stress, and apoptotic cell death. Their effects on cell viability and reactive oxygen species (ROS) production were assessed in cultured proximal tubular cells, human kidney 2 (HK-2) cells.
Results
The plasma CoQ10 level was significantly higher in the CoQ10-W group than in the CoQ10-L group. Tac treatment caused renal dysfunction, typical pathologic lesions, and oxidative stress markers. Serum creatinine was restored in the Tac + CoQ10-L or CoQ10-W groups compared with that in the Tac group. CoQ10-W administration reduced oxidative stress and apoptosis markers. Mitochondrial ultrastructure assessment revealed that the addition of CoQ10-L or CoQ10-W with Tac increased mitochondrial size and number than Tac treatment alone. In vitro investigations revealed that both CoQ10-L and CoQ10-W improved cell viability and reduced ROS production in the Tac-induced HK-2 cell injury.
Conclusions
CoQ10-W has a better therapeutic effect in Tac-induced renal injury than conventional CoQ10-L, possibly associated with improved CoQ10 bioavailability
INTRODUCTION
Tacrolimus (Tac), a calcineurin inhibitor, is the most popular regimen in current clinical practice because this regimen can significantly reduce acute rejection rates of transplants and provide excellent early outcomes. In spite of excellent immunosuppression, Tac has considerable side effects that may hamper long-term kidney graft and patient survival, and cause major additional morbidity [1]. The pathogenesis is multifactorial, and oxidative stress has been proposed as a common mechanism of Tac-induced renal injury [2–4]. Thus, reducing Tac-induced oxidative stress is a promising approach to improving therapeutic outcomes.
Coenzyme Q10 (CoQ10), a lipid-soluble molecule derived mainly from endogenous synthesis [5], with the highest levels in the heart, liver, kidney, and pancreas, acts as an antioxidant by functioning as an electron carrier in mitochondrial oxidative phosphorylation [6]. Because lipid-soluble CoQ10 (CoQ10-L) has important functions in the body and people with some diseases have reduced levels of this substance, several studies have focused on investigating whether CoQ10-L supplements might have health benefits [7].
Therapeutic applications of CoQ10 are greatly limited by its poor bio-availability, due to its lack of solubility in aqueous media. A recent study demonstrated that, in rats, only 3% of orally administered CoQ10 can be absorbed [8]. Supplementation with enhanced bioavailability of CoQ10 formulation has been thought to be more beneficial, especially for situations in which adequate CoQ10 production is adversely affected [9]. Several advancements have been made to enhance the bioavailability of CoQ10 using various approaches like size reduction, solubility enhancement (by solid dispersion, prodrug, complexation, ionization) and use of novel drug carriers such as liposomes, microspheres, nanoparticles, nanoemulsions, and self-emulsifying systems [10].
Thus, we developed a water soluble CoQ10 (CoQ10-W) as better uptake may be the first step in improving its biological availability and shows more benefit effects than CoQ10-L [11–15].
METHODS
Development of CoQ10-W
CoQ10 was purchased from Kaneka Nutrients (Pasadena, TX, USA). Trisodium glycyrrhizinate hydrate was purchased from Tokyo Chemical Industry Co. LTD. (Tokyo, Japan). Eicosapentaenoic acid (EPA) was purchased from Phycoil Biotech Korea, Inc. (Seoul, Korea). EPA was used to improve micelle stability because glycyrrhizin alone is not enough to maintain the micelle. In addition, EPA itself reduces the inflammatory response by inhibiting prostaglandin synthesis. To produce a uniform nano-emulsion (Qmicelle), the following pretreatment is essential. Coenzyme Q10, EPA, and trisodium glycyrrhizinate hydrate (at a concentration of 1 mg/mL each) were dispersed in hot water the mixture was pre-homogenized at 10,000 rpm with a homogenizer (Multi-Purpose Homogenizer, YSTRAL, Ballrechten-Dottingen, Germany) until a homogeneous consistency was obtained. An APV2000 microfluidizer processor (SPX Flow, Leeds, UK) was used to produce nano-emulsions (Qmicelle). It has a reservoir capacity of 1,500 mL and can be operated at pressures of up to 2,000 bars. The prepared mixture at 60°C was poured into the fluidizer and Qmicelle was obtained after 10 cycles at a pressure of 1,200 bars. Each component under EPA, CoQ10, and trisodium glycyrrhizinate hydrate, showed single peaks at retention times of 6.0, 6.6, and 15.9 minutes, respectively, and their concentrations were 0.24, 1.0, and 0.6 mg/mL. We detected homogeneity and size distribution by dynamic light scattering (DLS), and conformed that sizes of the Qmicelles were uniform and distributed in a narrow range around 100 nm.
Animals and drugs
All animal experiments in this study were performed in accordance with the Guidelines for the Care and Use of Laboratory Animals, Catholic University of Korea (CUMC-2018-0340-01), and all procedures in this study were performed in accordance with the ethical guidelines for animal studies. Eight-week-old male Sprague Dawley rats (Charles River Technology, Seoul, Korea) that initially weighed 220 to 230 g were housed in cages (Nalge Co., Rochester, NY, USA) in a temperature- and light-controlled environment at the Catholic University of Korea’s animal care facility. The rats received a low-salt diet (0.05% sodium; Teklad Premier, Madison, WI, USA).
Experiments and designs
The primary goals of this study were to determine if CoQ10-W has better protective effects than CoQ10-L in Tac-induced renal injury. After acclimation for 1 week, weight-matched rats were randomized into four groups, nine per group, as follows.
Vehicle (VH) group: rats received a daily subcutaneous injection of olive oil (0.3 mg/kg) and oral administration of sterile water for 4 weeks.
Tac group: rats received a daily subcutaneous injection of Tac (1.5 mg/kg).
Tac + CoQ10-L group: rats received a daily subcutaneous injection of Tac (1.5 mg/kg) and oral administration of CoQ10-L (20 mg/kg) for 4 weeks.
Tac + CoQ10-W group: rats received a daily subcutaneous injection of Tac (1.5 mg/kg) and oral administration of CoQ10-W (20 mg/kg) for 4 weeks.
We decided on the route of administration and the concentration based on previous studies [16,17].
Rats were pair-fed, and their body weight was monitored daily. After the 4-week treatment period, animals were housed individually in metabolic cages, and their water intake and urine volume were measured over 24 hours. On the following day, animals were anesthetized, and blood samples and tissue specimens were obtained for further analysis. Serum creatinine was measured using a quantitative enzyme colorimetric method (Stanbio Laboratory, Boerne, TX, USA).
Measurement of Tac level and CoQ10 concentration
Tac level in whole-blood was measured using liquid chromatography-tandem mass spectrometry (Abbott Diagnostics, Abbott Park, IL, USA). Content of CoQ10 in plasma was measured by liquid chromatography-tandem mass spectrometry (LC-MS/MS) analysis [18].
Immunohistochemistry and TUNEL staining
Immunohistochemistry was performed as described previously [2]. Oxidative damage markers (8-hydroxy-2′-deoxyguanosine [8-OHdG] and 4-hydroxy-2-hexenal [4-HHE]), and pro-inflammatory marker (ED-1) were detected in 4-m tissue sections by incubating the cells for 12 hours with specific antibodies against 8-OHdG (JaICA), 4-HHE (JaICA, Shizuoka, Japan), and ED-1 (AbDSerotec, Oxford, UK) at 4°C. The TdT-mediated dUTP nick-end labeling (TUNEL) staining was performed and evaluated using the In Situ Apoptosis Detection Kit (Millipore, Billerica, MA, USA) as per the manufacturer’s protocols. All data were analyzed using a color image analyzer (TDI Scope Eye version 3.6 for Windows, Seoul, Korea). Each section was counted in 20 different fields at 200× magnification.
Immunoblot analysis
Immunoblot analysis was performed as described previously [19,20]. Using tissue lysates from the renal cortex, E-cadherin (BD Biosciences, San Jose, CA, USA), α-smooth muscle actin (α-SMA), collagen type IV, active caspase-3, BCL2-associated X (BAX), and β-actin were detected by incubating for 12 hours with specific antibodies against E-cadherin (BD Biosciences), α-SMA (Sigma, St Louis, MO, USA), collagen type IV (Abcam, Cambridge, UK), active caspase-3 (Millipore), Bax (Delta Biolabs, Gilroy, CA, USA), and β-actin (Sigma) at 4°C.
Measurement of interstitial fibrosis and glomerular injury in kidney
Histological assessment of tubule interstitial fibrosis (TIF) in trichrome-stained tissue sections was performed as described previously [21]. The extent of fibrosis was estimated by counting the percentage of injured area per field using a polygon program. A minimum of 20 fields per section was assessed and graded using color image analyzer (TDI Scope Eye version 3.0 for Windows, Olympus, Tokyo, Japan). Histopathological analyses were performed in randomly selected cortical fields of sections by a pathologist blinded to the identity of the treatment groups.
8-OHdG detection in serum and urine
All procedures strictly followed the protocol described in the enzyme linked immunosorbent assay (ELISA) kit (Cell Biolabs, San Diego, CA, USA).
Transmission electron microscopy
Kidney cortex tissues were fixed in 2.5% glutaraldehyde (diluted in 0.1 M phosphate buffer), post-fixed with 1% Osmium (VIII) oxide (OsO4) and then embedded in Epon 812. Ultrathin sections were prepared using the embedded tissues, and the sections were stained with uranyl acetate/lead citrate. A JEM-1200EX transmission election microscope (JEOL, Tokyo, Japan) was used for photography, and 20 randomly selected sites were scanned at ×5,000 magnification. We counted mitochondria number per cell and measured mitochondrial area per cell in the scanned areas using an image analyzer (TDI Scope Eye version 3.6).
Measurement of cell viability
Human kidney 2 (HK-2) cells were seeded into 96-well plates at a density of 2.5 × 10⁴ cells/well. After pre-incubation in an incubator at 37°C for 24 hours, the culture medium was changed to serum-free medium containing Tac (50 μg/mL) and CoQ10-L or CoQ10-W (1, 10, 100 pg/mL; 1, 10, 100 ng/mL; and 1 μg/mL). Cell viability was assayed using a Cell Counting Kit-8 assay kit (Dojin Laboratories, Kumamoto, Japan) according to the manufacturer’s protocol.
Flow cytometry
Flow cytometry was performed to assess reactive oxygen species (ROS) production. HK-2 cells were seeded into 6-well plates at a density of 2.5 × 10⁵ cells/well. After pre-incubation in an incubator at 37°C for 24 hours, the culture medium was changed to serum-free medium containing Tac (50 μg/mL) and CoQ10-L or CoQ10-W (1, 10, 100 pg/mL; 1, 10, 100 ng/mL; and 1 μg/mL). The evaluation method was performed as described previously [22].
Statistics
All data are presented as the mean ± standard error (SE) of more than three independent experiments. Multiple comparisons between different groups were identified by one-way analysis of variance with Bonferroni post hoc tests using IBM SPSS Statistics version 24 (IBM, Armonk, NY, USA). Results with p values less than 0.05 were considered significant.
RESULTS
Comparison of CoQ10 concentration between CoQ10-L and CoQ10-W in chronic Tac nephropathy
The concentration of CoQ10 in plasma (Fig. 1A) in the VH and Tac groups was 57 ± 19 and 33 ± 10 ng/mL, respectively (p < 0.05). However, the CoQ10 level in the Tac + CoQ10-W group was nearly twice as high as that in the Tac + CoQ10-L group (888 ± 101 ng/mL vs. 463 ± 91 ng/mL, respectively; p < 0.05 vs. Tac + CoQ10-L group). In the kidney tissue (Fig. 1B), the CoQ10 content was lower in the Tac group than in the VH (1,837 ± 196 ng/mL vs. 2,481 ± 78 ng/mL, respectively; p < 0.05 vs. VH group). An increase in CoQ10 level was observed in both Tac + CoQ10-L and Tac + CoQ10-W groups compared with that in the Tac group (2,665 ± 316 ng/mL in the Tac + CoQ10-L group and 2,629 ± 319 ng/mL in the Tac + CoQ10-W, p < 0.05 vs. Tac group) in the kidney. However, there was no significant difference between the two groups.
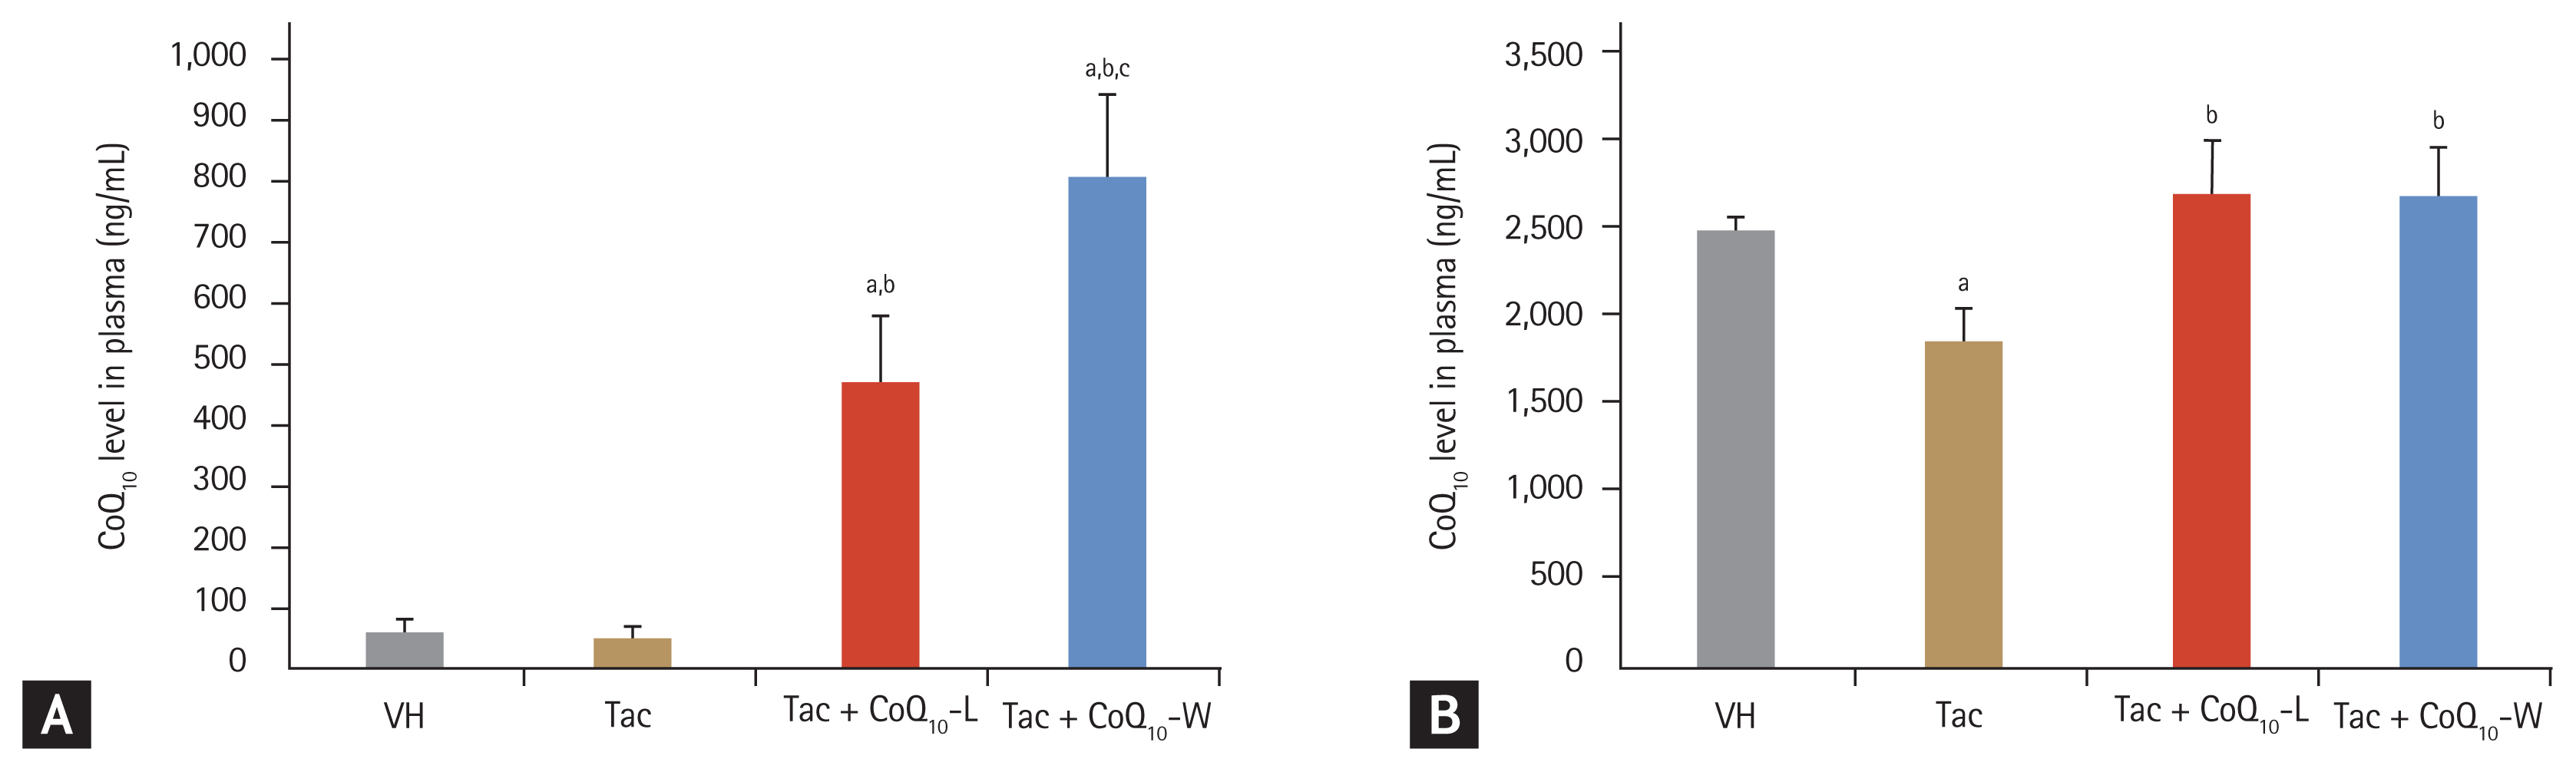
Comparison of coenzyme Q10 (CoQ10) concentration in plasma and kidney tissue between CoQ10-W and CoQ10-L in chronic tacrolimus (Tac) nephropathy. Concentration of CoQ10 in plasma (A) and kidney tissue (B) was measured by liquid chromatography-tandem mass spectrometry (LC-MS/MS) analysis. Data are presented as the mean ± standard error (n = 9). One-way analysis of variance was used to analyze the data. VH, vehicle; Tac + CoQ10-L, co-treatment with lipid-soluble coenzyme Q10; Tac + CoQ10-W, co-treatment with water-soluble coenzyme Q10. ap < 0.05 vs. the VH group, bp < 0.05 vs. the Tac group, cp < 0.05 vs. the Tac + CoQ10-L group.
Comparison of renal function and basic parameters between CoQ10-L and CoQ10-W in chronic Tac nephropathy
Table 1 summarizes the characteristics of each group of rats after daily treatment with Tac with/without CoQ10 for 4 weeks. Compared with the VH group, the Tac group had significantly changed body weight, water intake, and urine volume. Tac treatment alone resulted in higher levels of serum creatinine than that in VH-treated rats; however co-treatment with CoQ10-L or CoQ10-W along with Tac normalized kidney function.
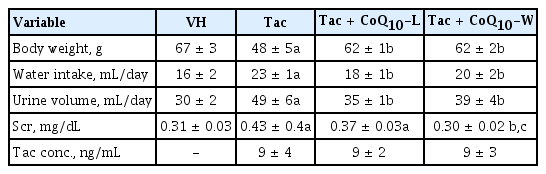
Basic parameters in each group
Comparison of anti-inflammatory effect between CoQ10-L and CoQ10-W in chronic Tac nephropathy
We investigated the infiltration of ED-1 positive cells in kidney tissue to evaluate the effect of CoQ10-L and CoQ10-W on Tac-induced inflammatory processes (Fig. 2). As shown in Fig. 2A, the number of ED-1-positive cells was decreased in the VH group. However, Tac treatment markedly increased these numbers, and this increase was markedly attenuated by treatment with CoQ10. Interestingly, addition of CoQ10-W showed a much reduced number of ED-1-positive cells compared to that with CoQ10-L during Tac treatment. Quantitative analysis of Fig. 2A results demonstrate that there was a great contrast in the number of ED-1 positive cells between the VH and Tac groups (432 ± 3 mm2/104 vs. 3 ± 0.3 mm2/104, respectively; p < 0.05 vs. VH group). However, there was a marked reduction in ED-1 positive cells in the Tac + CoQ10-W group compared with that in the Tac + CoQ10-L group (9.2 ± 0.4 mm2/104 vs. 23.5 ± 1.8 mm2/104, respectively; p < 0.05 vs. Tac + CoQ10-L group).

Comparison of anti-inflammatory effect between CoQ10-W and CoQ10-L in chronic tacrolimus (Tac) nephropathy. Representative photomicrographs of immunohistochemistry for ED-1 in experimental groups (A) and semi-quantitative analysis (B). Arrows indicate the ED-1 positive cells. Data are presented as the mean ± standard error (n = 9). Scale bar = 100 μm. One-way analysis of variance was used to analyze the data. VH, vehicle; CoQ10, coenzyme Q10; Tac + CoQ10-L, co-treatment with lipid-soluble coenzyme Q10; Tac + CoQ10-W, co-treatment with water-soluble coenzyme Q10. ap < 0.05 vs. the VH group, bp < 0.05 vs. the Tac group, cp < 0.05 vs. the Tac + CoQ10-L group.
Comparison of anti-fibrotic effect between CoQ10-L and CoQ10-W in chronic Tac nephropathy
Fig. 3 shows that co-treatment with CoQ10-W or CoQ10-L had an anti-fibrotic effect in Tac-induced nephropathy. Fig. 3A shows that Tac treatment alone increased extensive tubule interstitial fibrosis compared with that in the VH group (16.3% ± 0.4% vs. 4.5% ± 0.1%, respectively; p < 0.05 vs. VH group). Concurrent treatment with CoQ10 decreased the tubule interstitial fibrosis level compared to that with Tac treatment; however, CoQ10-W attenuated the tubule interstitial fibrosis level further than that by CoQ10-L (11% ± 0.4% vs. 13% ± 0.3%, respectively; p < 0.05 vs. Tac + CoQ10-L group). At the molecular level, the expression levels of E-cadherin were lower (62% ± 3% vs. 100% ± 0.1%, p < 0.05 vs. VH group) and those of α-SMA (130% ± 5.5% vs. 100% ± 0.1%, p < 0.05 vs. VH group, p < 0.05), collagen IV (231.9% ± 19.4% vs. 100% ± 0.1%, p < 0.05 vs. VH group, p < 0.05) after Tac treatment than in the VH group. These levels were restored by co-treatment with CoQ10-L or CoQ10-W. Especially, treatment with CoQ10-W significantly changed the E-cadherin (89% ± 2.8% vs. 75.5% ± 2.7%, p < 0.05 vs. CoQ10-L group), α-SMA (121% ± 11% vs. 148% ± 6%, p < 0.05 vs. CoQ10-L group) and collagen IV (165.3% ± 6.4% vs. 181.6% ± 7.5%, p < 0.05 vs. CoQ10-L group, p < 0.05) levels compared to those by CoQ10-L (Fig. 3C–3E).

Comparison of anti-fibrotic effect between CoQ10-W and CoQ10-L in chronic tacrolimus (Tac) nephropathy. Representative photomicrographs of immunohistochemistry for trichrome in experimental groups (A) and semi-quantitative analysis (B). Immunoblot analysis of E-cadherin, α-smooth muscle actin (α-SMA), and collagen IV (C, D, E, F). Data are presented as the mean ± standard error (n = 9). Scale bar = 100 μm. The relative optical densities of bands in each lane were normalized to each β-actin band from the same gel. One-way analysis of variance was used to analyze the data. VH, vehicle; CoQ10, coenzyme Q10; Tac + CoQ10-L, co-treatment with lipid-soluble coenzyme Q10; Tac + CoQ10-W, co-treatment with water-soluble coenzyme Q10. ap < 0.05 vs. the VH group, bp < 0.05 vs. the Tac group, cp < 0.05 vs. the Tac + CoQ10-L group.
Comparison of anti-oxidative effect between CoQ10-L and CoQ10-W in chronic Tac nephropathy
Fig. 4 shows the results for 8-OHdG in the kidney tissues and serum and 24-hour urinary excretion level. The expression of 8-OHdG was significantly higher in the Tac group than in the VH group (288 ± 16 mm2/104 vs. 122 ± 10 mm2/104, respectively; p < 0.05 vs. VH group), and decreased by co-treatment with CoQ10-L (231 ± 10 mm2/104; p < 0.05 vs. Tac group) or CoQ10-W (142 ± 5 mm2/104; p < 0.05 vs. Tac group). Higher levels of 8-OHdG in serum and urine were also detected in the Tac group than those in the VH group (serum, 9.4 ± 0.5 ng/mL vs. 7.8 ± 0.5 ng/mL; p < 0.05 vs. VH group; urine, 90.3 ± 12.1 ng/mL/day vs. 39.8 ± 10.8 ng/mL/day; p < 0.05 vs. VH group) however, significant changes were only observed in the CoQ10-L (serum, 8.3 ± 0.4 ng/mL; urine, 59 ± 8.6 ng/mL/day; p < 0.05 vs. Tac group) and CoQ10-W (serum, 7 ± 0.4 ng/mL vs. urine, 32.4 ± 13.7 ng/mL/day; p < 0.05 vs. Tac group) groups (Fig. 4C and 4D). Tac + CoQ10-W reduced 8-OHdG expression further than that by Tac + CoQ10-L in the kidney tissue, serum, and 24-urine during treatment with Tac. Tac-induced 4-HHE expression also showed results consistent with those of 8-OHdG as shown in Fig. 5 (Tac + CoQ10-L, 21.5 ± 0.7 mm2/1010 vs. Tac + CoQ10-W, 7.1 ± 0.4 mm2/104; p < 0.05).
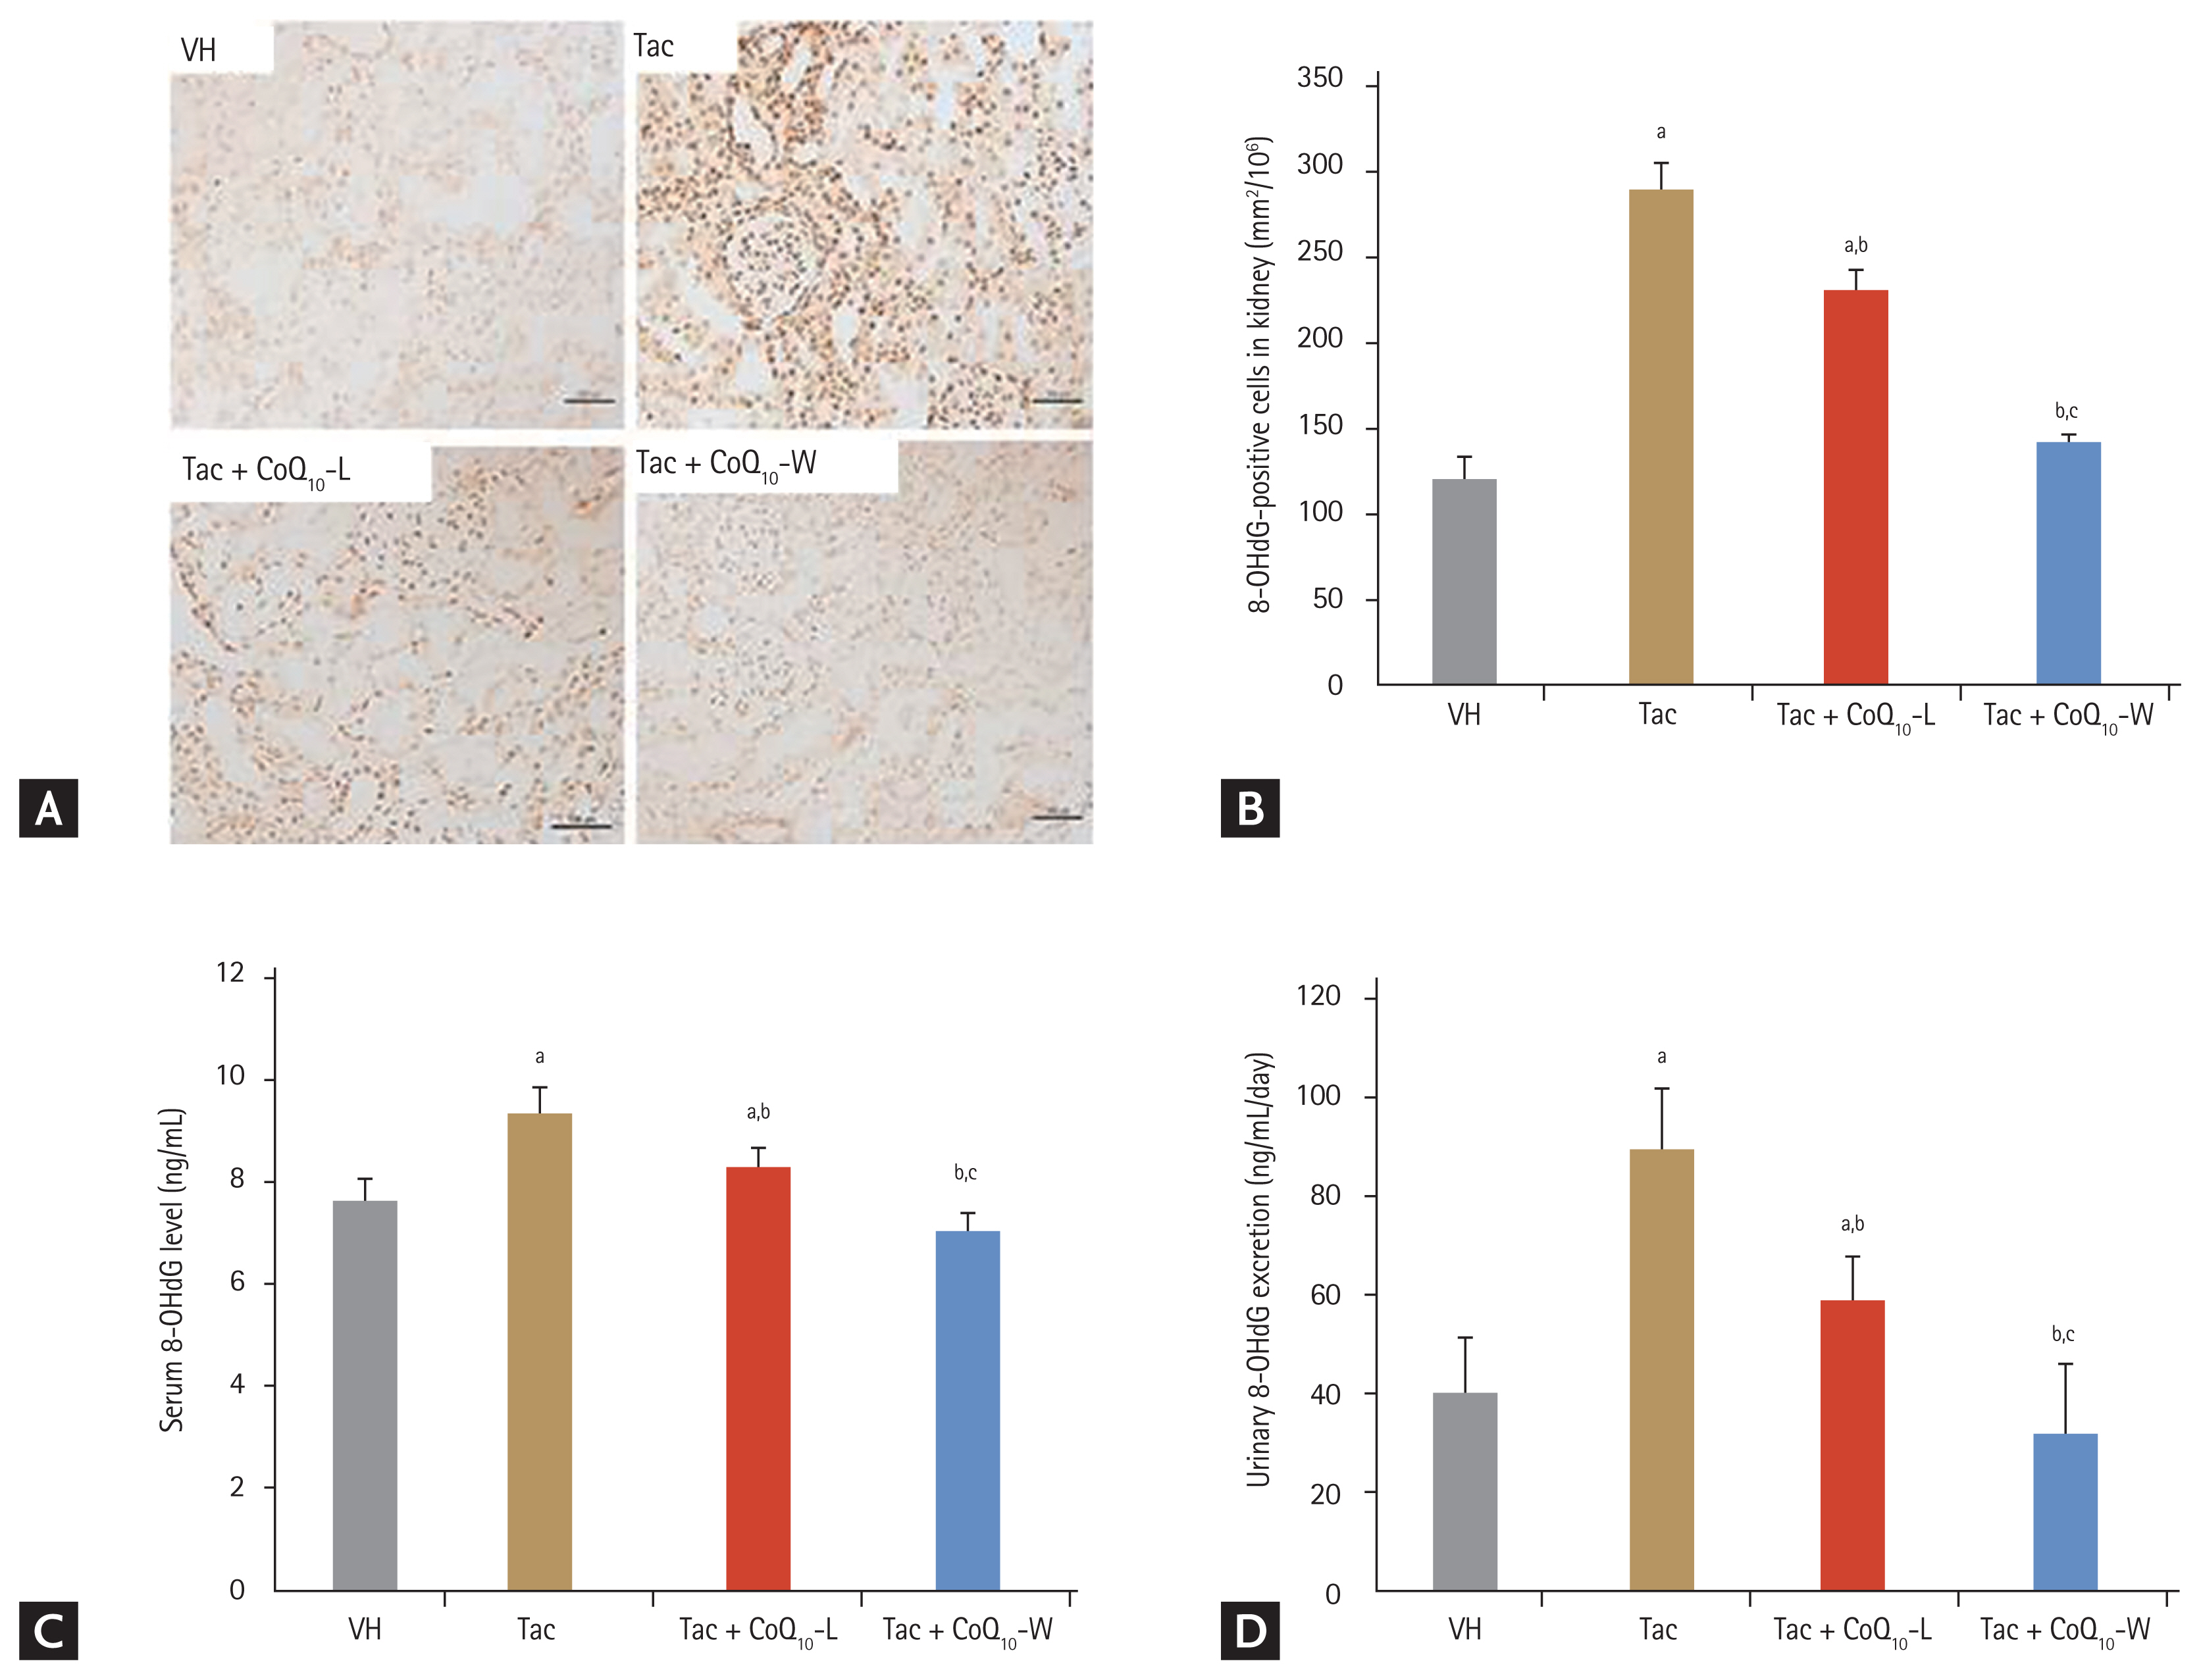
Comparison of the expression of 8-hydroxy-2′-deoxyguanosine (8-OHdG) between CoQ10-W and CoQ10-L in chronic tacrolimus (Tac) nephropathy. Representative photomicrographs of immunohistochemistry for 8-OHdG (A, B) using tissue sections from rats. Quantification of 8-OHdG level using the enzyme linked immunosorbent assay (ELISA) kit (C, D) using serum and urine from rats. Data are presented as the mean ± standard error (n = 9). Scale bar = 100 μm. One-way analysis of variance was used to analyze the data. VH, vehicle; CoQ10, coenzyme Q10; Tac + CoQ10-L, co-treatment with lipid-soluble coenzyme Q10; Tac + CoQ10-W, co-treatment with water-soluble coenzyme Q10. ap < 0.05 vs. the VH group, bp < 0.05 vs. the Tac group, cp < 0.05 vs. the Tac + CoQ10-L group.
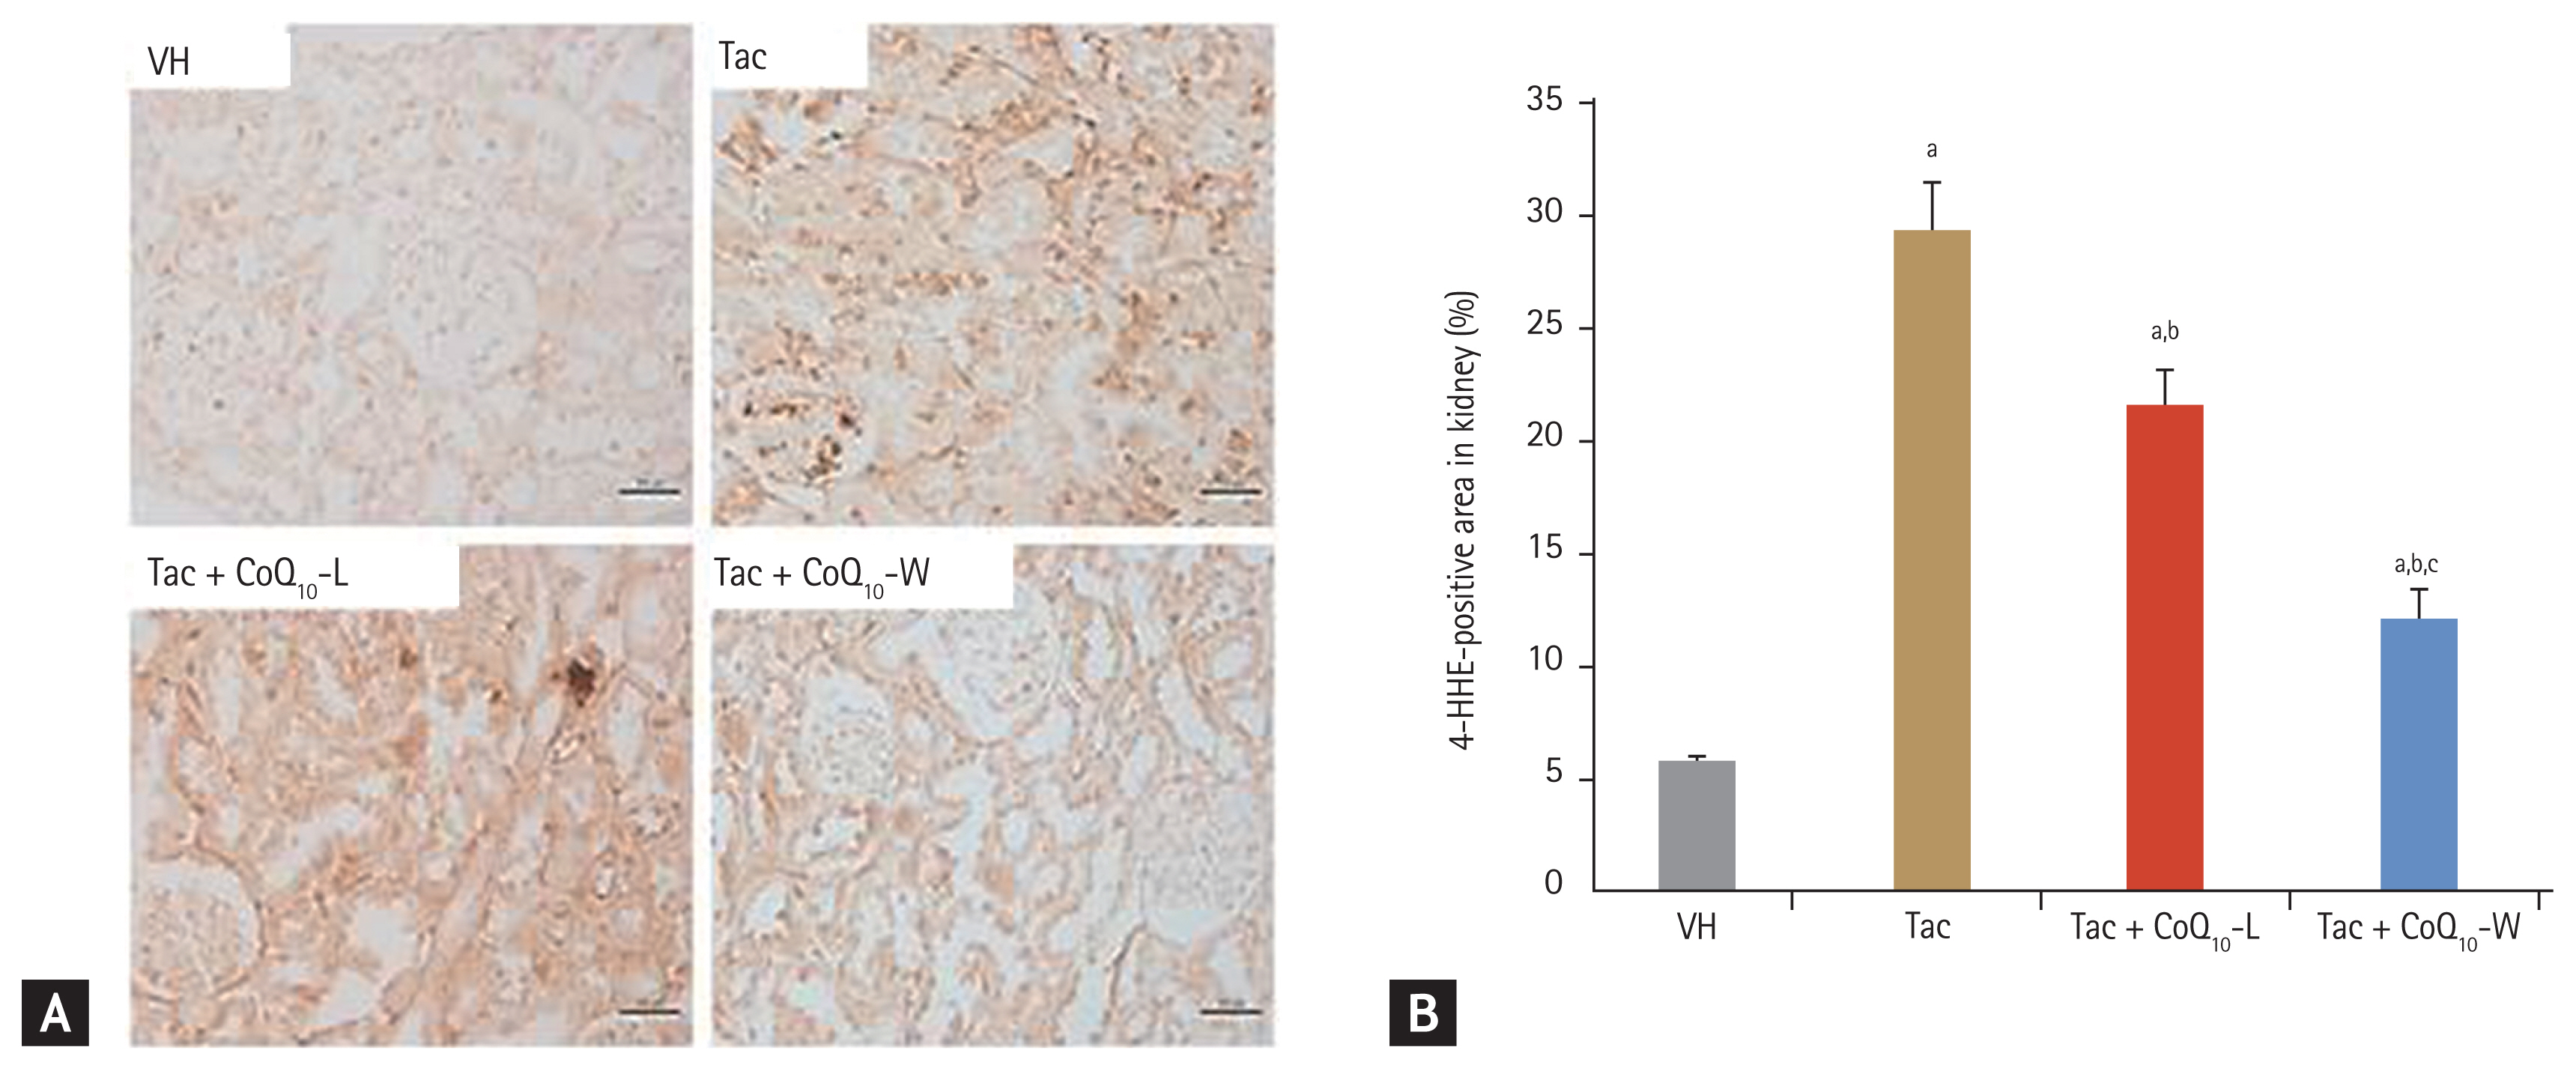
Comparison of the expression of 4-hydroxy-2-hexenal (4-HHE) between CoQ10-W and CoQ10-L in chronic tacrolimus (Tac) nephropathy. Representative photomicrographs of immunohistochemistry for 4-HHE in experimental groups (A) and semi-quantitative analysis (B). Data are presented as the mean ± standard error (n = 9). Scale bar = 100 μm. One-way analysis of variance was used to analyze the data. VH, vehicle; CoQ10, coenzyme Q10; Tac + CoQ10-L, co-treatment with lipid-soluble coenzyme Q10; Tac + CoQ10-W, co-treatment with water-soluble coenzyme Q10. ap < 0.05 vs. the VH group, bp < 0.05 vs. the Tac group, cp < 0.05 vs. the Tac + CoQ10-L group.
Comparison of anti-apoptotic effect between CoQ10-L and CoQ10-W in chronic Tac nephropathy
We evaluated the effects of CoQ10-L and CoQ10-W on Tac-induced apoptosis using TUNEL assay in tissue sections (Fig. 6A and 6B). The maximum number of TUNEL-positive cells was observed in the Tac group and the minimum in the VH group (15.2 ± 1.2 vs. 5 ± 0.1, respectively; p < 0.05 vs. VH group). As expected, the number of TUNEL-positive cells was reduced by co-treatment with CoQ10-L or CoQ10-W compared to that in the Tac group; however, Tac + CoQ10-W attenuated the number of TUNEL-positive cells much more than that by Tac + CoQ10-L (8.1 ± 0.3 mm2/104 vs. 11.7 ± 1.6 mm2/104, respectively; p < 0.05 vs. Tac + CoQ10-L group). At the molecular level, the expression levels of active caspase-3 and BAX were higher with Tac treatment than in the VH group as shown in Fig. 6C–6E. These levels were restored by co-treatment with CoQ10-L or CoQ10-W. Especially, CoQ10-W significantly reduced the expression of these proteins compared to that by CoQ10-L (active caspase-3, 112% ± 6% vs. 137% ± 9%, p < 0.05 vs. Tac + CoQ10-L group; BAX, 114% ± 7% vs. 158% ± 17%, p < 0.05 vs. Tac + CoQ10-L group).

Comparison of anti-apoptotic effect between CoQ10-W and CoQ10-L in chronic tacrolimus (Tac) nephropathy. Representative photomicrographs of immunohistochemistry for TdT-mediated dUTP nick-end labeling (TUNEL) in experimental groups (A) and semi-quantitative analysis (B). Arrows indicate the TUNEL positive cells. Immunoblot analysis of active caspase-3 and BCL2-associated X (BAX) (C, D, E). Data are presented as the mean ± standard error (n = 9). Scale bar = 100 μm. The relative optical densities of bands in each lane were normalized to each β-actin band from the same gel. One-way analysis of variance was used to analyze the data. Relative active caspase-3 and BAX are referenced to β-actin. VH, vehicle; CoQ10, coenzyme Q10; Tac + CoQ10-L, co-treatment with lipid-soluble coenzyme Q10; Tac + CoQ10-W, co-treatment with water-soluble coenzyme Q10. ap < 0.05 vs. the VH group, bp < 0.05 vs. the Tac group, cp < 0.05 vs. the Tac + CoQ10-L group.
Comparison of mitochondrial structure between CoQ10-L and CoQ10-W in chronic Tac nephropathy
We evaluated the effect of CoQ10 administration on Tac-induced mitochondrial ultrastructural changes in kidney tissue using electron microscopy to assess the size and the number of mitochondria (Fig. 7). Tac treatment decreased both average mitochondrial size (0.35 ± 0.01 μm2 vs. 0.57 ± 0.02 μm2, p < 0.05 vs. VH group) and number (0.46 ± 0.02 vs. 0.79 ± 0.04, p < 0.05 vs. VH group). However, co-treatment with CoQ10-L (size, 0.46 ± 0.02 μm2; number, 0.7 ± 0.04 μm2; p < 0.05 vs. Tac group) and CoQ10-W (size, 0.49 ± 0.01 μm2; number, 0.73 ± 0.09 μm2; p < 0.05 vs. Tac group) restored these changes compared with those by Tac alone (Fig. 7B and 7C).
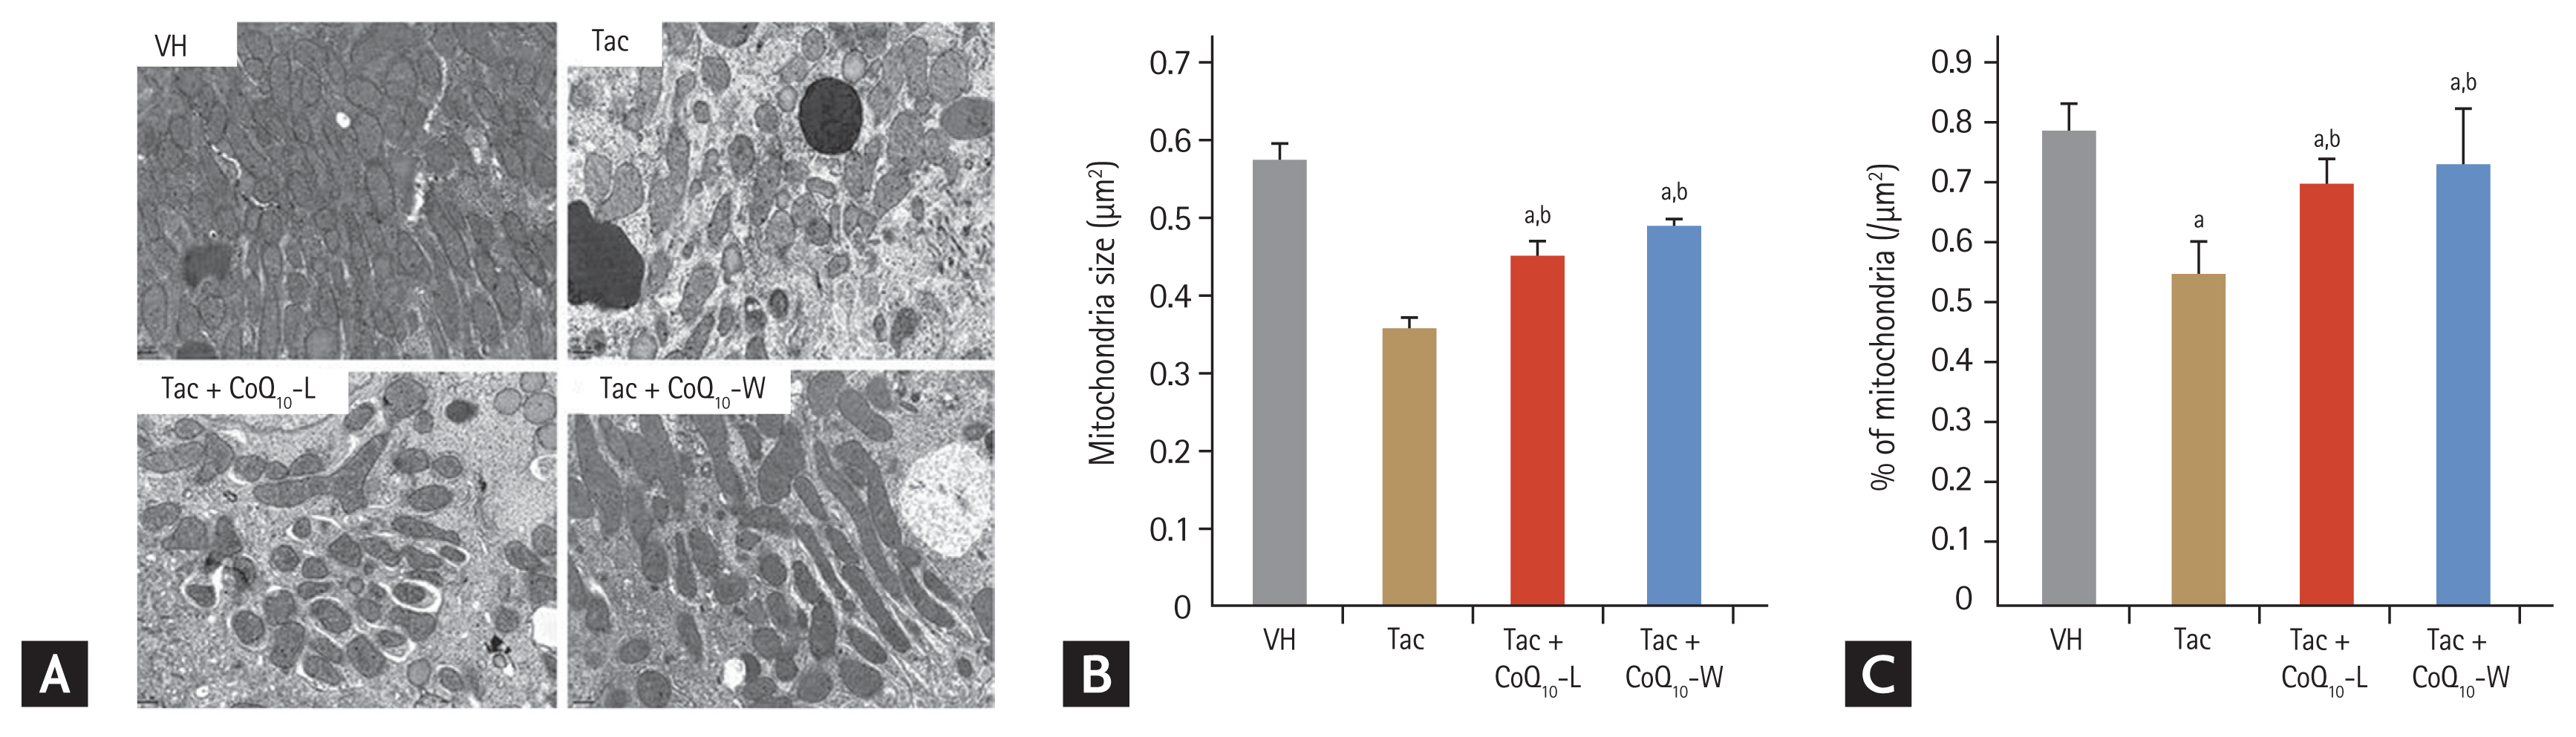
Comparison of mitochondrial structure between CoQ10-W and CoQ10-L in chronic tacrolimus (Tac) nephropathy. Representative images using transmission electron microscopy (A) and quantification (B, C) of electron microscopy. Scale bar = 500 nm. Data are presented as the mean ± standard error (n = 9). One-way analysis of variance was used to analyze the data. VH, vehicle; CoQ10, coenzyme Q10; Tac + CoQ10-L, co-treatment with lipid-soluble coenzyme Q10; Tac + CoQ10-W, co-treatment with water-soluble coenzyme Q10. ap < 0.05 vs. the VH group, bp < 0.05 vs. the Tac group.
Comparison of cell viability between CoQ10-L and CoQ10-W in Tac-induced HK-2 cell injury
Fig. 8 demonstrates the protective effect of CoQ10-L and CoQ10-W against cell injury during Tac treatment in the renal proximal tubule cell line, HK-2 cells. The different doses of Tac + CoQ10-L and Tac + CoQ10-W increased the cell viability of HK-2 cells by approximately 2.8 times compared with that in the Tac group. However, there was no significant difference in cell viability between the Tac + CoQ10-L and the Tac + CoQ10-W groups at the indicated doses.

Comparison of cell viability between CoQ10-L and CoQ10-W in tacrolimus (Tac)-induced human kidney 2 (HK-2) cell injury. Cell viability was evaluated by HK-2 assay. Data are presented as the mean ± standard error (n = 7). One-way analysis of variance was used to analyze the data. CoQ10, coenzyme Q10; Tac + CoQ10-L, co-treatment with lipid-soluble coenzyme Q10; Tac + CoQ10-W, co-treatment with water-soluble coenzyme Q10. ap < 0.05 vs. the Tac group.
Comparison of ROS production between CoQ10-L and CoQ10-W in Tac-induced HK-2 cell injury
Co-treatment with CoQ10-L or CoQ10-W reduced the Tac-induced MitoSOX Red fluorescence level, which is a marker for mitochondrial ROS; however, as shown in Fig. 9, no difference was observed in the protective level between CoQ10-L and CoQ10-W.
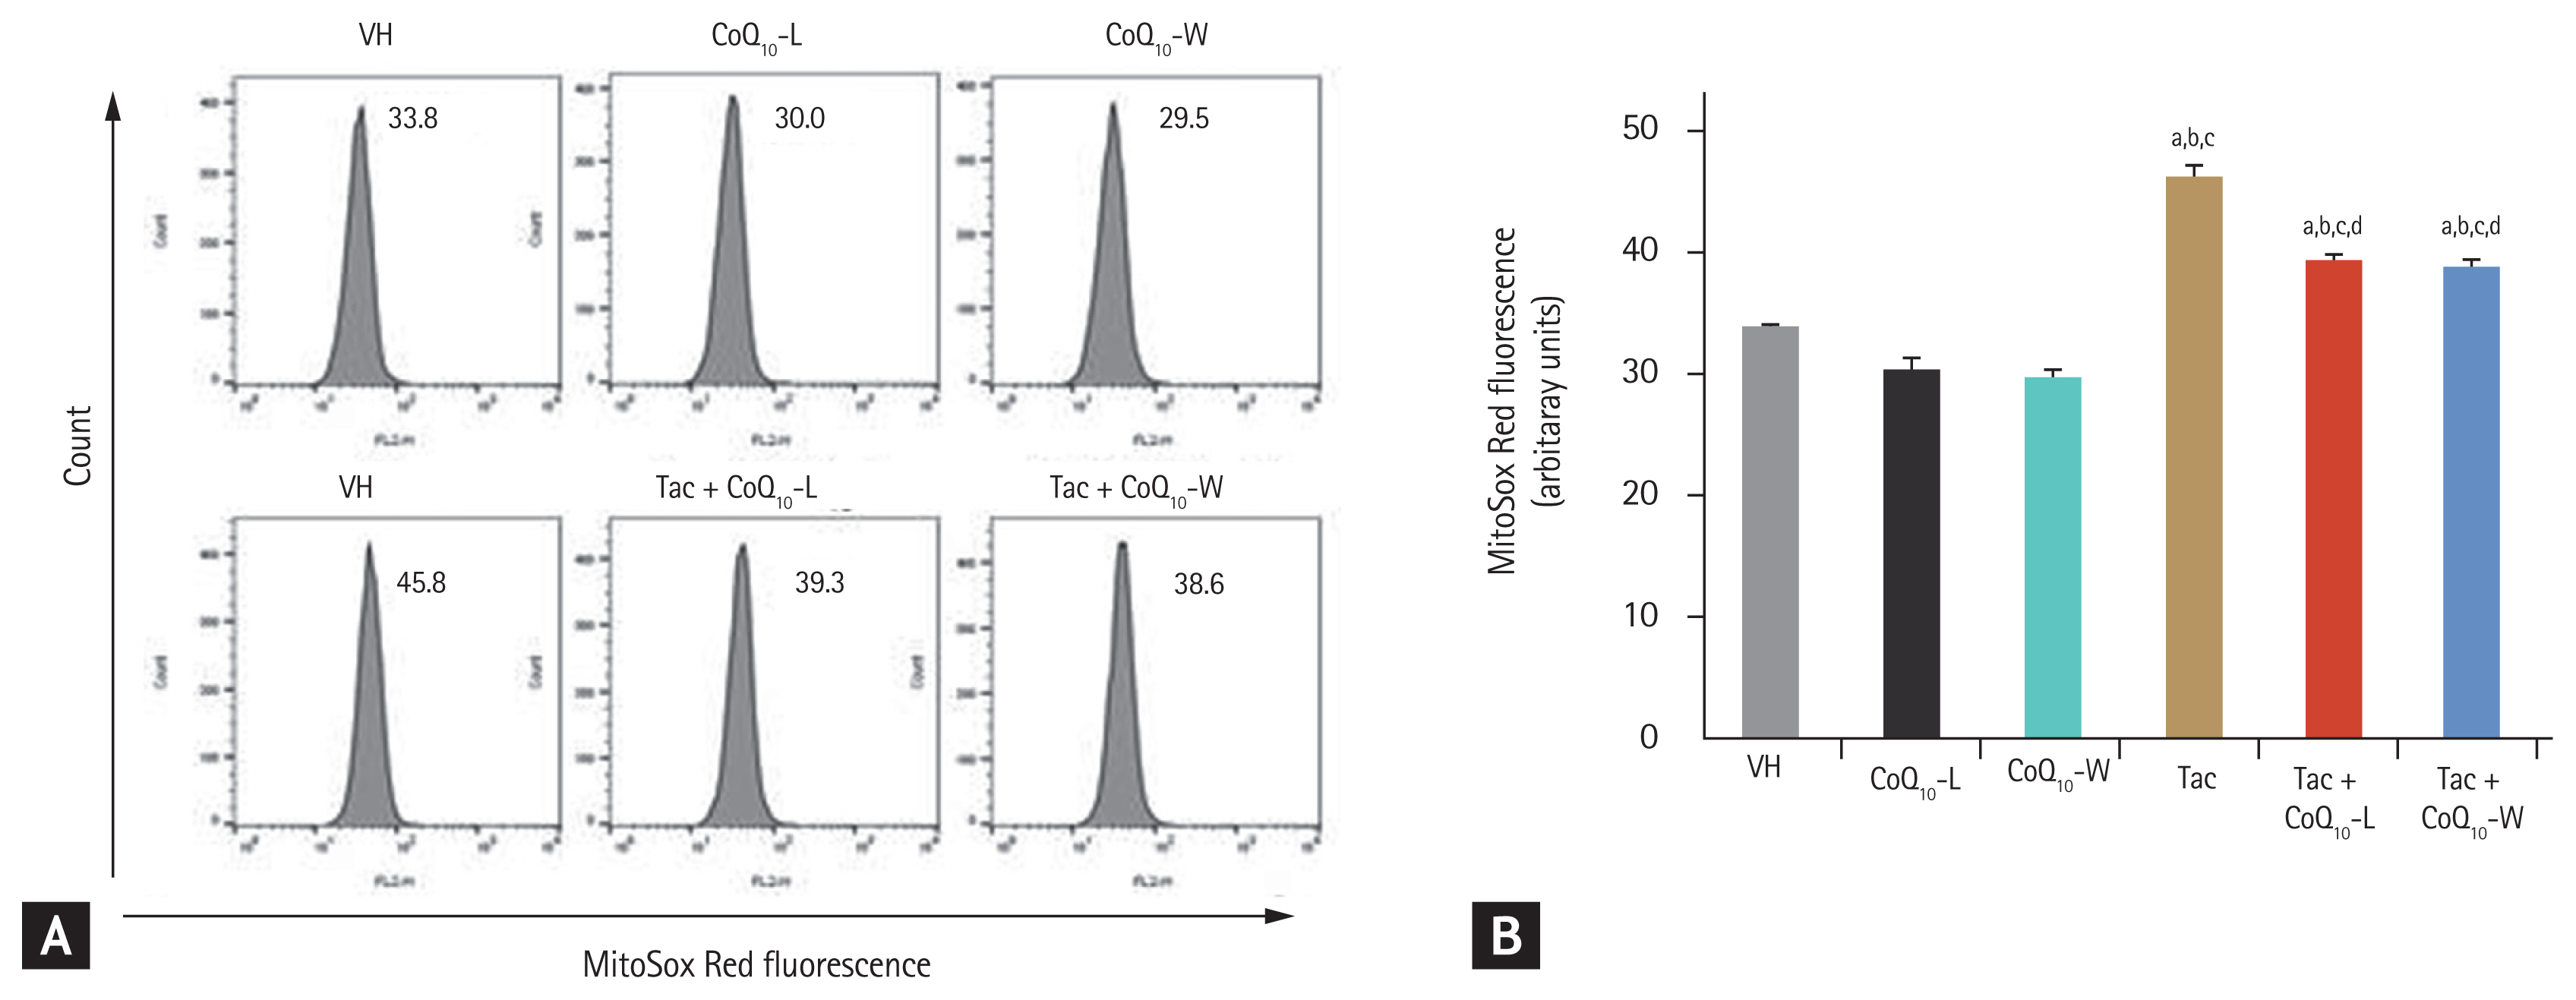
Comparison of reactive oxygen species (ROS) production between CoQ10-L and CoQ10-W in tacrolimus (Tac)-induced human kidney 2 (HK-2) cell injury. Intra cellular ROS production using a flow cytometer. MitoSOX Red was used as a probe to evaluate (A) intracellular ROS alterations in mitochondria (B) quantitative analysis of ROS production. Data are presented as the mean ± standard error (n = 9). One-way analysis of variance was used to analyze the data. VH, vehicle; CoQ10, coenzyme Q10; Tac + CoQ10-L, co-treatment with lipid-soluble coenzyme Q10; Tac + CoQ10-W, co-treatment with water-soluble coenzyme Q10. ap < 0.05 vs. the VH group, bp < 0.05 vs. the CoQ10-L group, cp < 0.05 vs. the CoQ10-W group, dp < 0.05 vs. the Tac group.
DISCUSSION
The hypothesis of our study was that improvement in bioavailability of CoQ10 may provide better protection against Tac-induced renal injury, and we compared the efficacy between CoQ10-W and CoQ10-L in an experimental model of chronic Tac nephropathy. The results of the study demonstrate that CoQ10-W increased renal function and histology better than CoQ10-L. In addition, addition of CoQ10-W reduced Tac-induced inflammation, oxidative stress, and apoptosis in the renal tissues more than that by CoQ10-L addition. These findings suggest that improved bioavailability of CoQ10-W may contribute to reducing Tac-induced nephropathy owing to its action as an anti-oxidative agent.
It is well known that oxidative stress and apoptosis are common mechanisms of Tac-induced nephropathy. To reveal the improvement in renal injury by CoQ10-W, we compared the antioxidant and anti-apoptotic effects between CoQ10-W and CoQ10-L in Tac-induced nephropathy. The results of our study clearly demonstrate that CoQ10-W reduced both Tac-induced markers of oxidative stress (8-OHdG in tissue, serum, and urine; 4-HHE in tissue) and Tac-induced apoptosis to a greater extent than CoQ10-L. These findings confirm that CoQ10-W has better antioxidant and anti-apoptotic effects than CoQ10-L on Tac-induced renal injury, and this may explain the better protection of CoQ10-W than CoQ10-L.
We previously reported the efficacy of CoQ10-W in Tac-induced diabetes mellitus [23], and this study extended the evaluation of this effect to Tac-induced renal injury. The results of our study clearly demonstrate that CoQ10-W significantly improved renal function and histopathological parameters compared to that with CoQ10-L in a rat model of Tac-induced renal injury. This finding suggests that CoQ10-W is a more effective antioxidant than CoQ10-L, and this is related to the increased bioavailability of CoQ10-W as shown in plasma CoQ10 levels (Fig. 1A). However, kidney tissue CoQ10 levels were not significantly different in the two groups. Thus, the improved renal function and histopathology in the CoQ10-W group compared with that in the CoQ10-L group seems to be related to a systemic antioxidant effect.
Oxidative stress is closely related to the quantity and quality of mitochondria [24,25]. High-quality mitochondria protect cells against oxidative stress and prevent apoptosis. In our study, CoQ10-W and CoQ10-L both increased the number and area of mitochondria in cells in comparison with that seen in the Tac group, but there was no significant difference. Therefore, while we cannot clearly demonstrate the reason, we speculate that the subcellular effects of CoQ10-W are not significantly different from those of CoQ10-L owing to a similar CoQ10 renal content level as shown in Fig. 1B.
According to the previous report [5], the CoQ10 level responded in a CoQ10 dose dependent manner. Therefore, increasing doses of conventional lipid soluble-CoQ10 has been thought to be better than newly developing formulation of CoQ10. However, a study reported that in rats, only 3% of orally administered lipid soluble CoQ10 was absorbed [8]. Due to its lack of solubility, therapeutic application of lipid soluble CoQ10 are limited by its poor bio-availability. In particular, water-soluble CoQ10 formulation not lipid-soluble CoQ10 may increase the mitochondrial content of CoQ10 in order to improve their bioenergetics parameter [5]. Therefore, development of water-soluble formulation of CoQ10 has potentially benefit on disorders related to mitochondrial dysfunctions.
Our study has some limitations. First, there was no difference between CoQ10-W and CoQ10-L of the CoQ10 level in the kidney tissue. In vitro experiments also showed similar time and dose-response protective effect in a cell viability and mitochondrial ROS level in the cellular level between these two groups. Therefore, follow-up study is required to improve the action of CoQ10-W at the cellular level. Second, CoQ10 is known as the endogenous substances that follows the circadian rhythm [26]. In this study, we examined the CoQ10 levels at the end of the experimental period. For more accurate estimate of CoQ10 level, pharmacokinetic and pharma co-dynamic studies are needed to determine whether CoQ10-W has better bioavailability than CoQ10-L. Third, CoQ10-W consist of EPA for consistent nano-emulsion. Therefore, there is a possibility that the anti-inflammatory effect of EPA may be overlapped with that of CoQ10-W. Regarding this, we previously tested the anti-inflammatory effect of EPA in a rheumatoid arthritis animal model, and found that EPA in nano-emulsion has not affected the anti-inflammatory effect of CoQ10 (data not shown). Thus, the anti-inflammatory effect of EPA in nano-emulsion may be ruled out in the present study.
In summary, the improved CoQ10 bioavailability using CoQ10-W may provide more benefit than conventional CoQ10 in Tac-induced renal injury. Thus, CoQ10-W supplementation may be beneficial in patient prescribed Tac following renal transplantation.
KEY MESSAGE
1. Water-soluble coenzyme Q10 (CoQ10) improves renal function and histopathology compared to that with conventional lipid-soluble CoQ10 in chronic tacrolimus (Tac) nephropathy.
2. Water-soluble CoQ10 reduces oxidative stress more effectively than lipid-soluble CoQ10 in chronic Tac nephropathy.
3. Treatment with a combination of water-soluble CoQ10 and Tac provides effective protection against Tac-induced renal injury.
Notes
Conflict of interest
No potential conflict of interest relevant to this article was reported.
Acknowledgements
This study was supported by grants from the Korean Health Technology R&D Project, Ministry for Health & Welfare, Republic of Korea (HI14C3417), the Bio & Medical Technology Development Program of the National Research Foundation (NRF), and the Korean government (MSIT) (NRF-2019M3A9A8064802).