Nicotine exacerbates tacrolimus-induced renal injury by programmed cell death
Article information

Abstract
Background/Aims
Cigarette smoking is an important modifiable risk factor in kidney disease progression. However, the underlying mechanisms for this are lacking. This study aimed to assess whether nicotine (NIC), a major toxic component of cigarette smoking, would exacerbates tacrolimus (TAC)-induced renal injury.
Methods
Sprague-Dawley rats were treated daily with NIC, TAC, or both drugs for 4 weeks. The influence of NIC on TAC-caused renal injury was examined via renal function, histopathology, oxidative stress, mitochondria, endoplasmic reticulum (ER) stress, and programmed cell death (apoptosis and autophagy).
Results
Both NIC and TAC significantly impaired renal function and histopathology, while combined NIC and TAC treatment aggravated these parameters beyond the effects of either alone. Increased oxidative stress, ER stress, mitochondrial dysfunction, proinflammatory and profibrotic cytokine expressions, and programmed cell death from either NIC or TAC were also aggravated by the two combined.
Conclusions
Our observations suggest that NIC exacerbates chronic TAC nephrotoxicity, implying that smoking cessation may be beneficial for transplant smokers taking TAC.
INTRODUCTION
Despite the discovery of new immunosuppressants, tacrolimus (TAC) remains the cornerstone of immunosuppressive regimens in solid organ transplantation. However, long-term use of TAC increases the risk of adverse effects (e.g., nephrotoxicity, neurotoxicity, infections, malignancies, diabetes, and gastrointestinal complaints) [1]. Among these, acute kidney injury or chronic TAC nephrotoxicity has been reported in 46% of lung transplant recipients [2] and 22.4% of kidney transplant recipients [3]. While acute kidney injury is considered reversible after TAC dose reduction or complete withdrawal, chronic nephrotoxicity, which leads to allograft loss, is irreversible. Chronic TAC nephrotoxicity is characterized by glomerulopathy, hyalinosis of afferent arterioles, and striped tubulointerstitial fibrosis (TIF) [4]. Although the exact mechanism of this clinical dilemma remains unknown, we recently demonstrated that oxidative stress-originated inflammation, transforming growth factor β1 (TGF-β1), and programmed cell death may be important players [5].
Cigarette smoking is a critical public health challenge and societal financial burden which reduces quality of life. Epidemiological reports show that there are currently more than one billion cigarette smokers worldwide and six million deaths annually owing to tobacco use. These rates are both increasing, particularly in developing or undeveloped countries [6]. It is well recognized that cigarette smoking is a risk factor for various cancer types, cardiovascular events (myocardial infarction and stroke), and obstructive lung diseases. In the kidney, smoking increases renal dysfunction severity in patients with diabetes, hypertension, polycystic kidney disease, and post-kidney transplant [7]. Moreover, smoking may also cause de novo kidney damage even in a healthy population without pre-existing chronic kidney disease (CKD) [8].
This study sought to evaluate: (1) whether nicotine (NIC), a primary toxic component of cigarette smoking, aggravates TAC-induced renal injury; and, if so, (2) which mechanism accounts for NIC-accelerated nephrotoxicity.
METHODS
Experimental schedule and treatment
The protocol of the experimental study was approved by the Animal Care Committee of the Yanbian University of China (SYXK [J]2020-0009; YBU-2018-045). A total of 32 male Sprague-Dawley rats (Yanbian, China) weighing 200 to 220 g were housed in individual cases in a temperature- and light-controlled environment and allowed free access to a low-salt diet (0.05% sodium; Teklad Premier, Madison, WI, USA) and tap water. TAC was diluted in olive oil (Sigma, St. Louis, MO, USA) to a final concentration of 1.5 mg/mL.
Following a 1-week acclimatization period on a low-salt diet, weight-matched rats were randomized into four subgroups and treated daily for 4 weeks with: (1) subcutaneous injection with olive oil (vehicle [VH] group, n = 8, 1 mL/kg); (2) simultaneous treatment with olive oil and NIC (NIC group, n = 8, 1.5 mg/kg; intraperitoneal, n = 8); (3) subcutaneous injection with TAC (TAC group, n = 8, 1.5 mg/kg); (4) simultaneous treatment with a combination of NIC and TAC (NIC + TAC group, n = 8). TAC (Prograf, Astellas Pharma, Ibaraki, Japan) and NIC (Sigma-Aldrich) doses were based on previous studies [9,10].
Antibodies
The antibodies used in this study for immunohistochemistry and immunoblotting were as follows: TGF-β1 (R&D Systems, Minneapolis, MN, USA), connective tissue growth factor (CTGF, #ab125943, Abcam, Cambridge, UK), TGF-β inducible gene-h3 (βig-h3, Proteintech, Chicago, IL, USA), ectodermal dysplasia-1 (ED-1, Serotec Inc., Oxford, UK), monocyte chemotactic protein-1 (MCP-1, Santa Cruz Biotechnology, Dallas, TX, USA), interleukin-1beta (IL-1β, #ab9722, Abcam), interleukin 18 (IL-18, #ab191152, Abcam), NOD-like receptor pyrin domain-containing protein 3 (NLRP3, #ab214185, Abcam), superoxide dismutase 1 (SOD1, #ab16831, Abcam), superoxide dismutase 2/manganese superoxide dismutase (SOD2/MnSOD, #ab13534, Abcam), NADPH oxidase-2 (NOX-2, #ab31092, Abcam), NADPH oxidase-4 (NOX-4, #ab109225, Abcam), B-cell lymphoma-2 (Bcl-2, #ab59348, Abcam), Bcl2-associated X (Bax, #ab32503, Abcam), cleaved caspase-3 (Millipore, Billerica, MA, USA), p62 (#ab56416, Abcam), light chain 3B (LC3B, #ab192890, Abcam), Parkin (#2132, Cell Signaling, Danvers, MA, USA), phosphate and tension homology deleted on chromsome ten-induced kinase 1 (PINK1, N4/15, #ab186303, Abcam), optic atrophy protein 1 (OPA1, #ab42364, Abcam), dynamin-related protein 1 (DLP1/Drp1, BD Transduction Laboratories, Lexington, KY, USA), C/EBP homologous protein (CHOP, L63F7, #2895, Cell Signaling), binding immunoglobulin protein (BiP, C50B12, Rabbit mAb, #3177, Cell Signaling), inositol-requiring protein-1α (IRE-1α, phospho S724, #ab48187, Abcam), activating transcription factor 6 (ATF-6, D4Z8V, Rabbit mAb, #65880, Cell Signaling), and β-actin (#ab8226, Abcam).
Renal function
Before sacrifice, animals were housed individually in metabolic cages (ZH-B6, Anhui Zhenghua Biological Instrument Equipment, Anhui, China) for water intake measurement and 24-hour urine volume (UV) collection. On the following day, animals were anesthetized, and blood samples were withdrawn for further analysis. Serum creatinine (Scr), blood urea nitrogen (BUN), and cystatin C (Cys-C) were measured using a quantitative enzymetic colorimetric method (Roche Cobas 8000 Core ISE, Roche Diagnostics, Basel, Switzerland).
Miscellaneous measurements
After the treatment was initiated, rats were pair-fed and their body weight (BW) was monitored daily. Systolic blood pressure (SBP) was recorded in conscious rats by the tail-cuff method with plethysmography using a tail manometer-tachometer system (XR900, Shanghai XinRuan Information Technology Co. Ltd., Shanghai, China). At least three readings were averaged for each rat. Urine protein was measured by the enzymatic colorimetric method (Modular DPP system, Roche, Hamburg, Germany). Whole-blood TAC level was measured using liquid chromatography mass spectrometry/mass-spectrometry.
Histopathology
Kidney specimens were preserved by in vivo perfusion. Rats were perfused using 0.01 mol/L phosphate-buffered saline (PBS) to flush blood via the abdominal aorta, and dissected kidneys were rapidly immersed in periodate-lysine-2% paraformaldehyde solution and embedded in wax. After dewaxing, 4-μm sections were processed and stained with periodic acid-Schiff (PAS) or Masson’s trichrome and hematoxylin. Glomerular injury (fractional mesangial area) and TIF were assessed in PAS or trichrome stained sections and quantified by a color image auto-analyzer (VHX-7000, Leica Microsystems, Wetzlar, Germany), as we previously described [11,12].
Immunohistochemistry
Following dewaxing, sections were incubated with 0.5% Triton X 100/PBS solution for 30 minutes and washed with PBS three times. Non-specific binding sites were blocked with normal horse serum diluted 1:10 in 0.3% bovine serum albumin for 30 to 60 minutes, and then incubated for 2 hours at 4°C in mouse antiserum against ED-1 diluted in 1:1,000 in humid environment. After rinsing in tris-buffered saline (TBS), sections were incubated in peroxidase-conjugated rabbit anti-mouse immunoglobulin G (IgG, Amersham Pharmacia Biotech, Piscataway, NJ, USA) for 30 minutes. For coloration, sections were incubated with a mixture of 0.05% 3,3′-diaminobenzidine containing 0.01% H2O2 at room temperature until a brown color was visible, washed with TBS, counterstained with hematoxylin and examined under light microscopy. Analysis of ED-1-positive cells was examined automatically by counting the percentage of positive areas in each section of twenty nonoverlapping fields using a color image auto-analyzer (VHX-7000, Leica Microsystems).
Transmission electron microscopy
Kidney tissues were post-fixed with 1% osmium tetroxide-N-methylmorpholine N-oxide (OSO4) and embedded in Epon 812 following fixation in 2.5% glutaraldehyde in 0.1 M phosphate buffer. Ultrathin sections were cut and stained with uranyl acetate/lead citrate, and photographed with a JEM-1400 Flash transmission electron microscope (JEM-1400 Flash HC, JEOL Ltd., Tokyo, Japan).
Immunoblotting analysis
Immunoblot analysis was performed as described previously [9]. Briefly, renal tissue lysates were incubated with specific antibodies, and immunoblotting images analyses were performed using an image analyzer (Odyssey CL Imaging System, LI-COR Biosciences, Lincoln, NE, USA). Optical densities were obtained using the VH group as 100% reference and normalized with β-actin.
In situ TUNEL assay
Apoptosis in tissue sections was identified using the ApopTag in situ apoptosis detection kit (Sigma-Aldrich). The number of TdT-mediated dUTP-biotin nick end labeling (TUNEL)-positive cells was counted on 20 randomly selected non-overlapping fields in each section at ×200 magnification (VHX-7000, Leica Microsystems).
Enzyme-linked immunosorbent assay
The levels of 8-hydroxy-2′-deoxyguanosine (8-OHdG) were evaluated using a competitive enzyme-linked immunosorbent assay (ELISA) to determine the levels of DNA adduct 8-OHdG in serum and urine (Japan Institute for the Control of Aging, Shizuoka, Japan).
Serum and urine concentrations of cotinine, a stable NIC metabolite, were evaluated using commercial ELISA kits (Calbiotech, San Diego, CA, USA) according to the manufacturer’s instructions.
Statistical analysis
The dates are expressed as mean ± standard error. Multiple comparisons among groups were fulfilled by one-way analysis of variance (ANOVA) with the Bonferroni post hoc test (SPSS software version 21.0, IBM, Armonk, NY, USA). Statistical significance was accepted as p < 0.05.
RESULTS
Effect of NIC on basic parameters
Table 1 outlines the effects of NIC on basic parameters in the experimental groups. Both NIC and TAC increase UV (polyuria), which was further increased by NIC and TAC treatment. Neither NIC nor TAC prevented BW loss. Urine protein excretion, Scr, BUN, and Cys-C were markedly higher in both the NIC and TAC groups compared with the VH group; these levels further increased with combination of the two drugs, implying that NIC accelerates TAC-induced renal dysfunction. There were no significant between-group SBP differences. Four-week TAC treatment increased blood TAC concentration to 11.0 ± 0.9 ng/mL, while NIC did not influence blood TAC concentration (12.8 ± 1.5 ng/mL, p > 0.05 vs. TAC). In addition, treating normal rats with NIC resulted in serum and urine cotinine concentration increases by 56.5 ± 1.7 ng/mL and 856 ± 192.6 μg/day, respectively. These serum and urine cotinine concentrations mimics those observed in humans who are active smokers [13].

Effect of NIC on functional parameters
Effect of NIC on histopathology in chronic TAC nephrotoxicity
Chronic TAC nephrotoxicity is characterized by unique histological features includes striped TIF and glomerulopathy. By histological staining and electron microscopy, we found that TAC-caused glomerular injury is manifested by glomerular basement thickening and effacement of podocyte foot processes (Fig. 1A, 1C, and 1D), this may link to increment urine protein excretion. On quantitative analyses, both NIC and TAC increased the fractional mesangial area, with further increase observed in the NIC and TAC group. The major changes in chronic TAC nephrotoxicity were confined to tubulointerstitium areas, as delineated by tubulointerstitial fibrous deposition, tubular atrophy, and striped fibrosis (Fig. 1B, 1E, and 1F). Figures clearly show that the TIF score in the NIC + TAC group was higher than in either the NIC group or the TAC group.
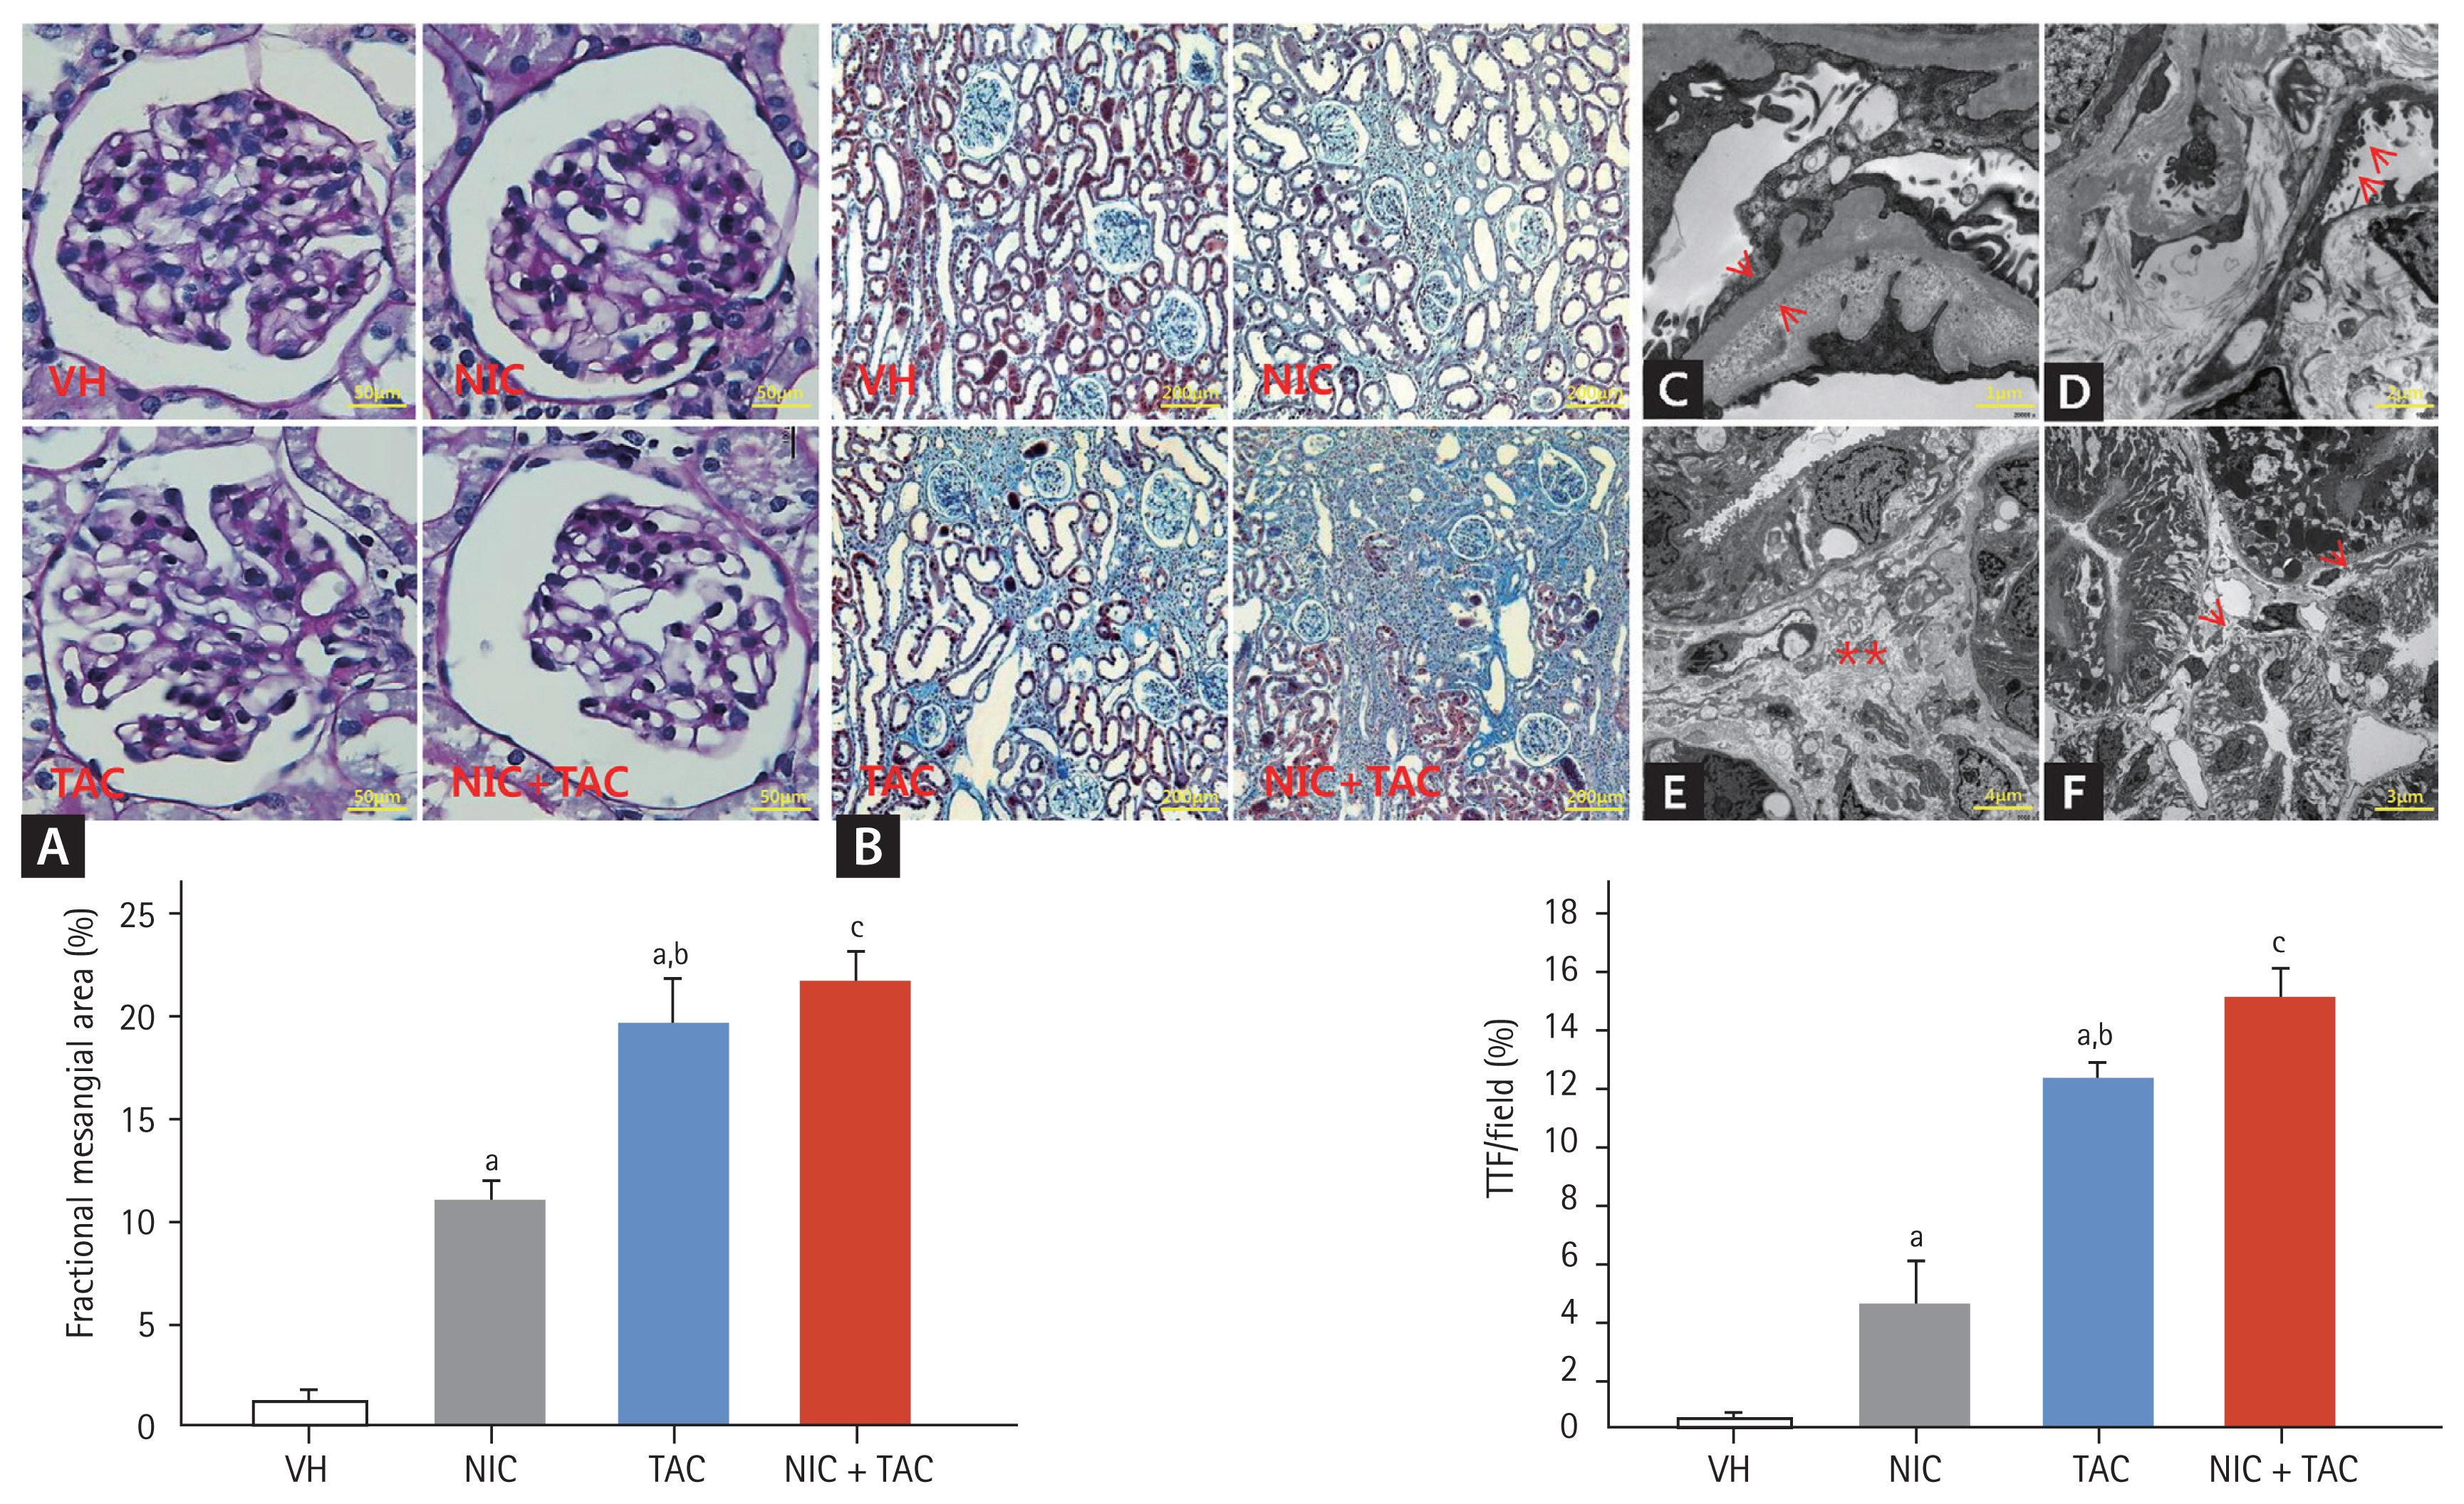
Representative photomicrographs of periodic acid-Schiff (PAS) (A), Masson trichrome (B), transmission electron microscopy (C–F), and quantitative analysis of glomerular injury and tubulointerstitial fibrosis (TIF): (C) glomerular basement membrane thickening (arrows); (D) effacement of podocyte foot processes (arrows); (E) swelling of the tubulointerstitium and extensive collagen deposition (scatters); (F) atrophied tubules (arrows). VH, vehicle; NIC, nicotine; TAC, tacrolimus. ap < 0.01 vs. VH, bp < 0.05 vs. NIC, cp < 0.05 vs. TAC or NIC.
Effect of NIC on profibrotic cytokine expression in chronic TAC nephrotoxicity
The present study sought to compare the expression of the profibrotic cytokine TGF-β1 and CTGF, and the extracellular matrix (ECM) component of βig-h3 between the experimental groups. Consistent with the TIF findings, NIC augmented TAC-induced overexpression of pro-fibrotic TGF-β1 and CTGF and ECM βig-h3 (Fig. 2).
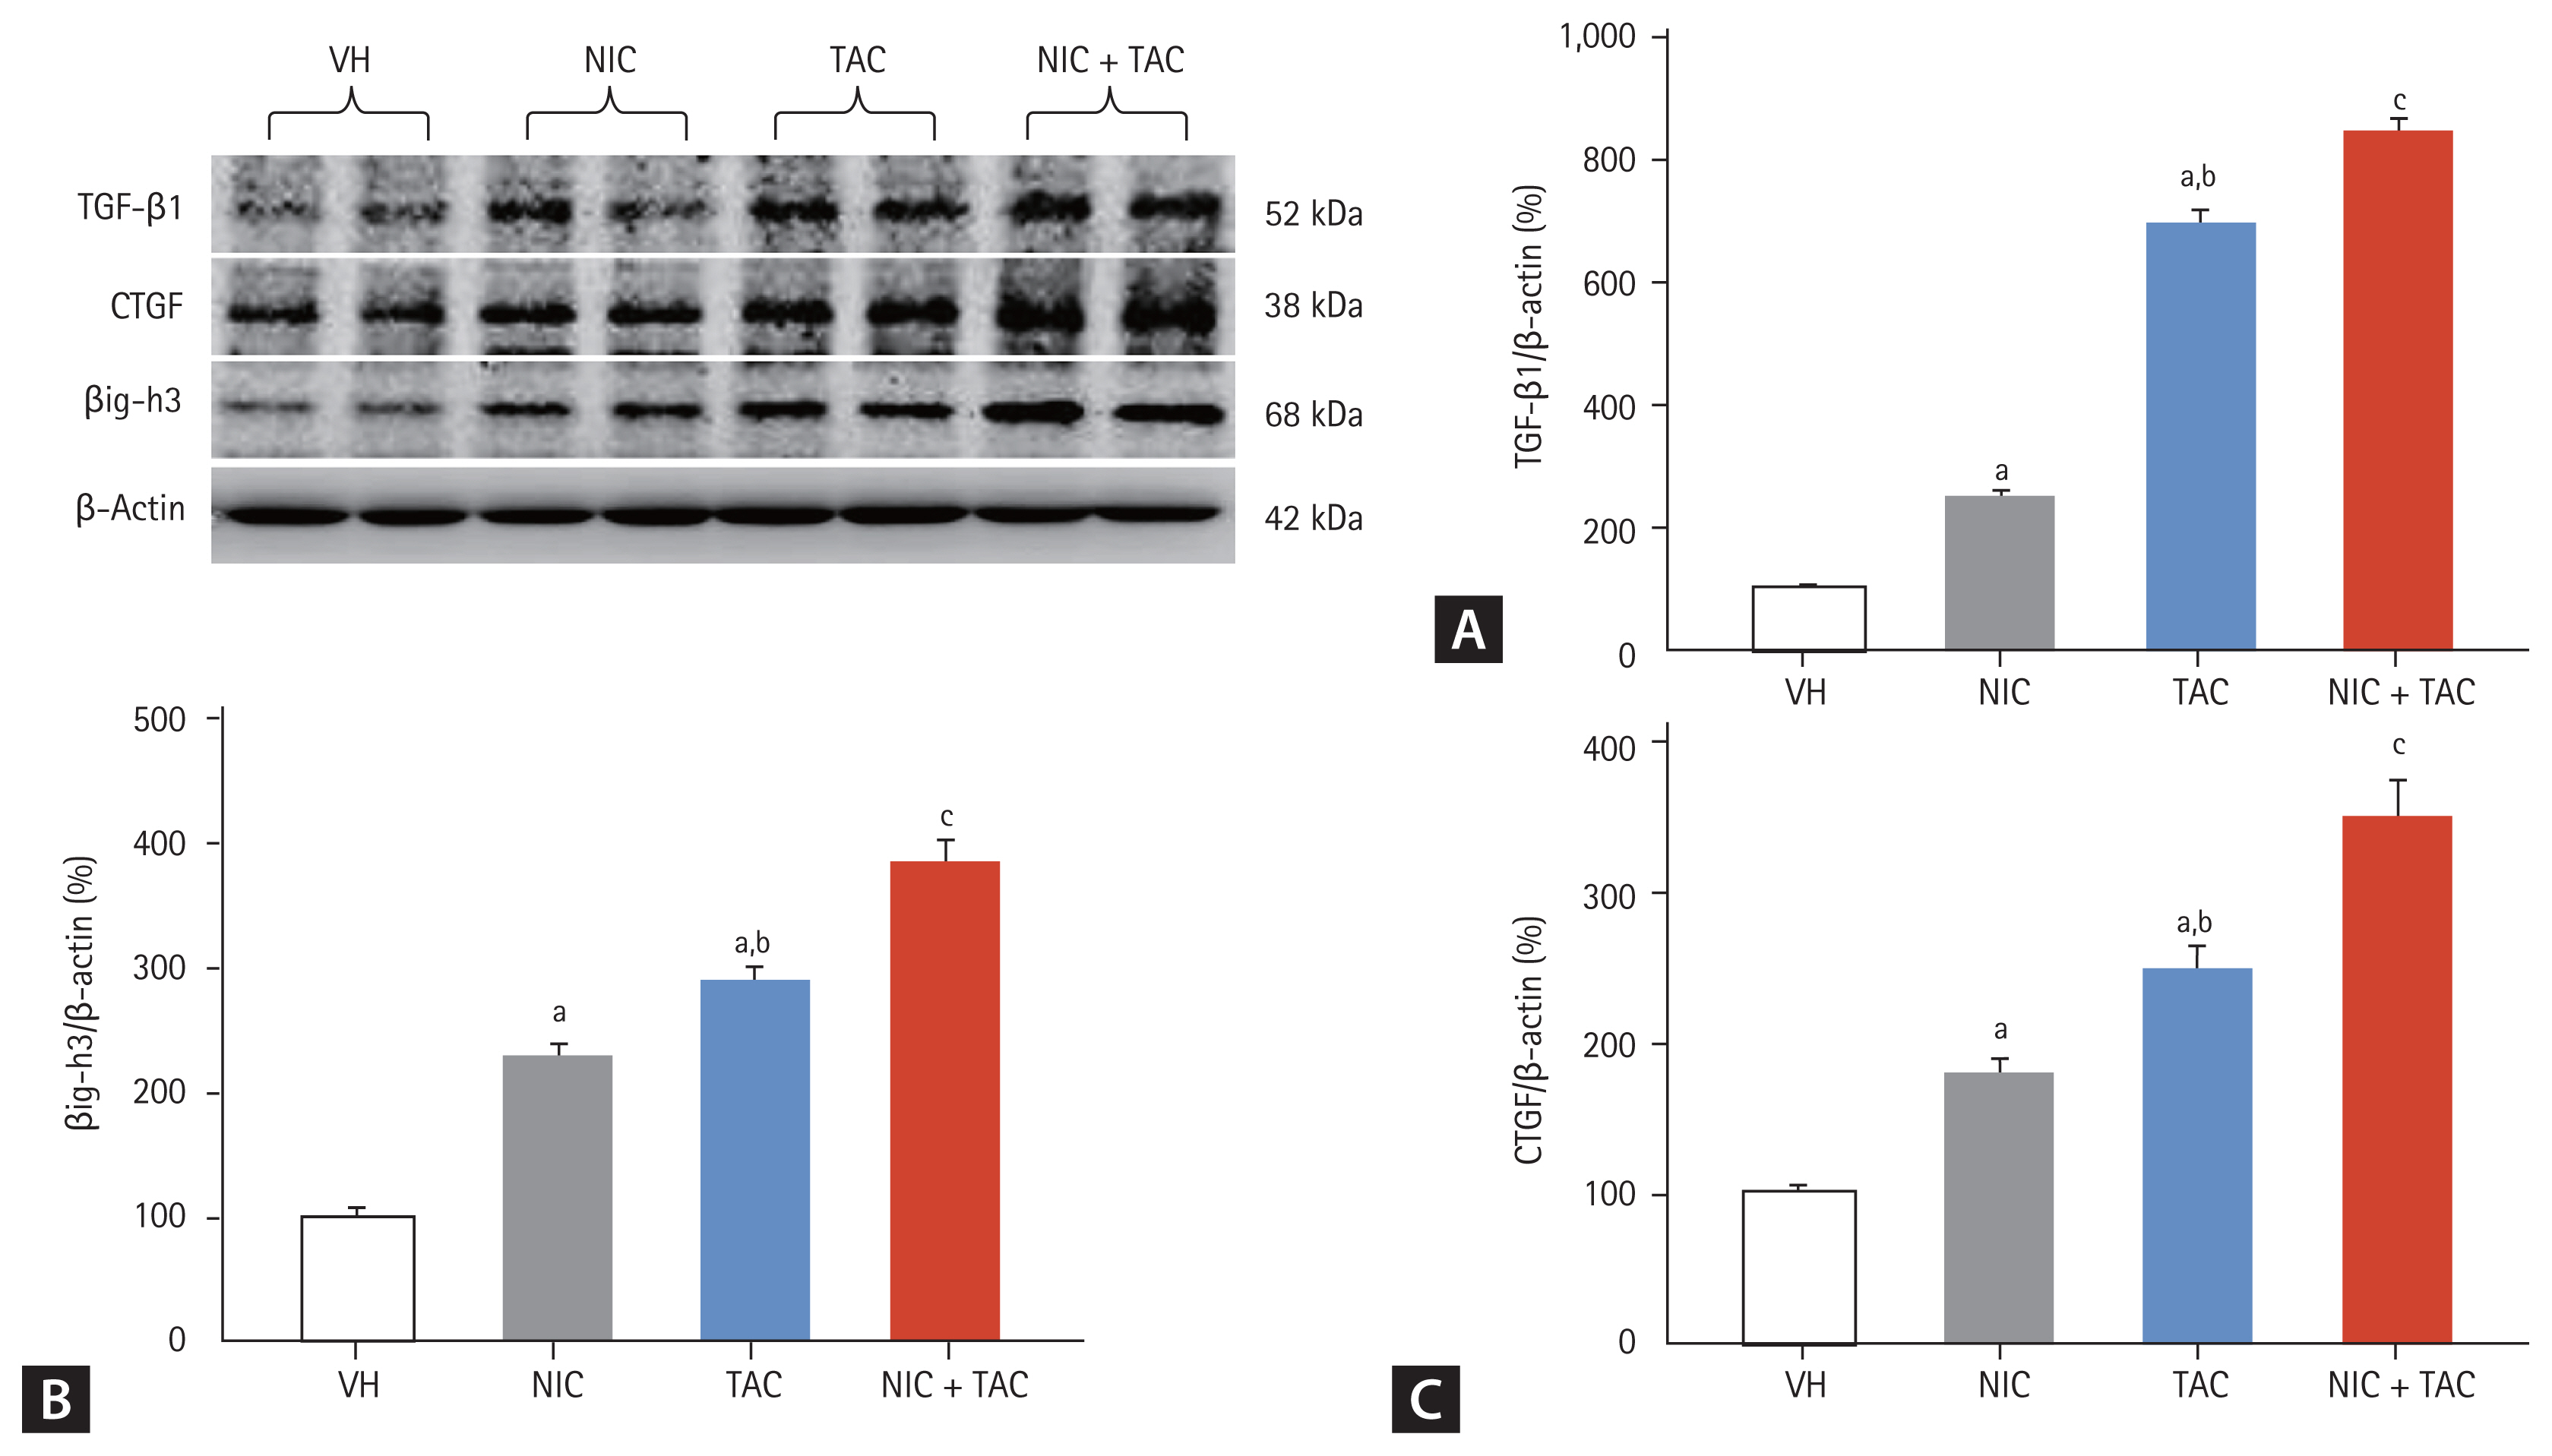
Representative photomicrographs of immunoblotting analysis for (A) transforming growth factor β1 (TGF-β1), (B) TGF-β-induced gene-h3 (βig-h3), and (C) connective tissue growth factor (CTGF). Values for protein expression are represented using the vehicle (VH) group as 100% reference and normalized to β-actin. NIC, nicotine; TAC, tacrolimus. ap < 0.01 vs. VH, bp < 0.05 vs. NIC, cp < 0.05 vs. TAC or NIC.
Effect of NIC on inflammation in chronic TAC nephrotoxicity
To define the effect of NIC on inflammation in TAC-induced renal injury, we studied the expression of proinflammatory mediators and pyroptosis-related genes by immunoblotting and immunohistochemistry. Fig. 3 showed that TAC treatment upregulated expression of pyroptosis-related cytokines (IL-1β, IL-18, and NLRP3) and MCP-1, resulted in ED-1-positive cell infiltration, and further increases were found by a combined treatment of NIC and TAC.
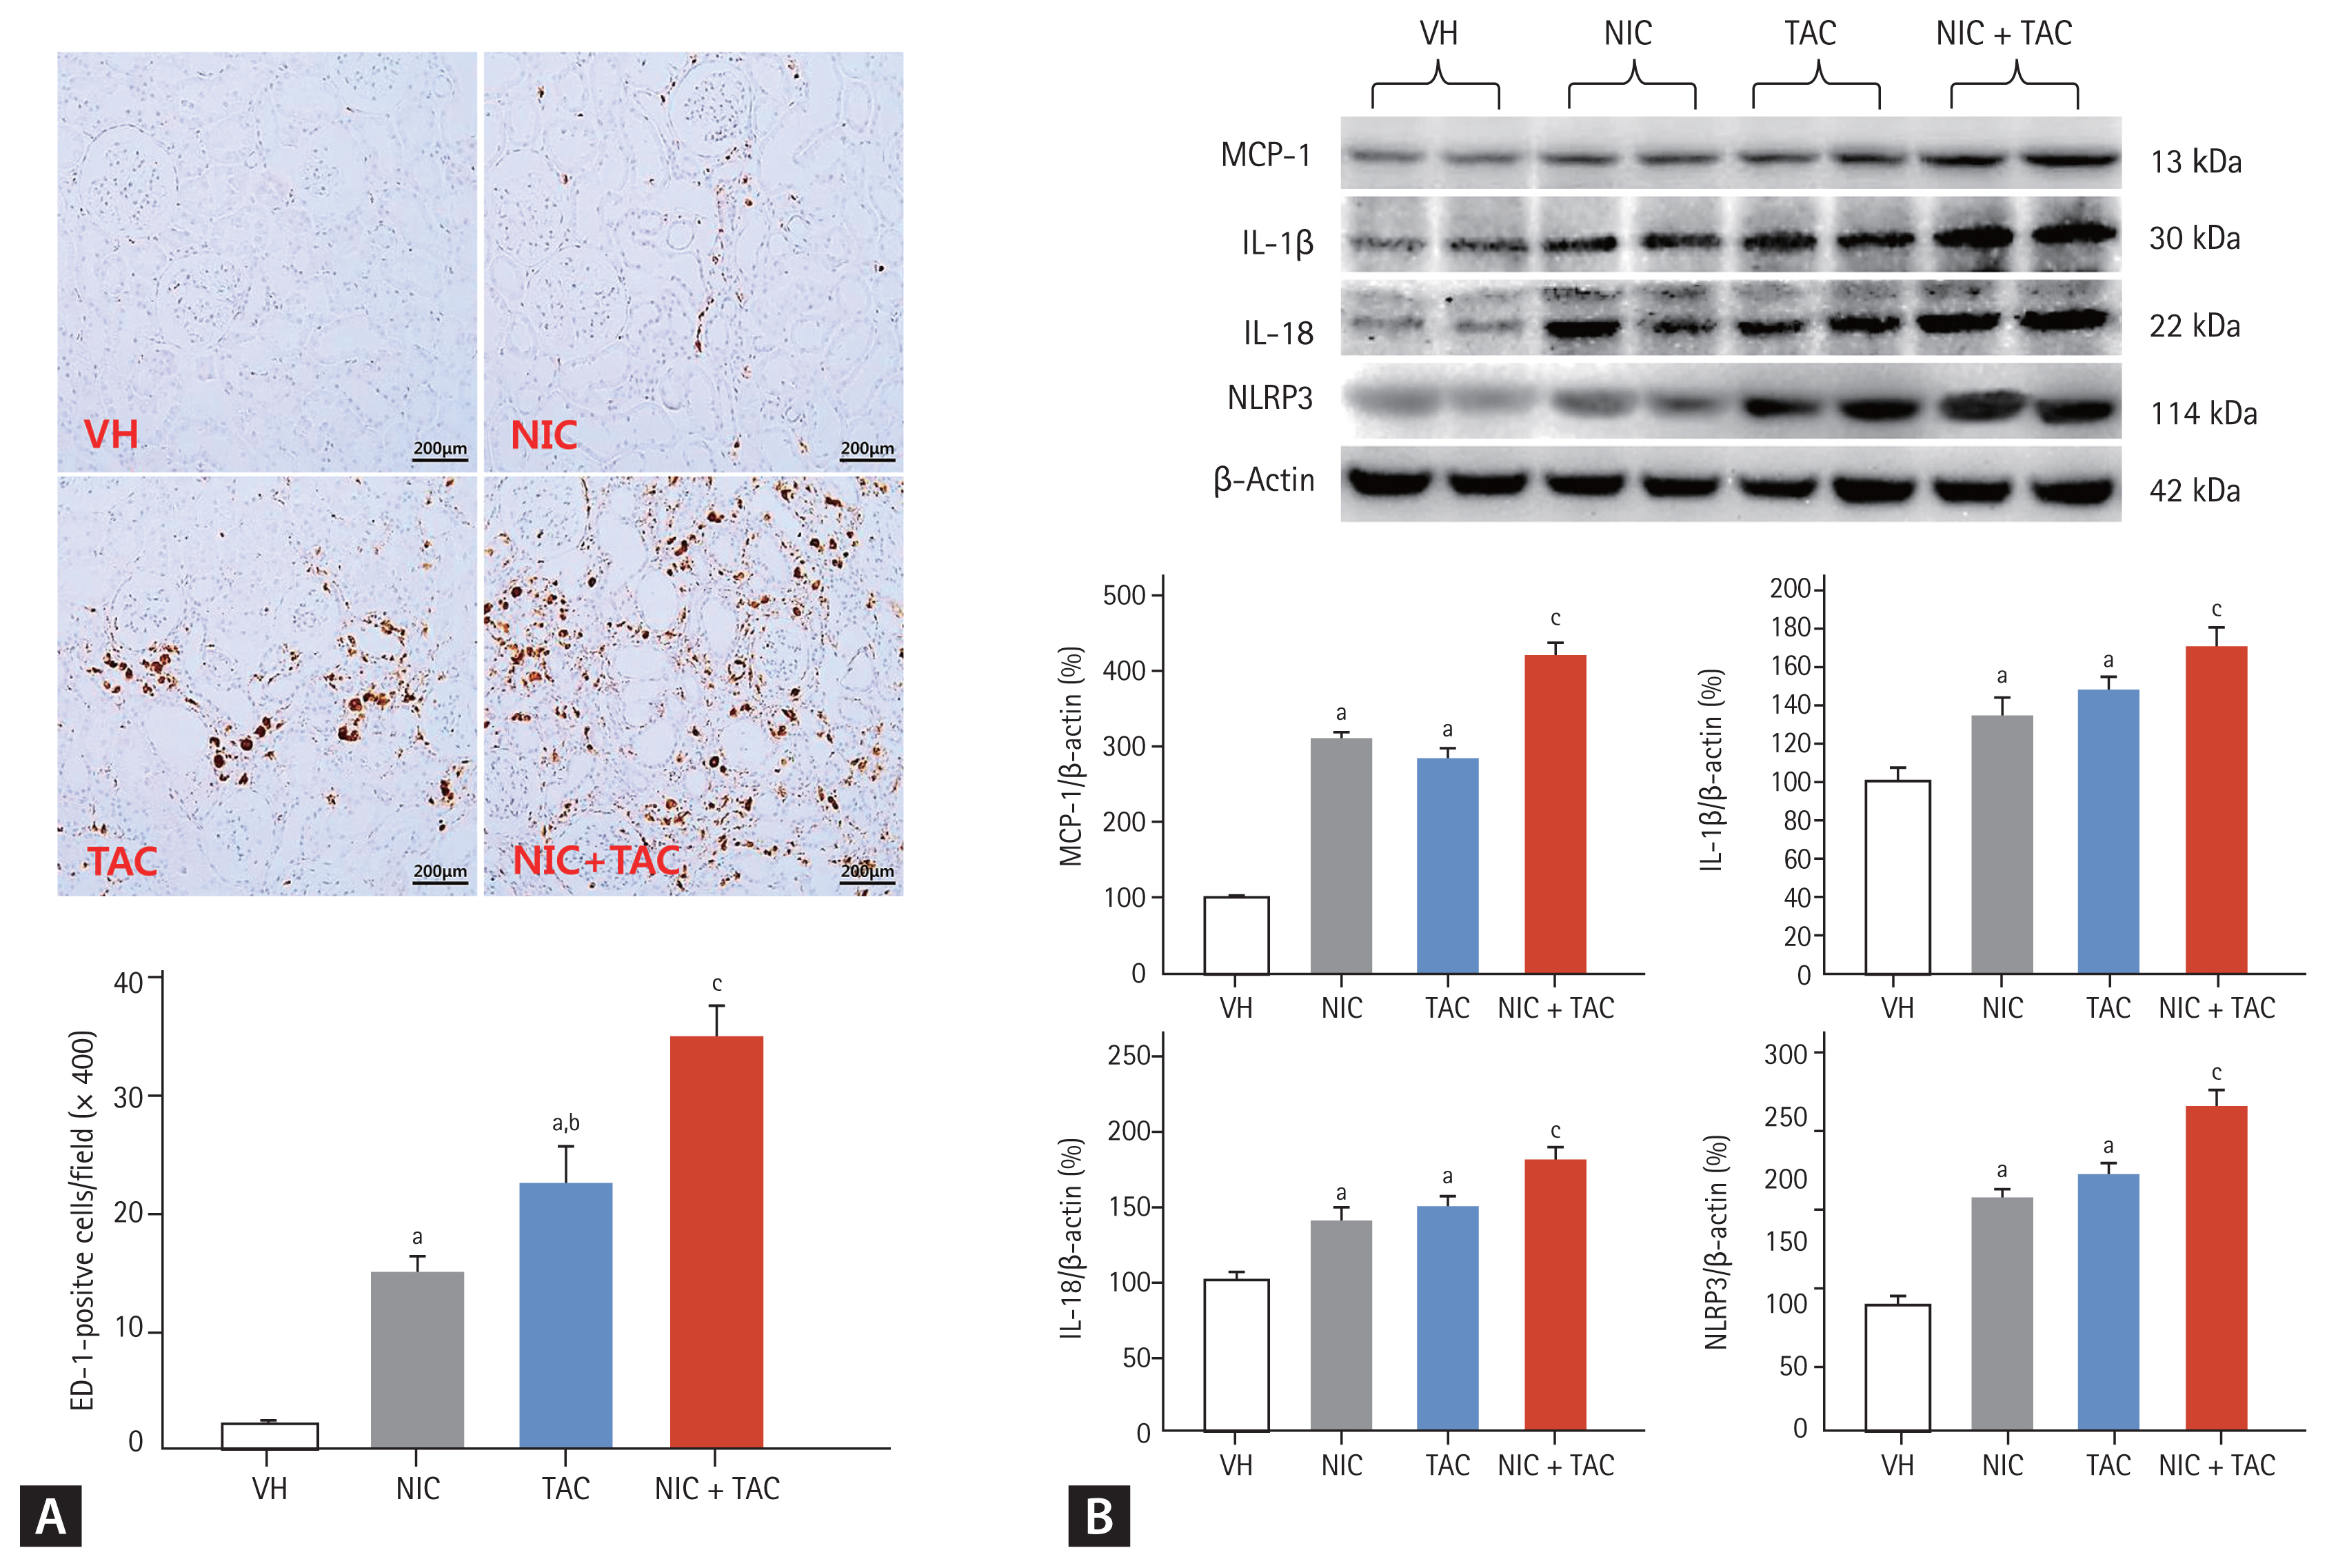
Representative photomicrographs of immunohistochemistry for ectodermal dysplasia-1 (ED-1) (A) and immunoblotting analysis for proinflammatory cytokines (B). VH, vehicle; NIC, nicotine; TAC, tacrolimus; MCP-1, monocyte chemotactic protein-1; IL, interleukin; NLRP3, NOD-like receptor pyrin domain-containing protein 3. ap < 0.01 vs. VH, bp < 0.05 vs. NIC, cp < 0.05 vs. TAC or NIC.
Effect of NIC on oxidative stress in chronic TAC nephrotoxicity
As shown in Fig. 4, chronic TAC treatment is closely associated with an imbalance between oxidant and antioxidant enzymes [12,14]. Immunoblotting analysis showed that NIC upregulated TAC-induced NOX-2 and NOX-4 expression but suppressed SOD1 and SOD2 expressions. In addition, serum and urinary levels of 8-OHdG, an oxidative stress marker, was higher in the NIC and TAC groups compared with the VH group and highest in the NIC + TAC group. These findings imply a synergistic effect of NIC and TAC on oxidative stress in this model.
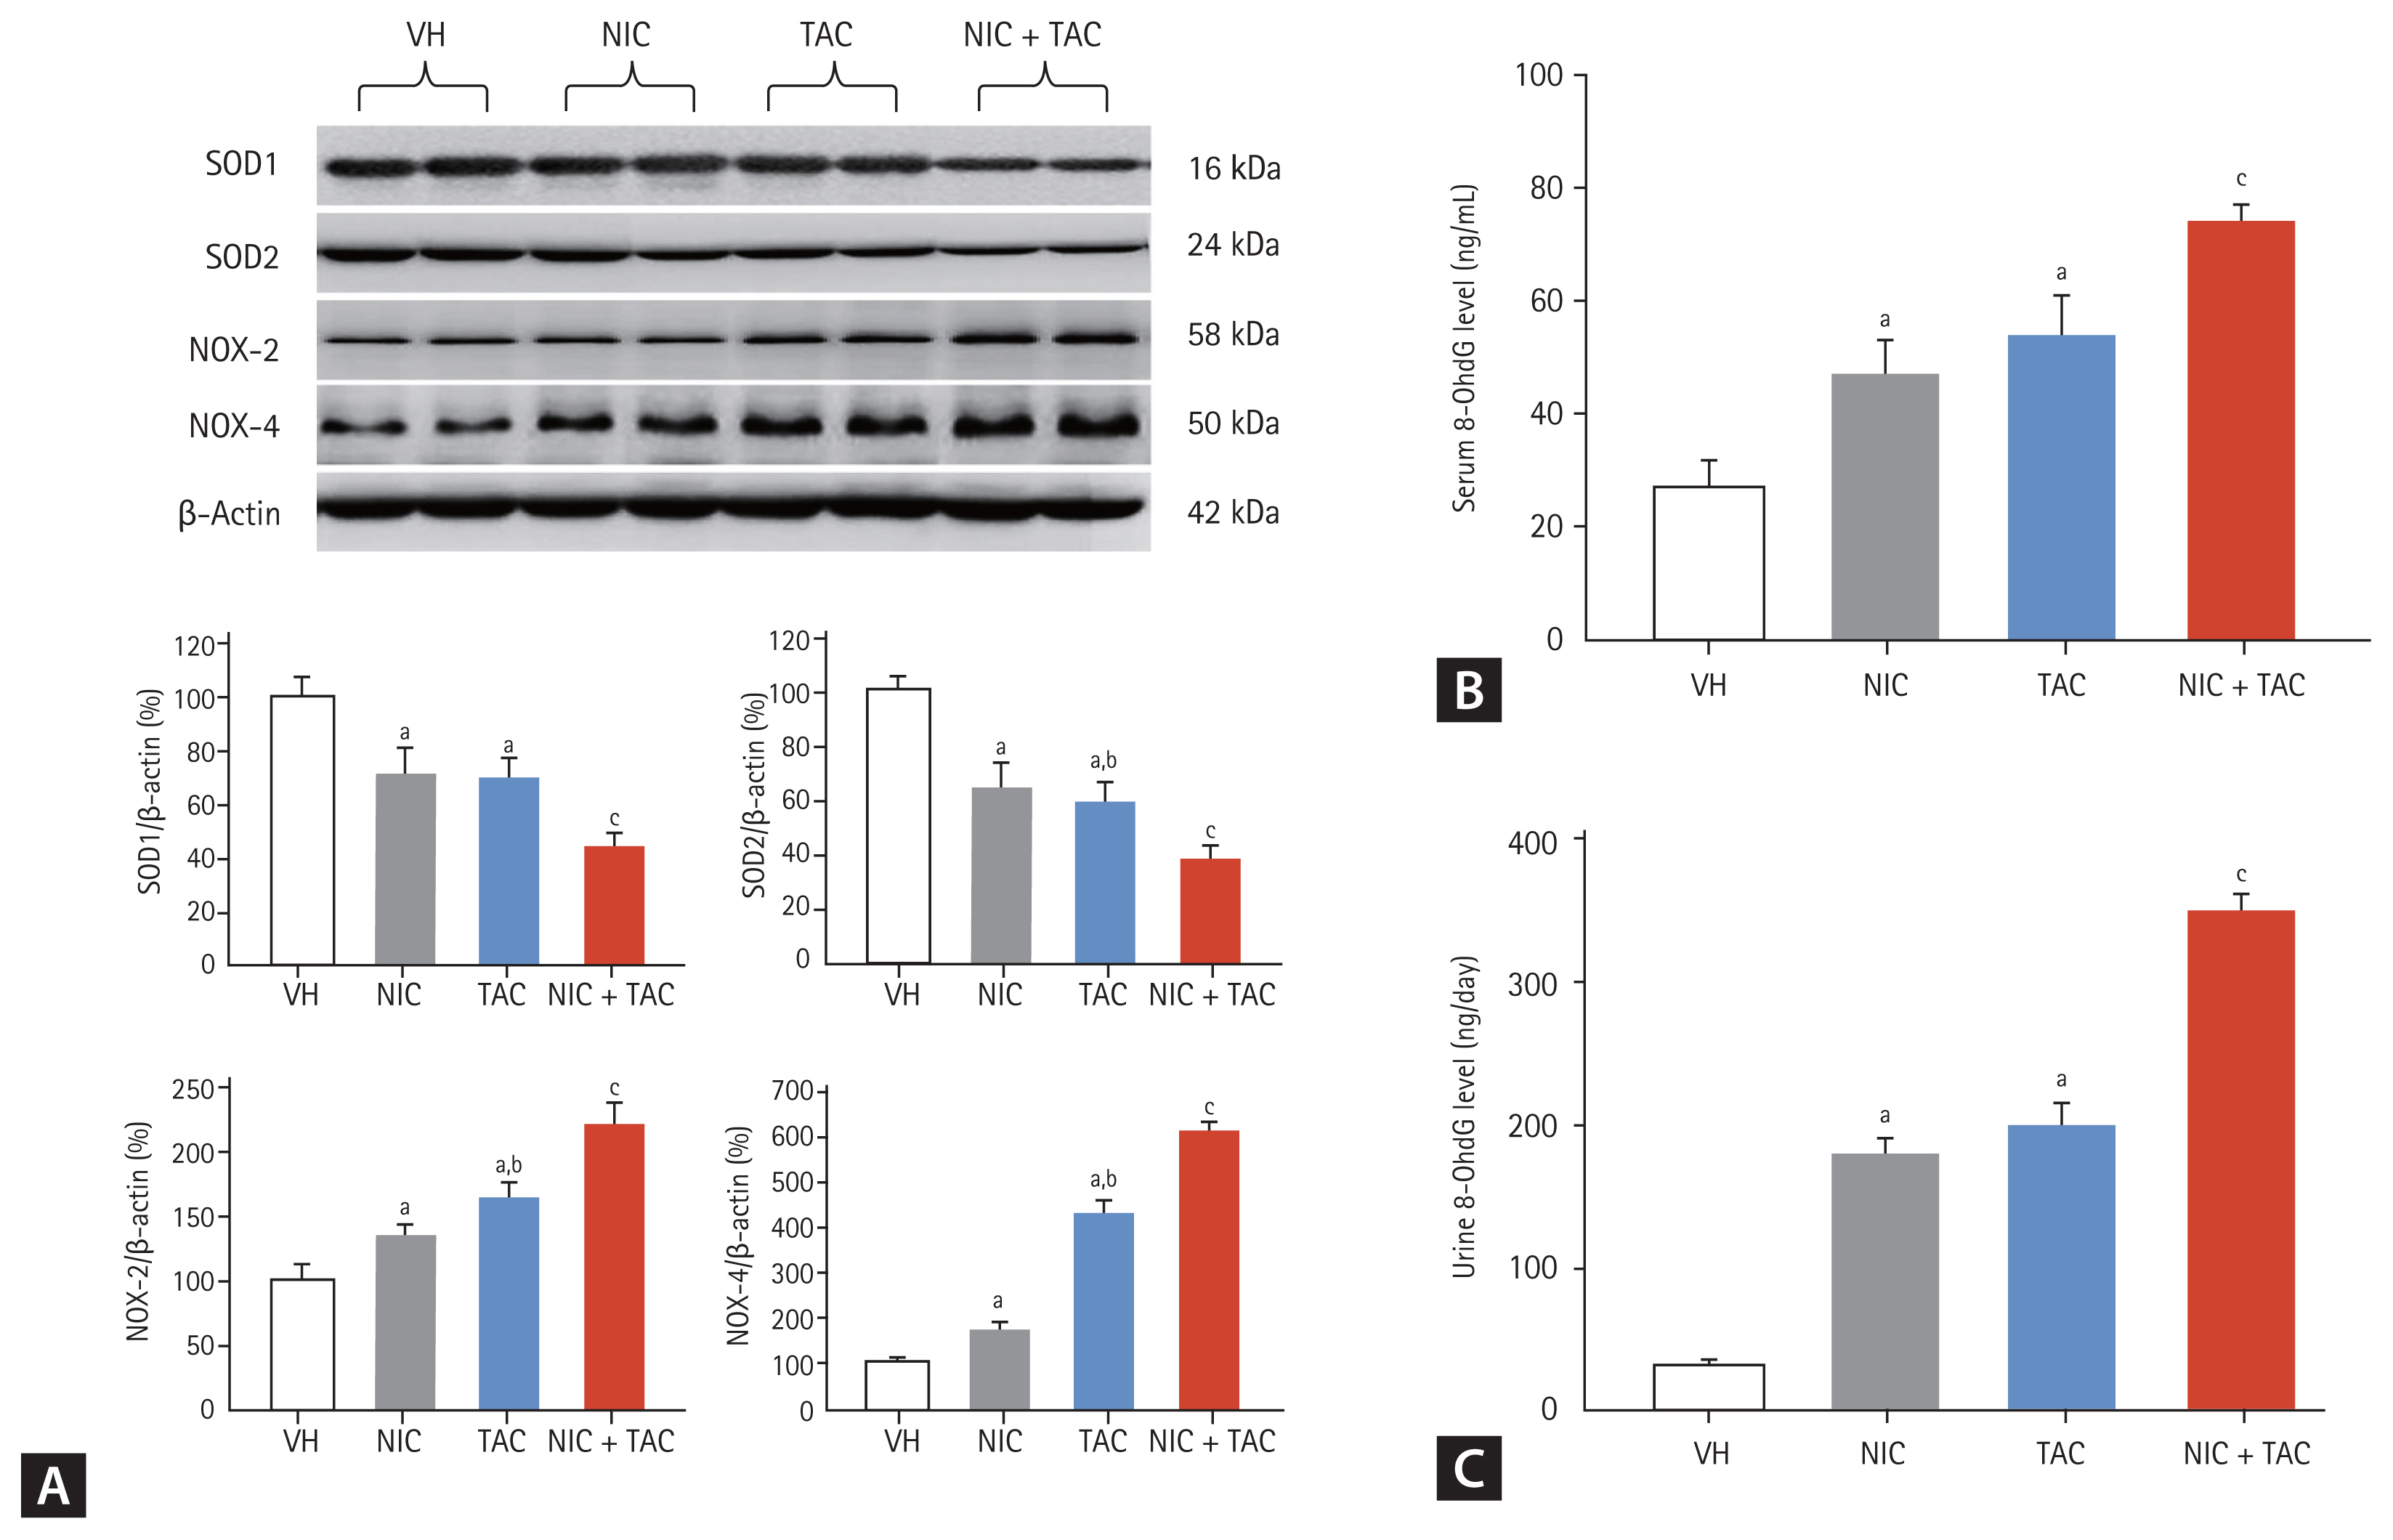
Representative photomicrographs of immunoblotting analysis of a series of oxidative stress-related proteins (A) and serum (B) and urinary (C) 8-hydroxy-2′-deoxyguanosine (8-OHdG) concentrations. VH, vehicle; NIC, nicotine; TAC, tacrolimus; SOD, superoxide dismutase; NOX, NADPH oxidase. ap < 0.01 vs. VH, bp < 0.05 vs. NIC, cp < 0.05 vs. TAC or NIC.
Effect of NIC on programmed cell death in chronic TAC nephrotoxicity
Either type I (apoptosis) or type II (autophagy) programmed cell death is involved in the pathogenesis of chronic TAC-induced renal injury [15]. Using TUNEL assay, we observed that most TUNEL-positive cells or apoptotic bodies were localized to tubular epithelia cells and interstitial vascular endothelial cells, where tubular atrophy and typical TIF progressed (Fig. 5A). Quantitative analysis showed that both NIC and TAC significantly increased TUNEL-positive cells compared with the VH groups; this was more pronounced in the NIC + TAC group. At a molecular level, addition of NIC to TAC-treated rats resulted in a significant dysregulation of Bcl-2/Bax and cleaved caspase-3 expression toward cell death (Fig. 5B). In addition, electron microscopy displayed that TAC treatment induced an abundant formation of autophagic compartments, such as initial autophagic vacuoles (AVi), degradative autophagic vacuoles (AVd), and mitophagy (a form of selective autophagy) in the NIC, TAC, and NIC + TAC groups (Fig. 6). Quantitative immunoblotting revealed that overexpression of p62, LC3B, PINK1, and Parkin proteins seen in TAC-treated rat kidneys was further increased with NIC (Fig. 6G and 6H).
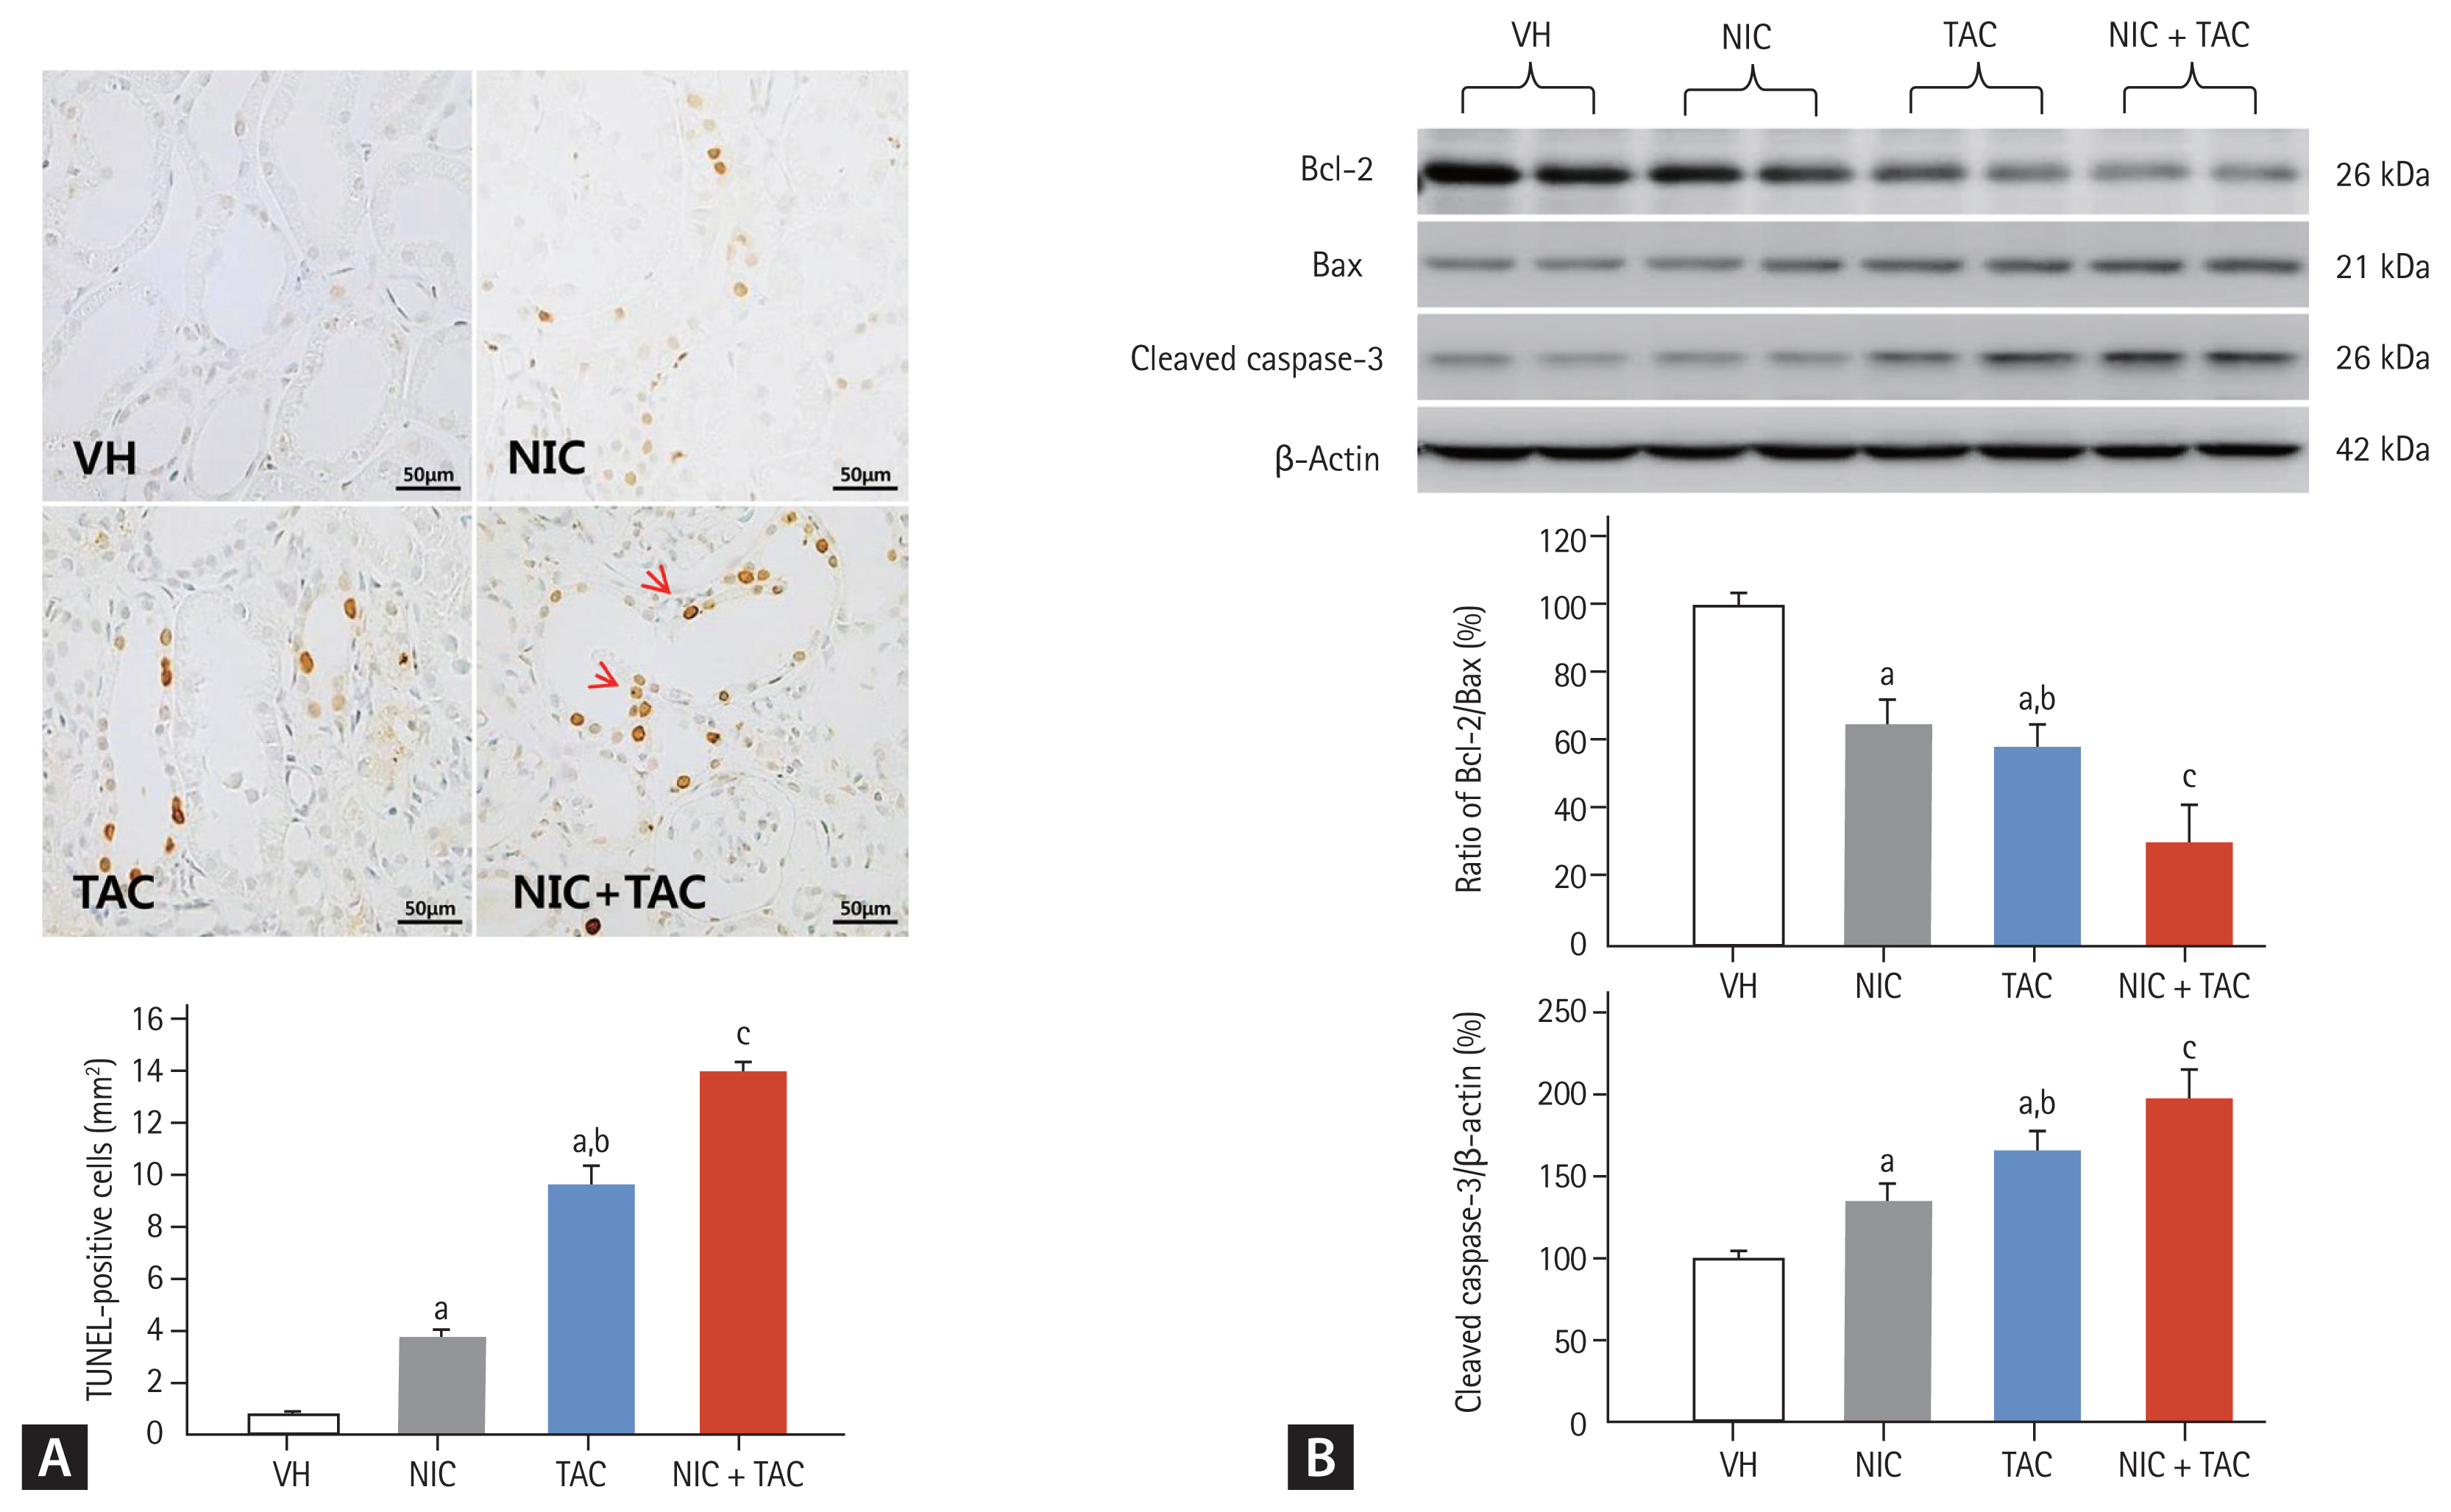
Representative photomicrographs of TdT-mediated dUTP-biotin nick end labeling (TUNEL) assay (A) and immunoblotting analysis for apoptosis-controlling genes (B). Nicotine treatment increases TUNEL-positive cells (arrows) in the tacrolimus-treated rat kidneys. VH, vehicle; NIC, nicotine; TAC, tacrolimus; Bcl, B-cell lymphoma; Bax, Bcl2-associated X. ap < 0.01 vs. VH, bp < 0.05 vs. NIC, cp < 0.05 vs. TAC or NIC.
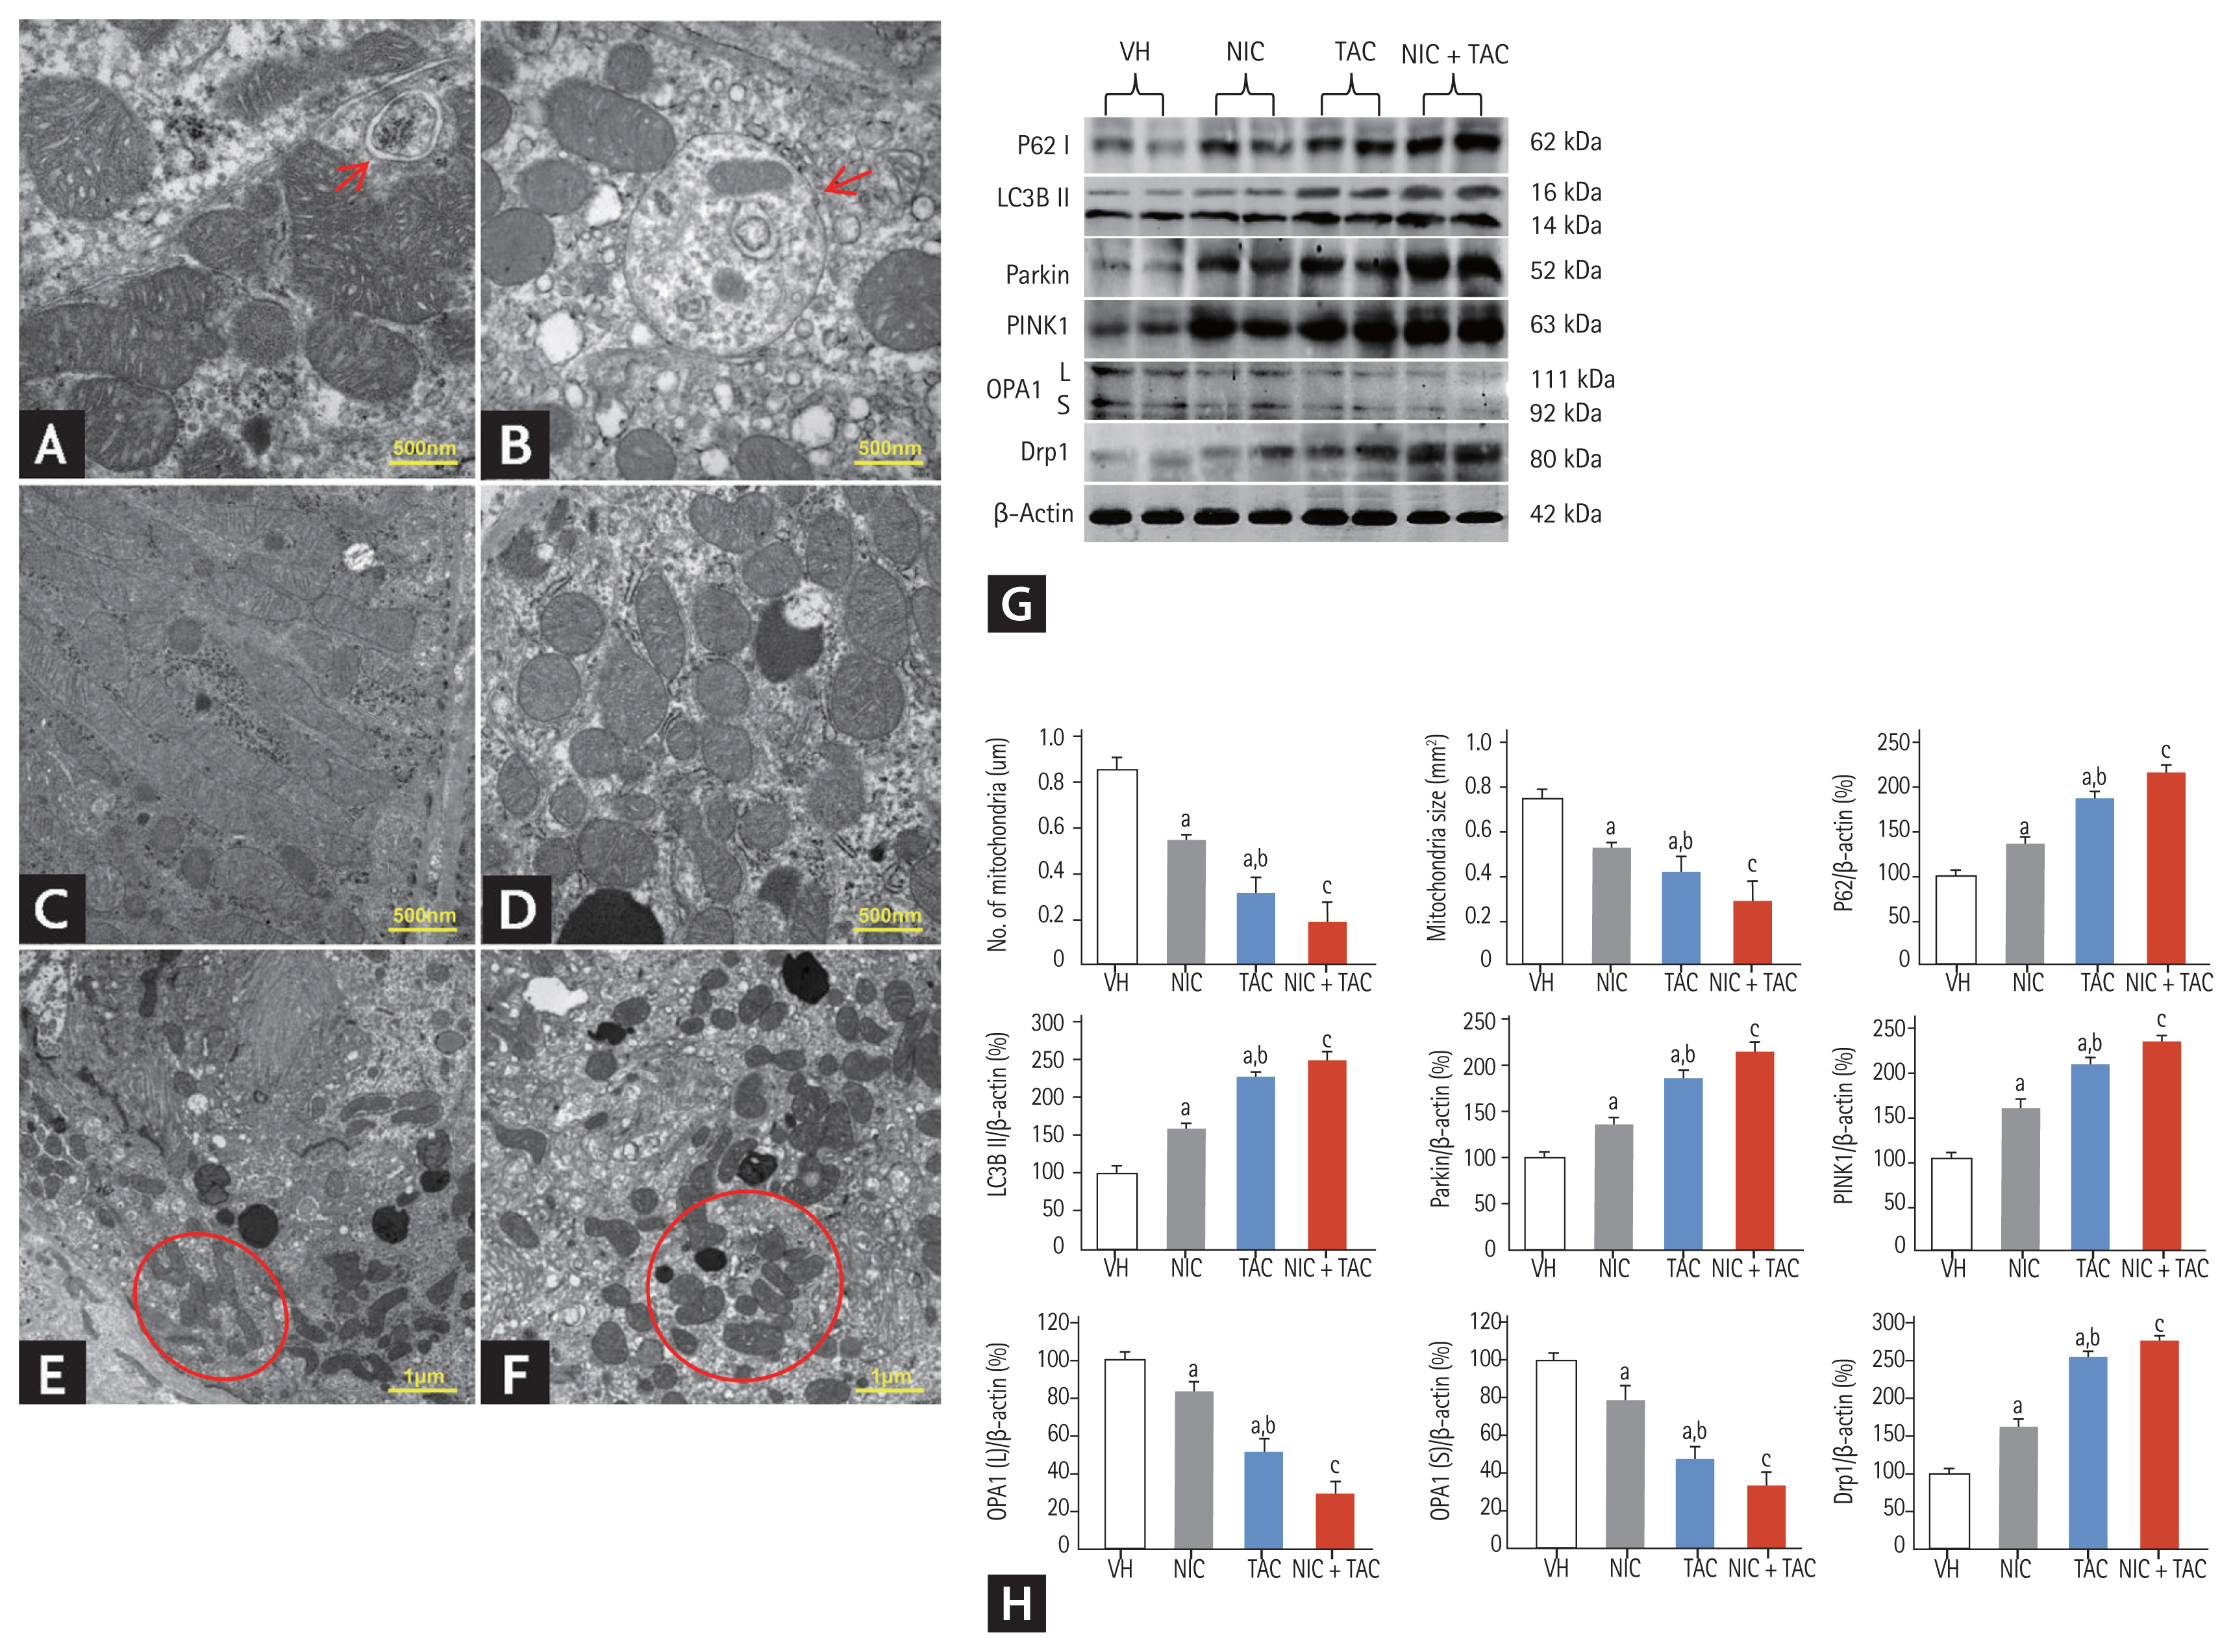
Representative transmission electron micrographs of autophagy and mitochondrial morphology (A–F), immunoblotting analysis (G, H), and quantitation of mitochondrial number and size in each treatment group. (A) Autophagy formation in the kidneys of tacrolimus (TAC) and/or nicotine (NIC) treated rats (arrow); (B) an autophagic compartment containing mitochondria the kidneys of TAC and/or NIC treated rats (mitophagy, arrow); (C) normal mitochondria; (D) reduced mitochondrial number in the kidneys of TAC and/or NIC treated rats; (E) mitochondrial fusion seen in the kidneys of TAC and/or NIC treated rats (circle); (F) mitochondrion divided into two or more daughter organelles in the kidneys of TAC and/or NIC treated rats (fission, circle). VH, vehicle; LC3B, light chain 3B; PINK1, phosphate and tension homology deleted on chromsome ten-induced kinase 1; OPA, optic atrophy protein; Drp, dynamin-related protein. ap < 0.01 vs. VH, bp < 0.05 vs. NIC, cp < 0.05 vs. TAC or NIC.
Effect of NIC on mitochondrial dysfunction in chronic TAC nephrotoxicity
By transmission electron microscopy, we clearly observed that both NIC and TAC destroyed mitochondrial architectures, as illustrated by reduced mitochondrial size and number, disorganized cristae, vacuolization, fusion, mitophagy formation, and mitochondria divided into two or three daughter organelles (fission) (Fig. 6). Quantitative analysis results showed that NIC treatment further decreased the number and size of mitochondria compared with NIC or TAC treatment alone. Immunoblotting analysis revealed that dysregulation of mitochondrial-related proteins (OPA1 and Drp1) induced by either NIC or TAC was exacerbated by coadministration of NIC and TAC (Fig. 6).
Effect of NIC on endoplasmic reticulum stress in chronic TAC nephrotoxicity
As shown in Fig. 7, NIC or TAC induced degranulation of ribosomes, disconnected and dilated cisternae, and peroxisome vacuolization in rough endoplasmic reticulum (ER), whereas smooth ER structure remained almost normal (Fig. 7B). Immunoblotting analysis revealed that either NIC or TAC increased expression of ER stress-related genes including CHOP, Bip, IRE-1α, and ATF-6, but their expression was further increased by the combination of the two (Fig. 7C).
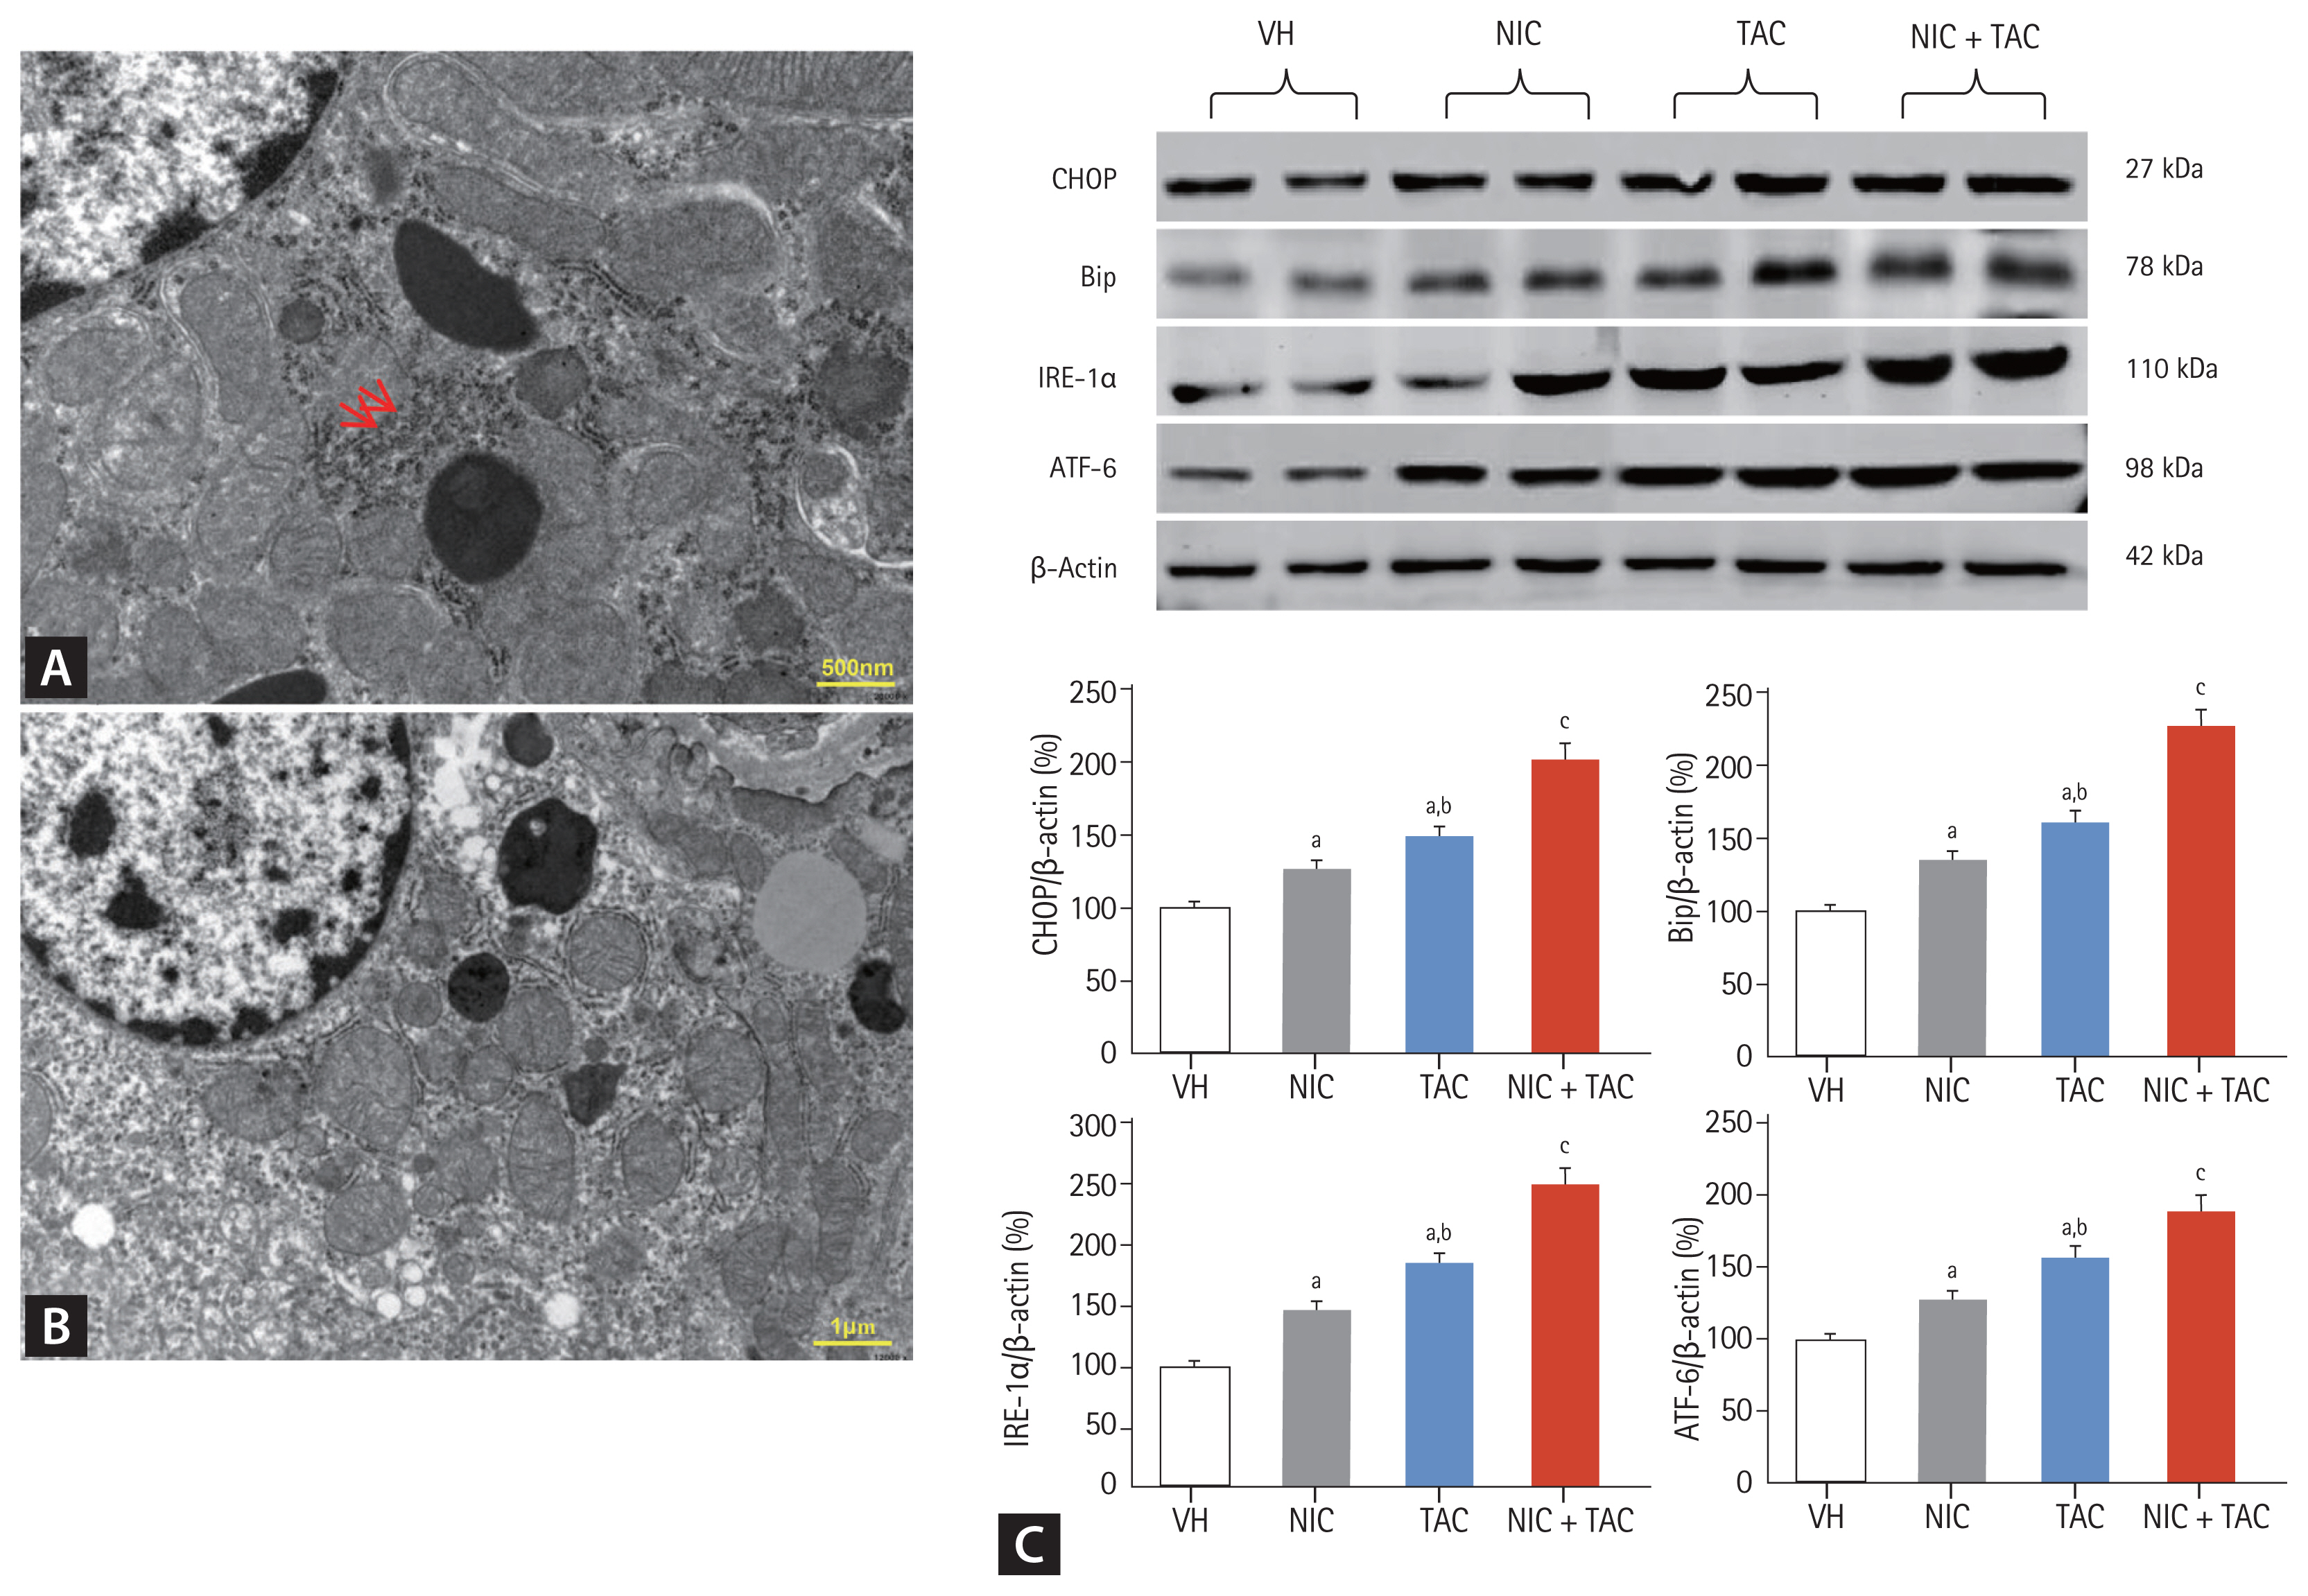
Representative photomicrographs of transmission electron microscopy (A, B) and immunoblotting analysis of endoplasmic reticulum (ER) stress-related genes (C). (A) Normal rough ER (arrows); (B) ribosomes degranulation, disconnected and dilated cisternae, and vesicle dilatation of rough ER in nicotine (NIC) and/or tacrolimus (TAC)-treated rat kidney. VH, vehicle; CHOP, C/EBP homologous protein; Bip, binding immunoglobulin protein; IRE-1α, inositol-requiring protein-1α; ATF, activating transcription factor. ap < 0.01 vs. VH, bp < 0.05 vs. NIC, cp < 0.05 vs. TAC or NIC.
DISCUSSION
Cigarette smoking is an important modifiable risk factor for the progression of CKD in both healthy populations and patients with underlying diseases (e.g., diabetes, hypertension). Clinical trials show that cigarette smoking increases urinary albumin excretion and adversely affects kidney function [16]; in addition, smoking cessation may improve proteinuria in patients with CKD and type 2 diabetes and slow the progression to end stage renal disease [17,18]. Moreover, either recipient or donor smoking contributes to rejection episodes and chronic allograft nephropathy, leading to allograft loss in kidney transplantation [19,20]. These deleterious effects of smoking (NIC) are mirrored by studies in rodent models of 5/6 nephrectomy [21] and diabetic nephropathy [10]. In the present study, we found that NIC aggravated TAC-induced fractional mesangial area and TIF. These pathological changes led to more pronounced renal function impairment and a boosting urinary protein excretion. Based on these results and other reports, we suggest that cigarette smoking may accelerate renal allograft loss in transplant recipients who receive TAC-based immunosuppressant.
Inflammation plays a pivotal role in the evolution of chronic TAC nephrotoxicity because it precedes ongoing renal scarring. Increased proinflammatory mediators in response to injurious stimuli may recruit inflammatory cells, which in turn overexpress proinflammatory and profibrotic cytokines such as chemoattractants, adhesion molecules, and TGF-β1. We have recently demonstrated that NLRP3-dependent and independent inflammasome are involved in the pathogenesis of chronic TAC nephrotoxicity [15]. Our results show that administering NIC to TAC-treated rats amplifies the expression of pyroptosis-related genes (NLRP3, IL-1β, and IL-18), proinflammatory mediators MCP-1, and profibrotic cytokines TGF-β1 and CTGF, leading to excessive ED-1-positive cells influx and βig-h3 upregulation; these responses reflect the severity of glomerular and tubular injuries. Our findings are consistent with those of Arany et al. [22] and Agarwal et al. [23], which showed the effects of NIC on renal inflammation and fibrosis.
Although NIC-based exacerbation of chronic TAC nephrotoxicity in this model may be multifactorial, it is likely related to the impact of oxidative stress. It is well known that chronic TAC treatment is closely associated with afferent arteriolopathy-related hypoxia, which subsequently links to oxidative stress, which in turn activates profibrotic TGF-β1 overexpression, leading to fibrosis. This construct is supported by the observation that antioxidant therapies (e.g., coenzyme Q10) attenuate TGF-β1 expression and TIF via preservation of mitochondrial integrity in chronic TAC nephrotoxicity [24]. Recently, overwhelming evidence from in vivo and in vitro studies demonstrates an interrelationship between chronic NIC exposure and oxidative stress in a variety of renal injury [10,25,26]. Herein, we found that NIC increases serum and urinary 8-OHdG levels and augmented oxidant protein expression, while it suppresses antioxidant protein expression, thereby boosting TAC-induced oxidative stress as well as fibrosis. Indeed, NIC aggravation of TAC-treated kidneys in this study may be attributed to oxidative stress.
It is also possible that both apoptosis (type I programed cell death) and autophagy (type II programed cell death) are involved in NIC-accelerated chronic TAC nephrotoxicity. As previously illustrated, NIC directly induces podocyte and renal proximal tubule cell apoptosis [27,28]; it also indirectly induces apoptotic cell death via oxidative stress [29] or activation of TGF-β1 [22]. NIC may also induce autophagy in pancreatic stellate cells [30], neonatal mouse cardiac myocytes [31], and vascular smooth muscle cells [32]. Thus, oxidative stress and programmed cell death are interrelated. Using TUNEL assay and electron microscopy, we clearly observed that NIC significantly increased the number of TUNEL-positive cells in tubular epithelial cells, interstitial vascular endothelial cells, and autophagic compartments in TAC-treated rat kidneys. These morphological changes were accompanied by dysregulation of apoptosis- or autophagy-related genes in rat kidneys, leading to cell death. This cumulative evidence suggests that NIC itself not only induces oxidative stress and programmed cell death but also promotes the adverse effect of TAC on the kidney, resulting in renal dysfunction and architectural damage, as previously reported in models of streptozotocin (STZ)-induced diabetic nephropathy [10] and CKD (5/6 nephrectomy) [33].
In addition, oxidative stress-originated intracellular organelles such as mitochondrial dysfunction and ER stress play a critical role in chronic TAC nephrotoxicity [24,34]. It is well known that mitochondria are more susceptible to oxidative stress in the kidney because of an arteriovenous oxygen shunt and high oxygen consumption. Chronic NIC exposure increases not only reactive oxygen species production through NADPH oxidase and mitochondria, but also exacerbates mitochondrial depolarization in cultured mouse kidney proximal tubule (TKPTS) cells [35]. Moreover, NIC induces ER stress and subsequent apoptosis and autophagy in human kidney cortex/proximal tubule cells (HK-2) and normal rat kidney epithelial (NRK-52E) cells [36]. Herein, we found that either NIC or TAC damage mitochondria structural integrity, trigger ER stress, and dysregulate mitochondrial and ER stress-controlling genes, and the effects are worsened by combined treatment with the two. Thus, deterioration of mitochondrial fitness and ER stress may account for the effect of NIC on TAC-induced renal injury.
Our study revealed that NIC at a dose of 1.5 mg/kg aggravates TAC-induced renal injury through oxidative stress, inflammation, and programmed cell death, consistent with previous studies [27,37,38]. However, others have observed opposite findings. Sadis et al. [39] showed that NIC at a dose of 0.5 mg/kg protects the kidney from ischemia/reperfusion injury through the cholinergic anti-inflammatory pathway. Another study by Agarwal et al. [23] reported that long-term oral treatment with NIC (28 weeks) confers renoprotective effects in a rat model of spontaneous proteinuria (Munich-Wistar-Frömter rats). The reasons for this discrepancy in the role of NIC on the kidney are unknown but may depend on NIC dose, drug treatment duration, or rodent model. Further studies are required to resolve these issues.
This study clearly demonstrates that NIC exacerbates TAC-induced renal injury in a rat model of chronic TAC nephrotoxicity. Aggravation of oxidative stress and programmed cell death may be one mechanism underlying the deleterious effects of NIC. Our findings provide greater insight into the impacts of smoking among transplant recipients.
KEY MESSAGE
1. Nicotine (NIC) exacerbates tacrolimus (TAC)-induced renal injury in a rat model of chronic TAC nephrotoxicity.
2. Oxidative stress-originated programmed cell death may be one mechanism underlying the deleterious effects of NIC.
3. Intracellular organelle injury including mitochondrial dysfunction and endoplasmic reticulum stress participates in the pathogenesis of NIC-accelerated chronic TAC nephrotoxicity
4. Smoking cessation may be beneficial for transplant smokers taking TAC.
Notes
Conflict of interest
No potential conflict of interest relevant to this article was reported.
Acknowledgments
This work was supported by the National Natural Science Foundation of China (No. 81560125; No.81760293; and No.81760132), the Start-up Fund for Doctoral Research in Yanbian University College of Medicine (No. 602020084), and the Korean Health Technology Research and Development Project, Ministry for Health and Welfare (Grants HI14C3417 and HI16C1641).