Current status of the diagnosis of chronic pancreatitis by ultrasonographic elastography
Article information

Abstract
Chronic pancreatitis (CP) is pathologically characterized by the loss of exocrine pancreatic parenchyma, irregular fibrosis, cellular infiltration, and ductal abnormalities. Diagnosing CP objectively is difficult because standard diagnostic criteria are insufficient. The change of parenchymal hardness is the key factor for the diagnosis and understanding of the severity of CP. The ultrasonography (US) or endoscopic ultrasonography (EUS) elastography have been used to diagnose pancreatic diseases. Both strain elastography (SE) and shear wave elastography are specific diagnostic techniques for measuring tissue hardness. Most previous studies were conducted with SE. There are three methods of interpreting SE; the method of recognizing the patterns in SE distribution images in the region of interest, the method of using strain ratio to compare the hardness of adipose tissue or connective tissue with that of the lesion, and the method of evaluating the hardness distribution of a target by histogram analysis. These former two methods have been used primarily for neoplastic diseases, and histograms analysis has been used to assess hardness distribution in the evaluation of CP. Since the hardness of the pancreas increases with aging, it is necessary to consider the age in the diagnosis of pancreatic disorders using US or EUS elastography.
INTRODUCTION
Chronic pancreatitis (CP) is defined as irreversible and progressive inflammatory changes in the pancreas, which are said to reduce endocrine and exocrine secretion and increase the incidence of pancreatic cancer [1]. Early diagnosis and intervention are important for improving the prognosis of CP, which in several cases is advanced at the time of diagnosis. Ultrasonographic elastography is a relatively new diagnostic technique for measuring tissue elasticity (hardness) [2,3]. In this review, we describe the types and evaluation methods of elastography used in diagnosing CP.
There are various types of elastographic devices, and each operates according to different mechanisms. The four types of elastography are strain elastography, shear wave elastography, transient elastography, and acoustic radiation force impulse (ARFI) imaging [2–5]. In each type, one or more types of evaluation methods, which include the color pattern method, strain ratio, and histogram analysis, are used. When ultrasound elastography is performed for the diagnosis of pancreatic tumors, ultrasonography and endoscopic ultrasonographic (EUS) elastography are used. Elastography devices, despite the similarity in product names, are used in different ways; thus, their function and the different types of elastography are difficult to understand. In this review, we describe the types and evaluation methods of elastography used in diagnosing CP. We also evaluate the ability of ultrasonography and EUS elastography to diagnose CP. This article, however, is neither a systematic review nor a meta-analysis of the published databases.
TYPES OF ELASTOGRAPHY
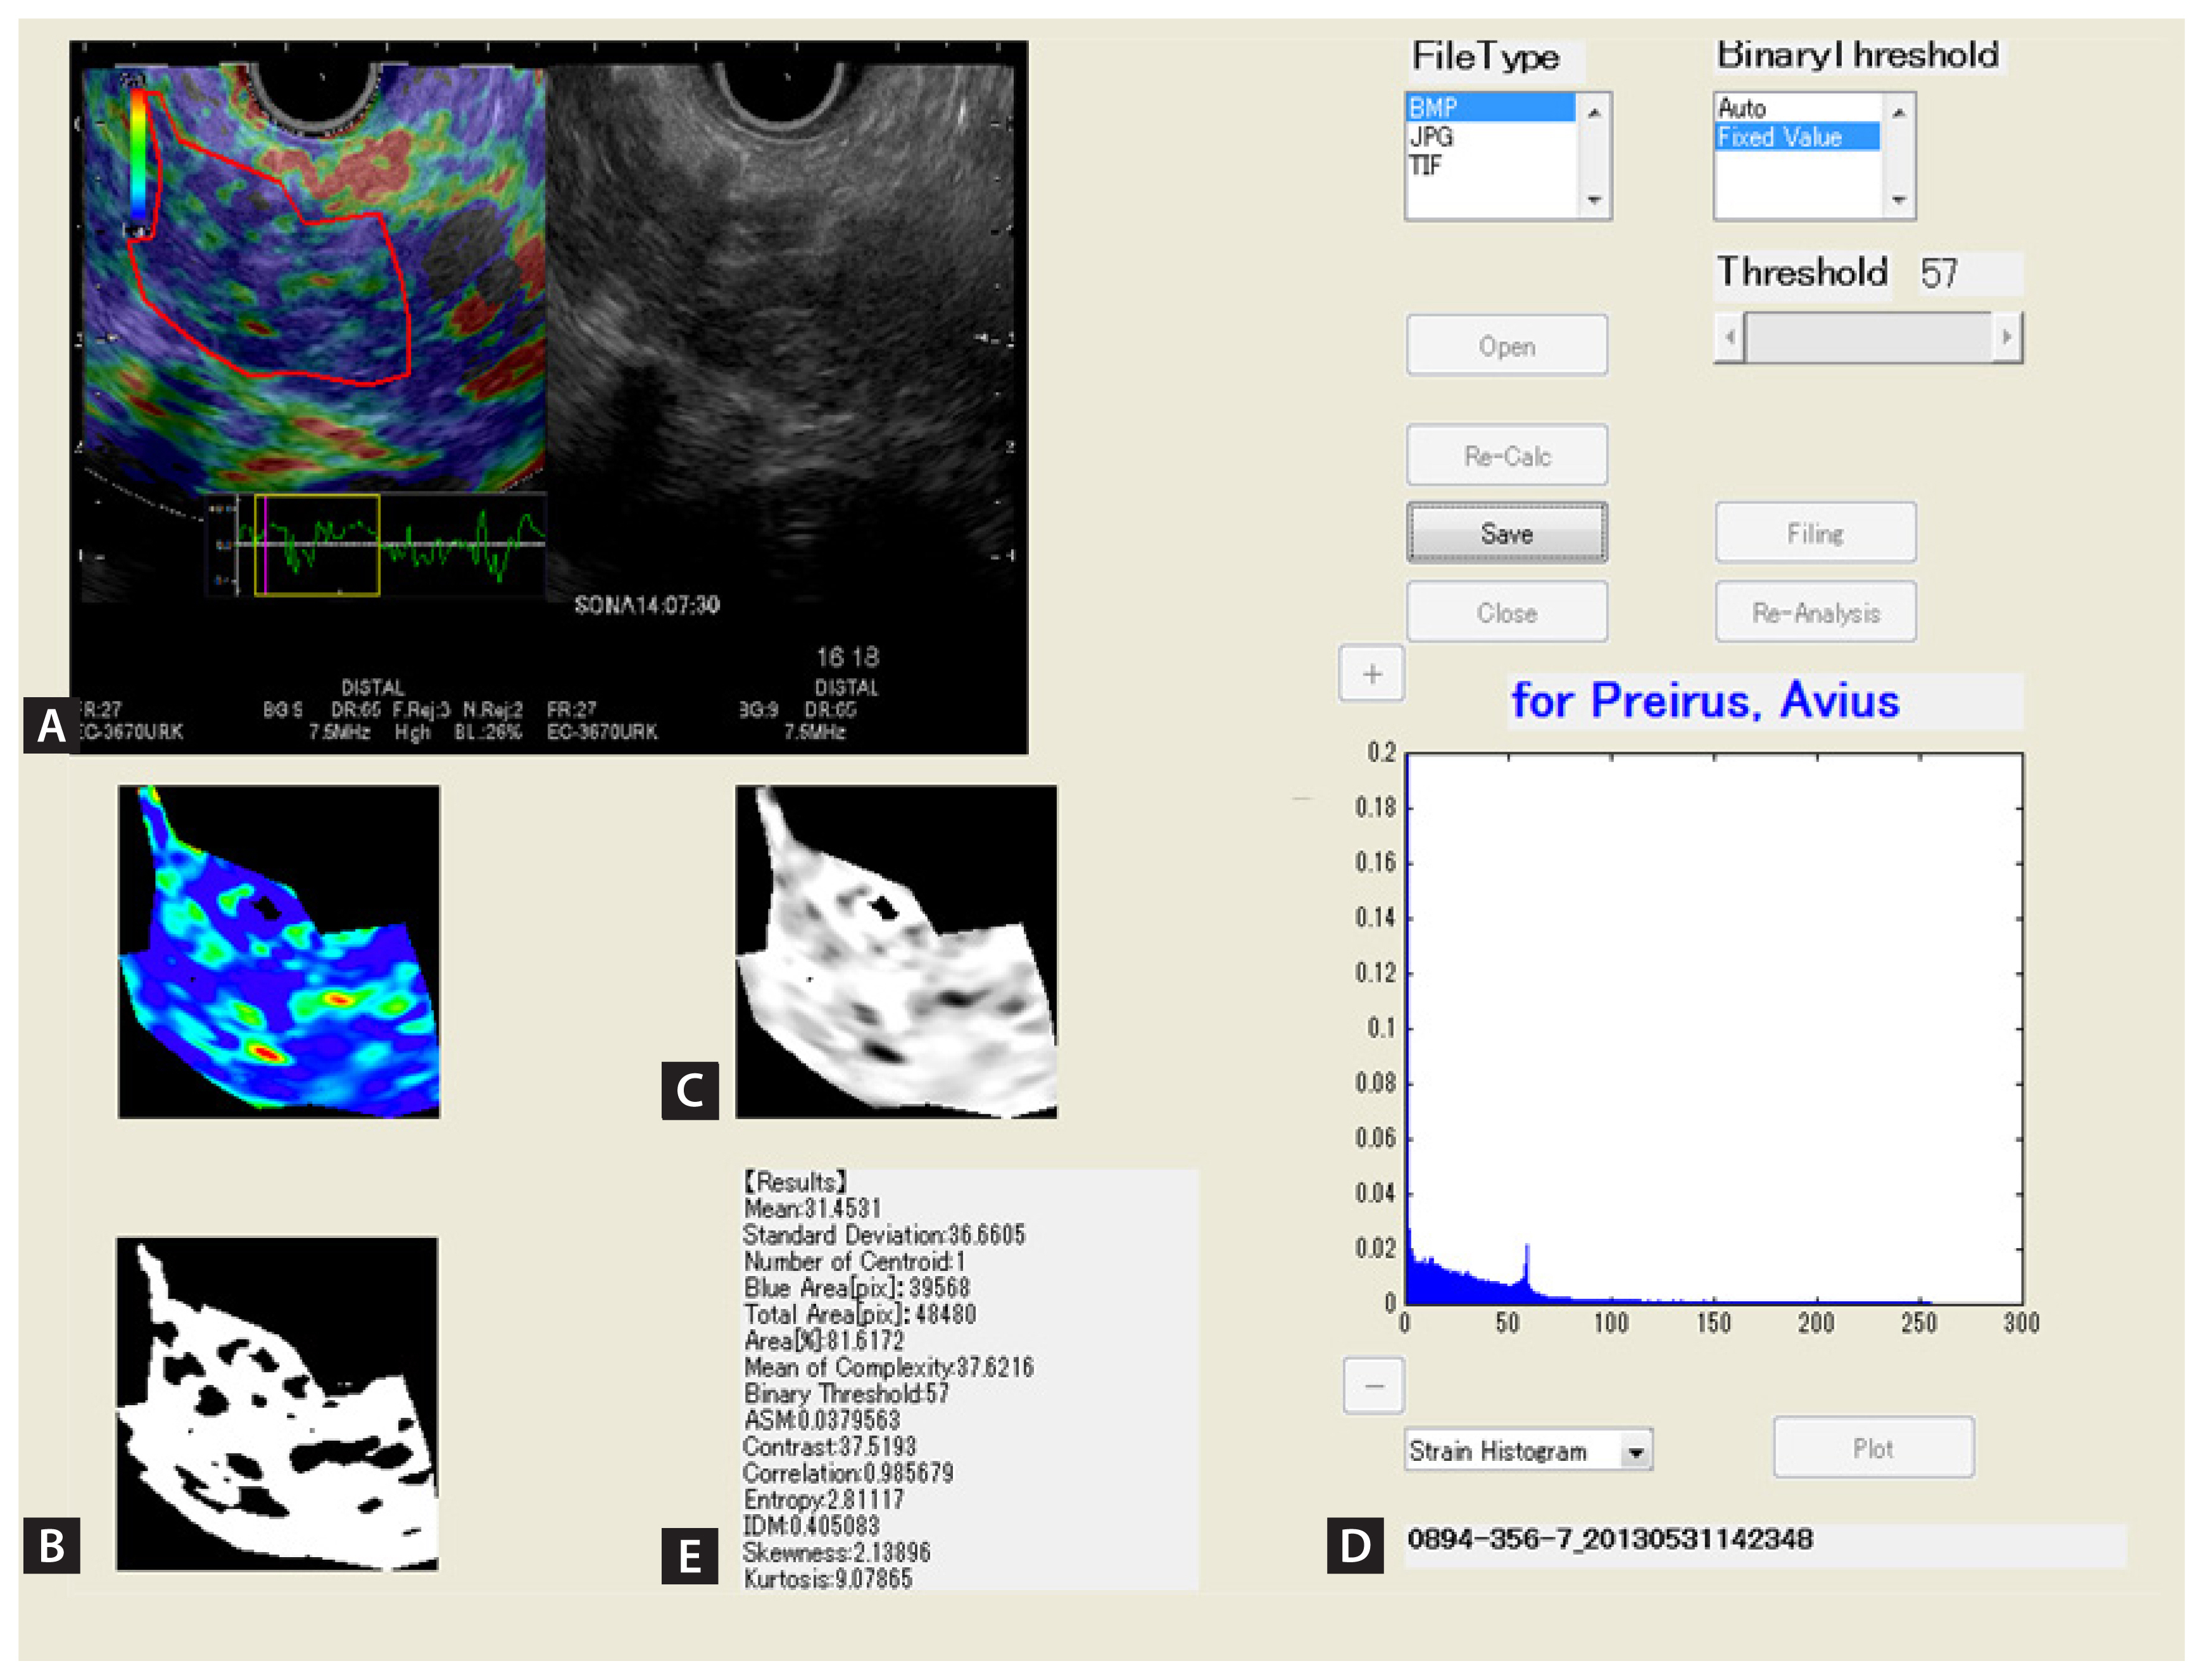
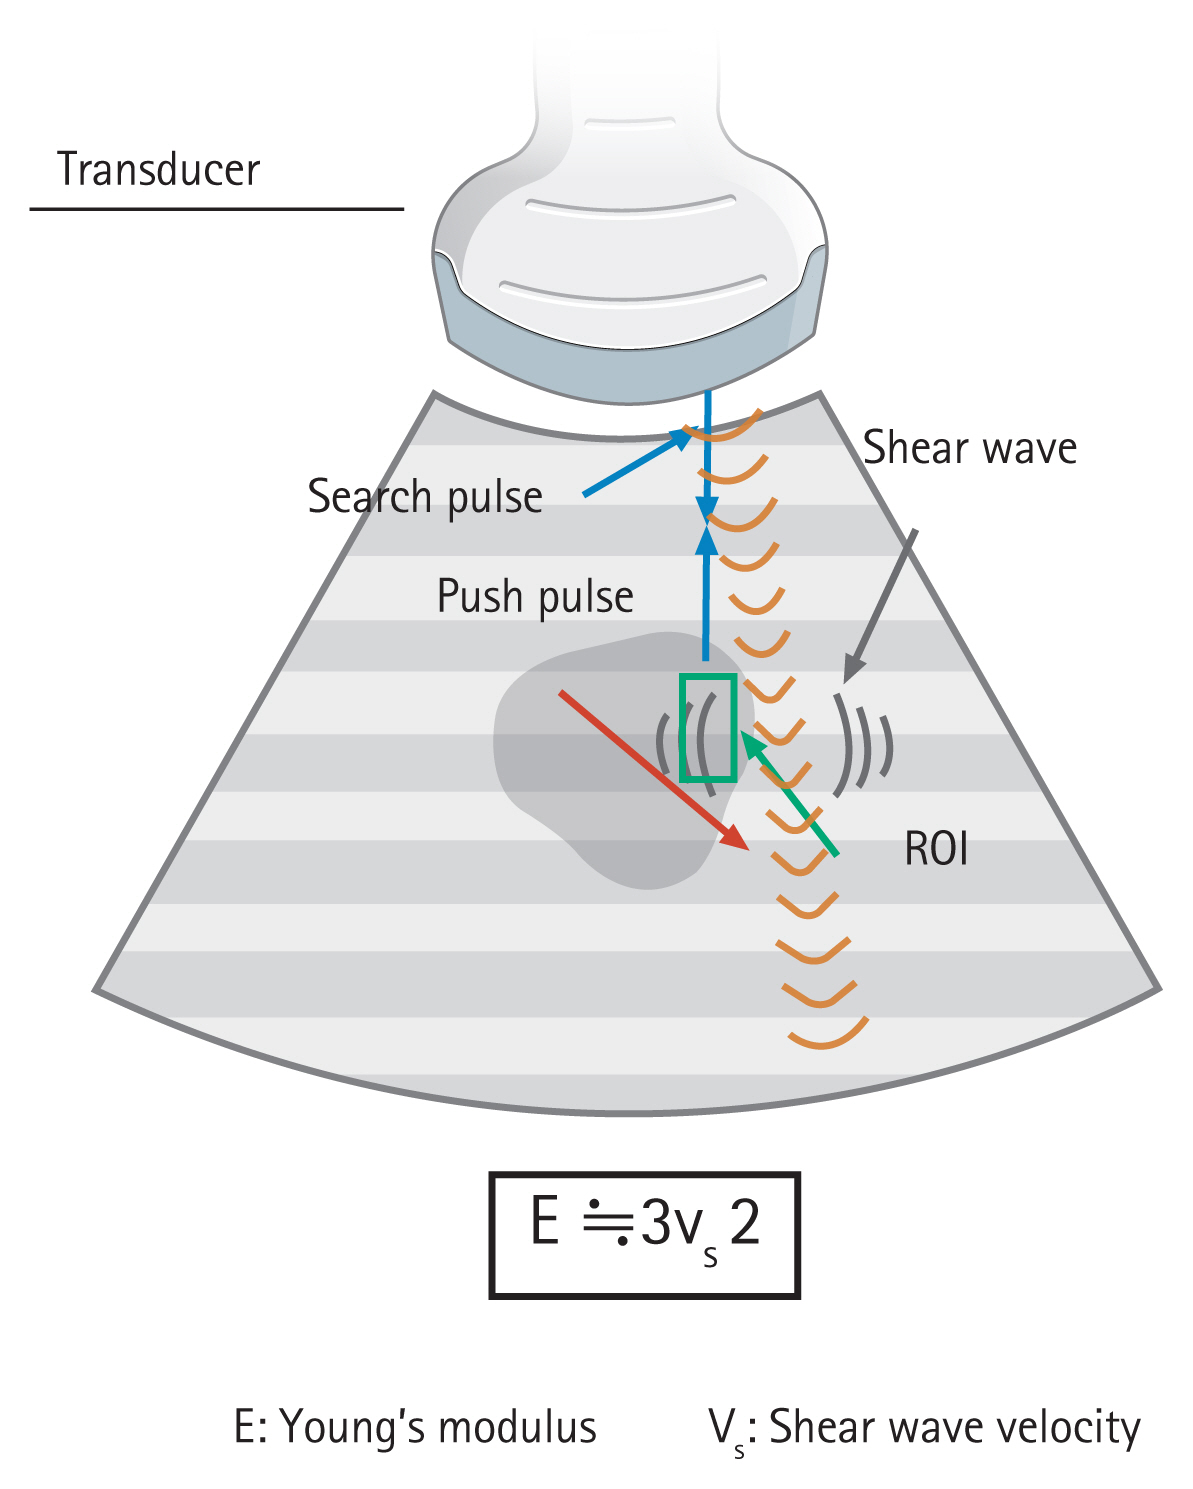
Elastography is a technology for measuring components of images and for quantifying changes that occur when a subject is given some kind of stimulus. The values to be measured are strain (causing displacement) and velocity of the shear wave. A mechanical displacement in the subject caused by moving and compressing by the probe provides the stimulation of change. Additionally, ARFI imaging is a method of causing the displacement of the target and causing the propagation of shear waves from the site displaced to the periphery. To measure shear elastic wave velocity, track pulses are transmitted and received. The relationship between Young’s modulus (E) and shear wave velocity (SWV, Vs) is expressed by E≒3Vs2; therefore, the larger the Vs, the greater the hardness. In clinical practice, transient elastography and ARFI imaging are used mainly for liver diseases, whereas strain elastography and shear wave elastography are used for pancreatic diseases (Table 1) [2]. In this article, we describe strain and shear wave elastography.
Elastography classification
METHODS OF ELASTOGRAPHY
Strain elastography
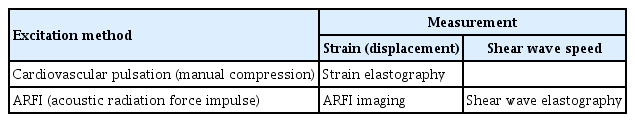
The evaluation method in strain elastography that yields the highest quality results is color pattern diagnosis. Generally, color pattern diagnosis is used to evaluate tumors; images display major color tones (whereby blue represents hard tissue and red represents soft tissue) and can be used to evaluate tumors with heterogeneous or homogeneous color tones. Giovannini et al. [6] first described the elastic score, which is a color pattern diagnosis, and five combinations of the elastic score, color pattern, and heterogenicity of distribution of elastography. Quantity evaluation methods include the use of the strain ratio and histogram analysis. The strain ratio is defined as the ratio of the target lesion strain to the peripheral tissue strain [7]. In histogram analysis, a histogram is created by the conversion of an elastographic image into a 256-tone grayscale, and feature values are created from this grayscale image (Fig. 1) [8].
Histograms of endoscopic ultrasonography-elastographic images, obtained with the ultrasonographic observation system ARIETTA 850 (Hitachi Aloka Medical Ltd.). (A) B-mode image; (B) elastographic image. The region of interest is outlined by the square on the pancreas of the right image. Twelve feature values, created by the conversion of an elastographic image into a 256-tone grayscale, are displayed by histograms.
Shear wave elastography
For shear wave elastography, only the quantity evaluation methods are used, and the values are expressed in meters per second or kilopascals. The tissue elasticity is proportional to the square of the SWV [9,10]. An acoustic push pulse transmitted by the ultrasonographic transducer through the tissue induces an elastic shear wave that propagates through the tissue; this wave is followed by detection pulses, which are used to measure the velocity of the shear wave propagation. The method traditionally used in EUS elastography was mainly strain elastography, but shear wave elastography has recently become available (Fig. 2) [11–14].

Elastography with endoscopic ultrasonographic (EUS) shear wave measurement (SWM), obtained with the ultrasonographic observation system ARIETTA 850 (Hitachi Aloka Medical Ltd.). In this EUS image, the pancreas (outlined by the rectangle) has mixed signals with hyperechoic foci, strands, and dilated side branches. EUS-SWM was performed to diagnose early chronic pancreatitis. The EUS-SWM value of 2.24 was higher than the cutoff value of 2.19 for diagnosing chronic pancreatitis [11].
THE USEFULNESS OF ULTRASONOGRAPHY/EUS ELASTOGRAPHY IN PANCREATIC DISEASE
The usefulness of elastography for pancreatic diseases was first reported in 2006 [6,15]. Uchida et al. [16] reported its utility in transabdominal wall ultrasonography, but most of the reports from Europe and the United States concerned EUS elastography. The reason is thought to be the difference in body size between the subjects in Europe and the United States and those in Japan. Conversely, many reports emphasized the usefulness of EUS elastography; Hirche et al. [17] reported its limitations: for diagnosing local pancreatic lesions, they found the sensitivity, specificity, and accuracy of EUS elastography to be 41%, 53%, and 45%, respectively. Alternatively, Giovannini et al. [6], who first reported the use of EUS elastography for evaluating pancreatic disease, reported that the sensitivity and specificity of diagnosis of localized pancreatic lesions were 100% and 67%, respectively. What accounts for these differences?
In EUS elastography for pancreatic diseases, almost all researchers used strain elastography. To understand EUS elastography, it is necessary to know how to interpret the findings. In EUS elastography with image histogram analysis, a constant value can be obtained regardless of the shape of the region of interest, and this value is useful for diagnosing diffuse pancreatic disease, especially CP. Conversely, Iglesias-Garcia et al. [18] reported using the strain ratio to diagnose CP. Using EUS elastography, they examined the average strain ratios in the head, body, and tail of the pancreas, and reported that CP could be diagnosed correctly in 91.1% of cases in which the average strain ratio cutoff value was 2.25. However, we conducted a similar study, using strain ratio, and found that the strain ratio value was completely different depending on the region of interest; we could not obtain Iglesias-Garcia et al.’s [18] results. We thought that using the strain ratio was difficult because of the measurement error associated with this ratio and the irregular location of fibrosis in CP. We through researchers must confirm that both EUS elastography can be used to evaluate pancreatic fibrosis or hardness, as well as several other factors. We confirmed EUS elastography could evaluate pancreatic fibrosis or hardness including many factors by taking the following steps.
Step 1: To verificate EUS elastography in the quantitative analysis of pancreatic fibrosis, with a comparison of surgical specimens
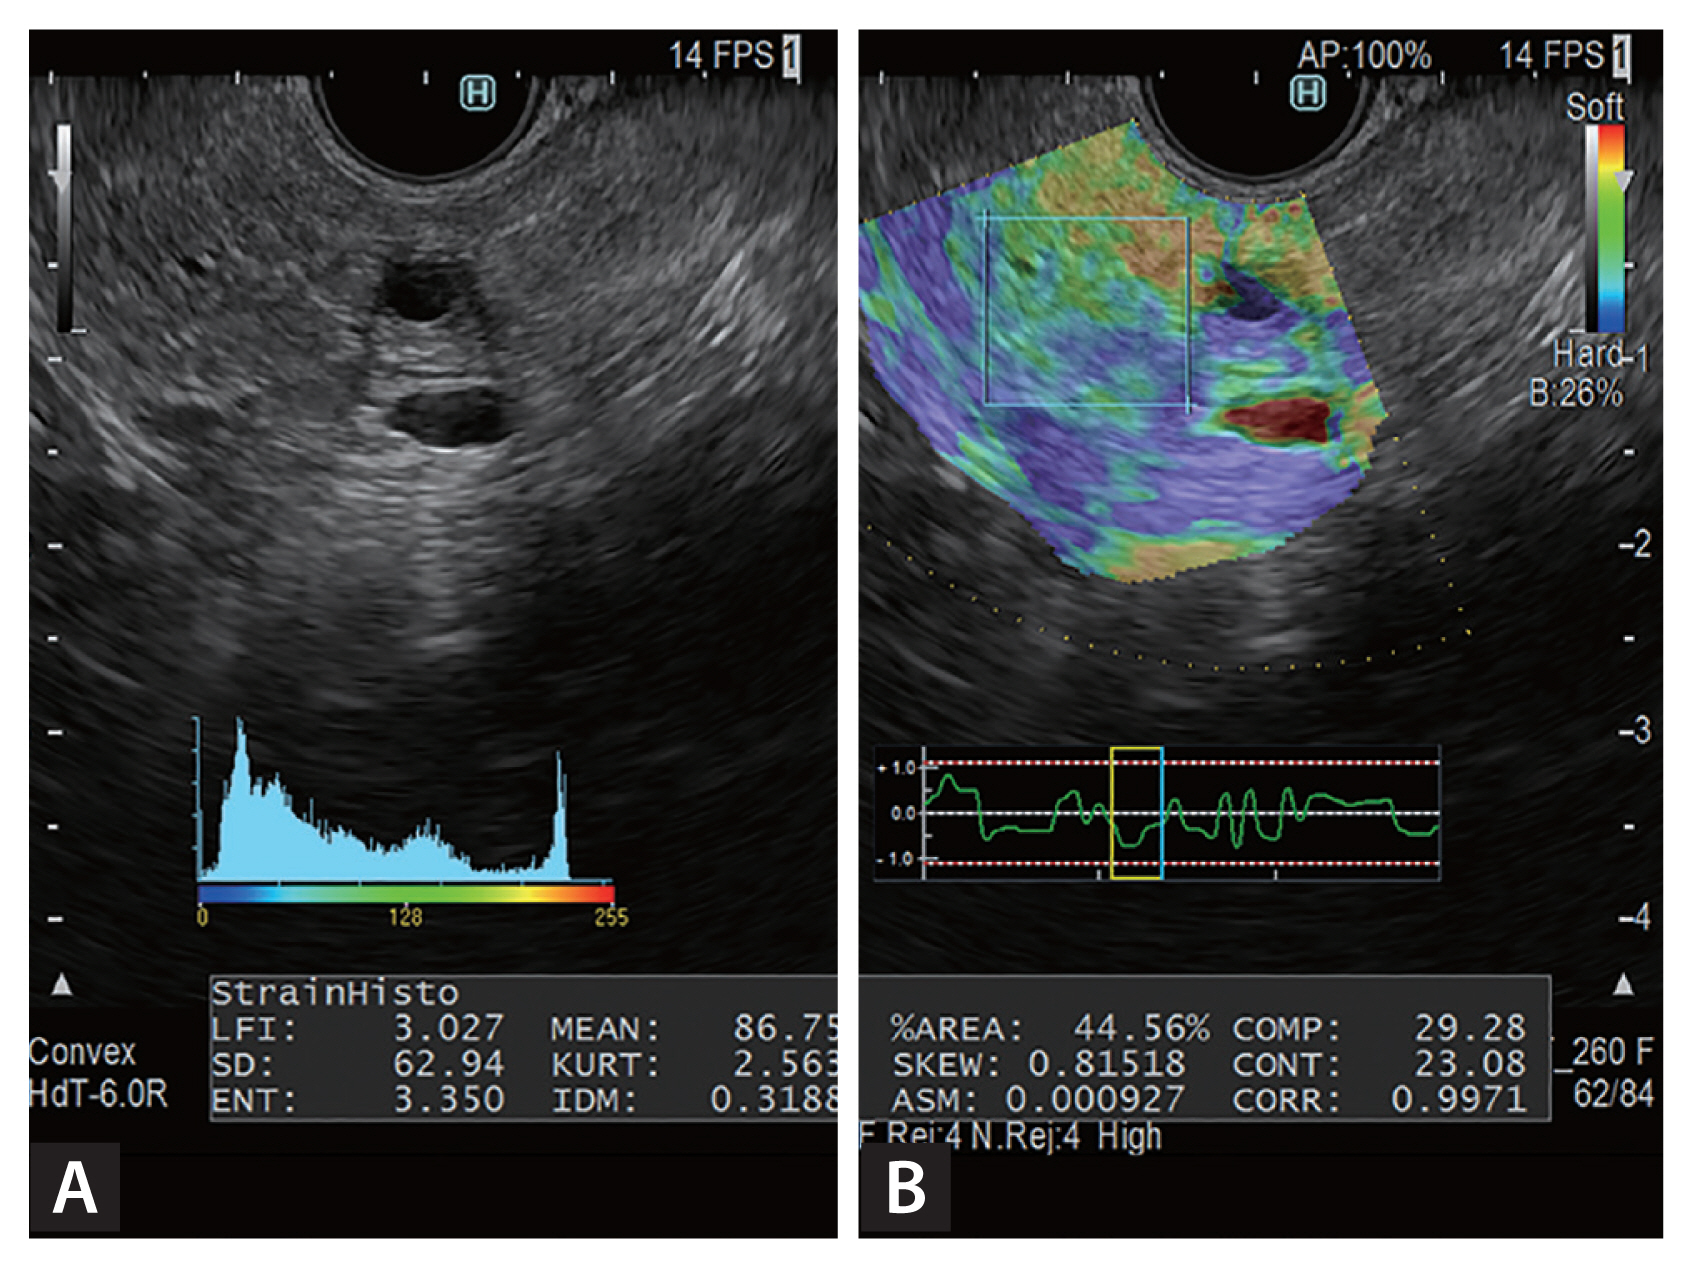
We got started this discussion by describing a study with histopathological specimens. Presently, in the process of diagnosing CP, EUS elastography is performed to confirm pancreatic fibrosis or hardness, as well as other factors. Itoh et al. [8] reported EUS elastography in the quantitative analysis of pancreatic fibrosis with an emphasis on the comparison of surgical specimens. They performed a strain histogram analysis of the EUS elastographic image in Fig. 3. To convert the strain histogram from a color image to a 256-tone grayscale image (distortion value image), an arbitrary area on the EUS elastographic image was selected. The image was then converted into a binarized image under a certain threshold value. A plurality of features was automatically calculated from the strain value image and the binarized image. Preoperative EUS elastographic images in the upstream pancreas were statistically quantified, and the results were retrospectively compared with postoperative histological images of fibrosis in the same area. For the quantification of EUS elastographic images, four parameters (mean, standard deviation [SD], skewness, and kurtosis) were calculated with the use of novel software. Klöppel’s score was calculated according to an ascending risk scale of pancreatic fibrosis (0–12) [19]. Histological fibrosis was graded according to four categories (normal, mild fibrosis, marked fibrosis, and severe fibrosis) on the basis of a previously reported scoring system (Fig. 4) [20].
Endoscopic ultrasonographic (EUS) elastographic images depicting chronic pancreatitis and histogram, obtained with Elasto version 1.5.1 (Hitachi Aloka Medical Ltd.). (A) Right, B-mode image of the pancreas; left, an EUS elastographic image, in which relative elasticity information in the region of interest is color-coded, whereby blue represents hard tissue, red represents soft tissue, and green represents tissue of average hardness. The region to be analyzed is in the pancreatic parenchyma. The entire parenchyma (outlined in red) on the EUS elastographic image was analyzed. The “strain indicator” (an indicator of the strength of compression applied to tissue) was used to analyze graded images in the appropriate compression state. (B) An image after extraction of only color components (elastic information) in the region of analysis. Elasticity images are expressed as colors (red represents soft tissue, green represents tissue of average hardness, and blue represents hard tissue). (C) A grayscale image obtained by conversion of the color in B into a 256-tone grayscale (0 is depicted as blue, 255 as red). (D) A grayscale histogram representing the distribution of the 256 tones of gray in the grayscale. (E) Fifteen values for the quantification of the elasticity of the pancreas were calculated according to the grayscale histogram.

Classification of pancreatic fibrosis (fibrosis scores) (normal, mild, marked: H&E, ×100; severe: H&E, ×200). The fibrosis score ranged from 0 to 12 according to the degree of intralobular fibrosis (red arrow) and interlobular fibrosis (blue arrows) of the pancreatic parenchyma. In this study, scores of 0 to 3 represented the normal state; scores of 4 to 6, mild pancreatitis; scores of 7 to 9, moderate pancreatitis; and scores of 10–12, severe pancreatitis.
Itoh et al. [8] found significant correlations between all four quantification parameters and the grade of pancreatic fibrosis. The latter was negatively correlated with the mean (r = −0.752) and SD (r = −0.54) and positively correlated with skewness (r = 0.69) and kurtosis (r = 0.67). In an analysis of the ability of the four quantification parameters to diagnose pancreatic fibrosis, the receiver operating characteristic (ROC) curve indicated that the mean was the most useful parameter. The areas under the curves of the mean were all 0.90 for the diagnoses of mild and higher grade fibrosis, moderate and higher grade fibrosis, and severe fibrosis. Thus, the diagnostic ability of the mean was high, regardless of the grade of fibrosis. Moreover, the mean value showed the most sensitive negative correlation with pancreatic fibrosis. This showed that pancreatic fibrosis can be diagnosed by EUS elastography.
Itoh et al.’s [8] study had some limitations. First, the reproducibility of the EUS elastographic images was poor. Second, the relevance of these findings to nonobstructive CP was unknown; the cases of fibrosis that they studied were mostly caused by neoplasia and thus could have differed from fibrosis caused by nonobstructive CP. The other limitations were the relatively small number of patients and the retrospective nature of the study. Despite these limitations, Itoh et al. [8] were the first to quantify the grade of pancreatic fibrosis by using EUS elastography. Unlike several other evaluation techniques, EUS elastography allows the accurate grading of pancreatic fibrosis.
Step 2: To verificate the Usefulness of ultrasonography and EUS elastography between obtained pancreatic fibrosis or hardness and the stage of CP
To compare pancreatic fibrosis or hardness with the stage of CP, we examined the correlation between the Rosemont classification [21] and the results of EUS elastography. Kuwahara et al. [22] reported that they calculated the “mean value” by performing EUS elastography and histogram analysis of the pancreatic parenchyma or tumors.
EUS elastography was repeated five times for each patient. The average value of the five measurements was defined as the “mean value.” The mean values in the histogram analysis for the Rosemont classification (normal, indeterminate for CP, suggestive of CP, and consistent with CP) were significantly correlated inversely with the number of features found on EUS elastography. These findings indicate that CP can be diagnosed using EUS elastography. Particularly, the mean value of NP cases was significantly higher than that of CP cases, and the mean value was significantly elevated as CP progressed. A more objective diagnosis of CP by EUS is possible with the use of EUS B-mode images. The recognition of early-stage CP according to mechanistic definition [23] is extremely important for maintaining the quality of life because therapeutic intervention can begin early. EUS elastography and histogram analysis may contribute to the diagnosis of early-stage CP, and future studies are important.
We concluded EUS elastography have a potential usefulness in the diagnosis of pancreatic diseases including CP staging and other diseases such as pancreatic ductal adenocarcinoma (PDAC). We think EUS plays an important role in the diagnosis of many other pancreatic disorders as well, but the diagnosis of CP with EUS depends on the skill of the endoscopic sonographer.
Kuwahara et al. [24] also studied 53 patients who underwent shear wave elastography with ultrasonography of the pancreatic parenchyma preoperatively and in whom the pancreatic parenchyma was evaluated histologically. Histological fibrosis was graded into the same four categories (normal, mild, moderate, and severe) as in Itoh et al.’s [8] study. Kuwahara et al. [24] found a significant positive correlation between the pancreatic elastic modulus and the histological grade of pancreatic fibrosis (r = 0.63, p < 0.001). Regarding the pancreatic parenchyma, the areas under the ROC curve for the accuracy of shear wave elastography were 0.85 for diagnosing mild fibrosis, 0.84 for diagnosing moderate fibrosis, and 0.87 for diagnosing severe fibrosis. Kuwahara et al. [24] concluded that shear wave elastography with ultrasonography was a useful noninvasive method of determining the stage of pancreatic fibrosis with high accuracy and reproducibility.
UTILITY OF ELASTOGRAPHY WITH EUS SHEAR WAVE MEASUREMENT IN PANCREATIC DISEASE
Ohno et al. [14] first reported the feasibility of EUS-guided shear wave measurement (EUS-SWM), and Yamashita et al. [11] reported on the utility of elastography with EUS-SWM for diagnosing CP.
Yamashita et al. [11] evaluated the utility of EUS-SWM for diagnosing CP and estimating CP severity by determining the presence of endocrine dysfunction along with diabetes mellitus. Fifty-two patients underwent EUS and EUS-SWM and were classified into two groups according to the Rosemont classification: non-CP (indeterminate CP and normal) and CP (consistent with and suggestive of CP). The median EUS-SWM value according to SWV was evaluated regarding the Rosemont classification and the number of EUS features. The diagnostic accuracy and cutoff values of EUS-SWM for CP and diabetes mellitus and their sensitivities and specificities were calculated. The EUS-SWM values were significantly correlated with the Rosemont classification and the number of EUS features. The EUS-SWM values that were suggestive of CP were significantly higher than those of the non-CP group. The area under the ROC curve for the diagnostic accuracy of EUS-SWM for CP was 0.97. The cutoff value of 2.19 had 100% sensitivity and 94% specificity. For endocrine dysfunction in CP, the area under the ROC curve was 0.75. The cutoff value of 2.78 had 70% sensitivity and 56% specificity. Yamashita et al. [11] concluded that EUS-SWM provides an objective assessment of CP and can be an alternative diagnostic tool. EUS-SWM may also be useful for predicting the presence of endocrine dysfunction. Further studies of EUS-SWM are expected in the future.
DIAGNOSIS OF CP WITH TRANSABDOMINAL ULTRASONOGRAPHY
Ultrasonographic examination of the pancreas has some limitations. Sumi et al. [25] reported that 25% or less of the pancreas was unobservable in subcostal scans. Nonetheless, ultrasonography is always the first step in the diagnosis of CP. We describe a study of CP in which elastography was used with ultrasonography.
Evaluation with strain elastography and ultrasonography
Uchida et al. [16] reported on the usefulness of elastography with ultrasonography in evaluating the pancreas. They reviewed 10 cases of the normal pancreas, five of PDACs, two of endocrine tumors, and five of CP in which elastography was performed, and they reported the typical color map observed in ultrasonographic elastography as follows: homogeneous color characterized normal pancreases, markedly hard areas with soft spots characterized PDAC, uniform and soft areas comparable with the parenchyma characterized neuroendocrine tumors, and a mixture of various colors characterized CP. Kawada et al. [26] performed ultrasonographic elastography for 36 consecutive solid pancreatic tumors. They reported that the strain ratio was higher in ductal adenocarcinomas than in benign tumors.
Evaluation with shear wave elastography and ultrasonography
ARFI imaging of the entire pancreas can be performed wherever desired in shear wave elastography. Thus, shear wave elastography is considered a breakthrough in the history of elastography for the pancreas. Virtual Touch Quantification (Siemens Healthineers, Erlangen, Germany) is a representative application of shear wave elastography that shows the stiffness of target tissue digitally by measuring SWV.
Yashima et al. [27] first reported using ARFI elastography to measure the stiffness of normal pancreases and that of pancreases affected by definite CP. They studied 46 patients with CP and 52 with normal pancreases and determined that the optimal SWV for diagnosing CP was 1.40 m/sec according to ROC analysis, and the sensitivity, specificity, and positive and negative predictive values for diagnosing CP were 75%, 72%, 69%, and 78%, respectively. They concluded that ARFI elastography is useful for the diagnosis of CP. Llamoza-Torres et al. [28] also reported the usefulness of percutaneous ARFI elastography for the diagnosis of CP. They examined 33 patients and found a significant difference between the mean SWV without CP (1.27 m/sec) and the mean SWV with CP (1.57 m/sec; p = 0.037). The area under the ROC curve was 71.3%, and the accuracy of ARFI imaging for diagnosing CP was 69.7% when SWV was 1.4 m/sec. They concluded that SWV was significantly correlated with the number of EUS criteria for CP.
Besides ARFI imaging, shear wave elastography was used to measure SWV, which led to the development of the Virtual Touch Imaging and Quantification (VTIQ) application (Siemens Healthineers). VTIQ has been available in Japan since March 2012, and only linear probes have been used in VTIQ so far. Several researchers have evaluated the usefulness of VTIQ in assessing other organs [29–31]. In ElastPQ (Philips, Amsterdam, The Netherlands), SWV is measured in kilopascals. Several researchers have used ElastPQ to evaluate the correlation between SWV and the stage of chronicliver disease [32–34]. Pozzi et al. [35] first reported using ElastPQ with SWV to measure pancreatic stiffness in CP. They studied 52 consecutive patients with CP and 42 healthy controls and found that pancreatic stiffness with point shear wave elastography was significantly higher in patients with CP (4.3 ± 2.4 kPa) than in healthy controls (2.8 ± 1.1 kPa; p = 0.001). Among the patients with CP, values were significantly higher when the disease was of longer duration (for > 10 years, 5.8 ± 4 kPa; for ≤ 10 years, 3.9 ± 1.5 kPa; p = 0.01), when patients were taking long-term analgesic drugs (6.0 kPa vs. 3.5 kPa, p < 0.05), and in patients with lower body weight (r = −0.38; p < 0.05). They concluded that using ElastPQ to measure SWV is promising and reproducible in assessing pancreatic stiffness, which mainly reflects disease length and severity.
Kuwahara et al. [36] also used ElastPQ to measure SWV with an iU22 ultrasound system (Philips Healthcare, Bothell, WA, USA), using a convex probe (C5-1). They investigated 85 patients with known or suspected CP that was categorized into the four grades of the Rosemont classification and into three stages according to the 2009 clinical diagnostic criteria of the Japan Pancreas Society, which were based on EUS measurements for the diagnosis of CP. SWV was measured five times in the pancreatic parenchyma in each study participant, and the median value was defined as the pancreatic elastic modulus. Kuwahara et al.’s [36] results showed that the pancreatic elastic modulus was significantly correlated with Rosemont classification grade (r = 0.54), Japan Pancreas Society stage (r = 0.41), and the number of EUS features (r = 0.47). The area under the ROC curve for the accuracy of SWV measurement (consistent with CP and suggestive of CP vs. normal and indeterminate for CP) was 0.77 (with 77.1% sensitivity, and 64.9% specificity). Kuwahara et al. [36] concluded that shear wave elastography may be used to diagnose CP noninvasively and objectively.
In an unpublished study, we used an iU22 ultrasound system to measure SWV, but with a convex probe (C5-1) in ElastPQ mode for CP (Fig. 5). We investigated whether SWV could help diagnose early-stage CP. Shear wave elastography was performed at least five times in each patient for the pancreatic parenchyma, and the median of five repeated measurements was defined as the pancreatic elastic modulus, as in Kuwahara et al.’s study [36]. The participants in the study were outpatients, and early-stage CP was suspected before diagnosis in 42 patients who had two or more Japan Pancreas Society clinical criteria for early-stage CP (Fig. 6) [37].
Principle of shear wave elastography. To generate a shear wave, ultrasonic waves are focused on the position adjacent to the region of interest (ROI), and then, the detection pulse is used to measure the shear wave velocity (SWV). The relationship between SWV and Young’s modulus is expressed by the formula E≒3Vs2, and it is possible to calculate the elastic modulus as an absolute value by measuring the SWV.
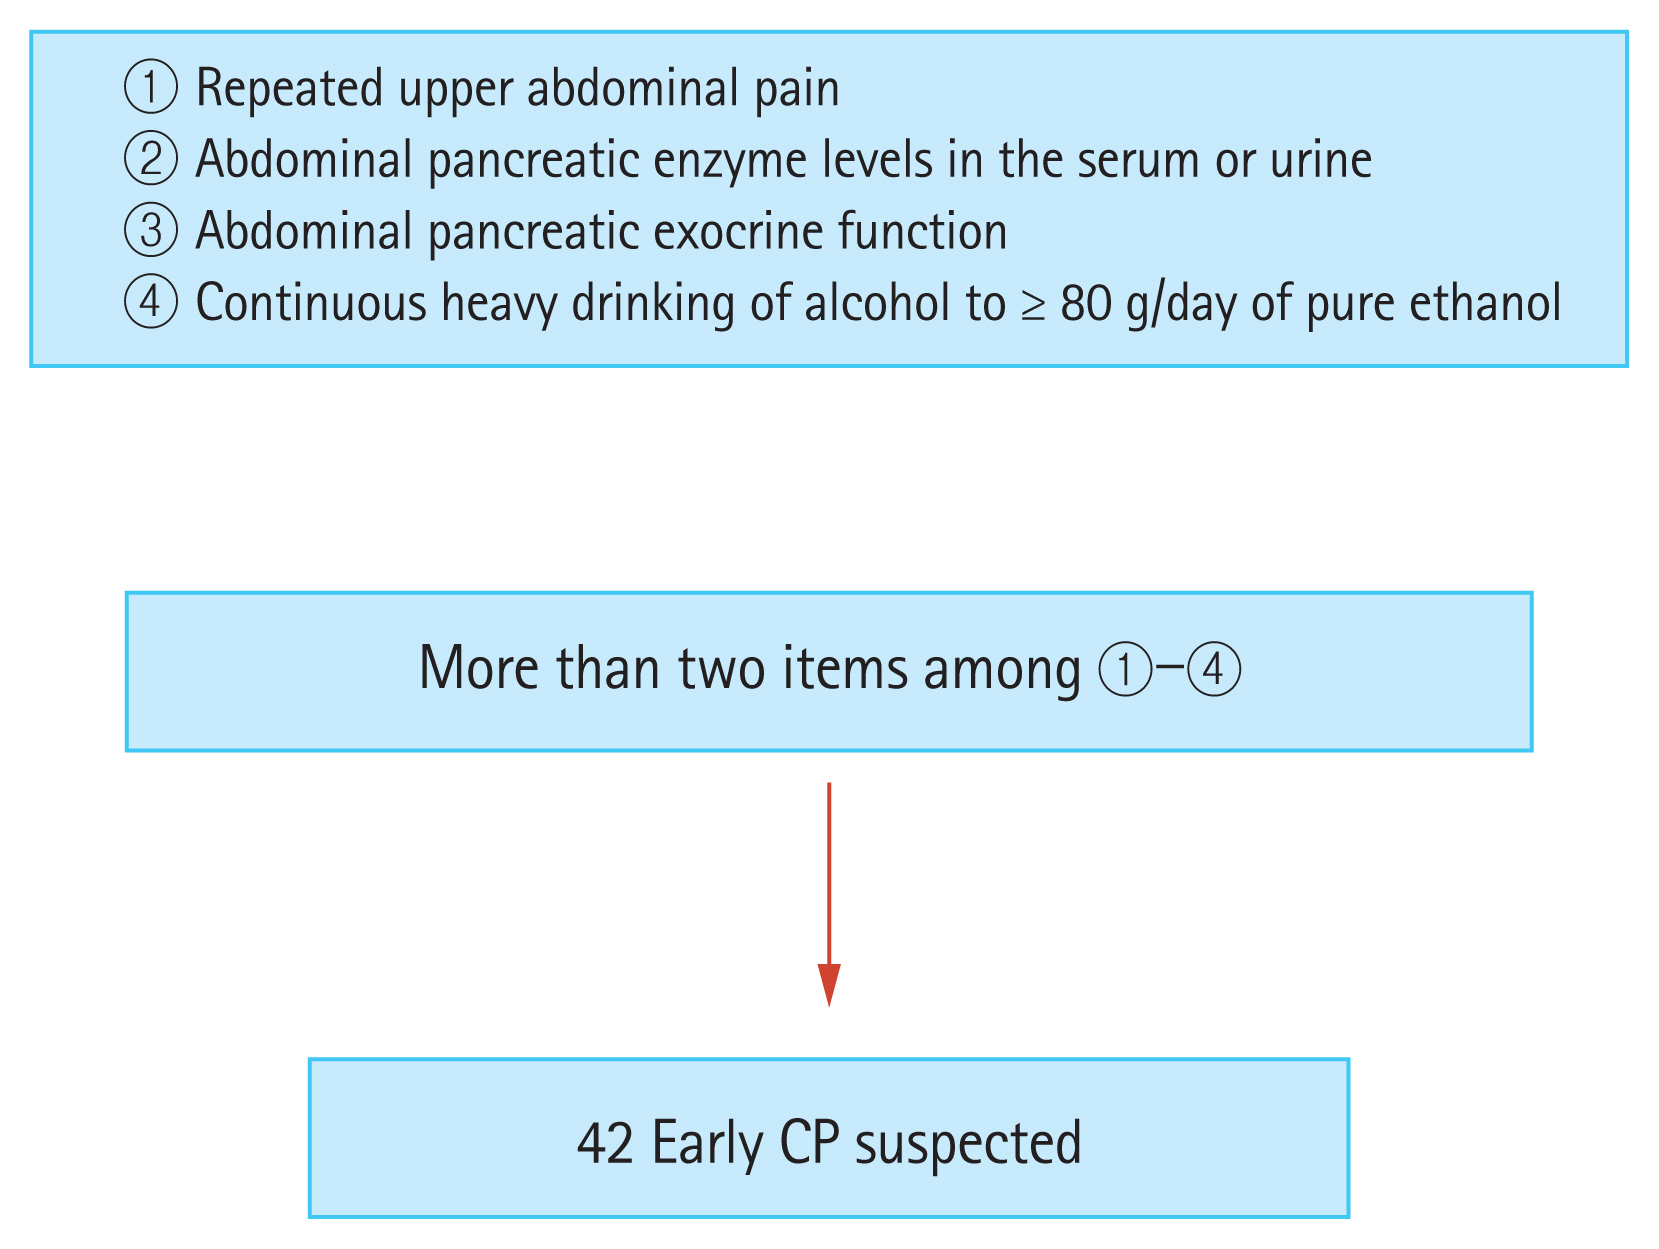
The clinical criteria for diagnosing early-stage chronic pancreatitis (CP). The study included 42 patients with suspected early-stage chronic pancreatitis who had two or more of these diagnostic criteria (according to Japan Pancreas Society clinical diagnostic criteria 2009).
First, we measured SWV in the 42 patients with suspected early-stage CP. The cutoff value for early-stage CP calculated by the ROC analysis was 4.44 kPa. A higher value was predictive of early CP, and a lower value indicated possible CP. Next, EUS and endoscopic retrograde cholangiopancreatography (ERCP) were performed for the final diagnosis; when findings met the diagnostic criteria, early-stage CP was diagnosed, and when the findings did not, possible CP was diagnosed (Fig. 7).
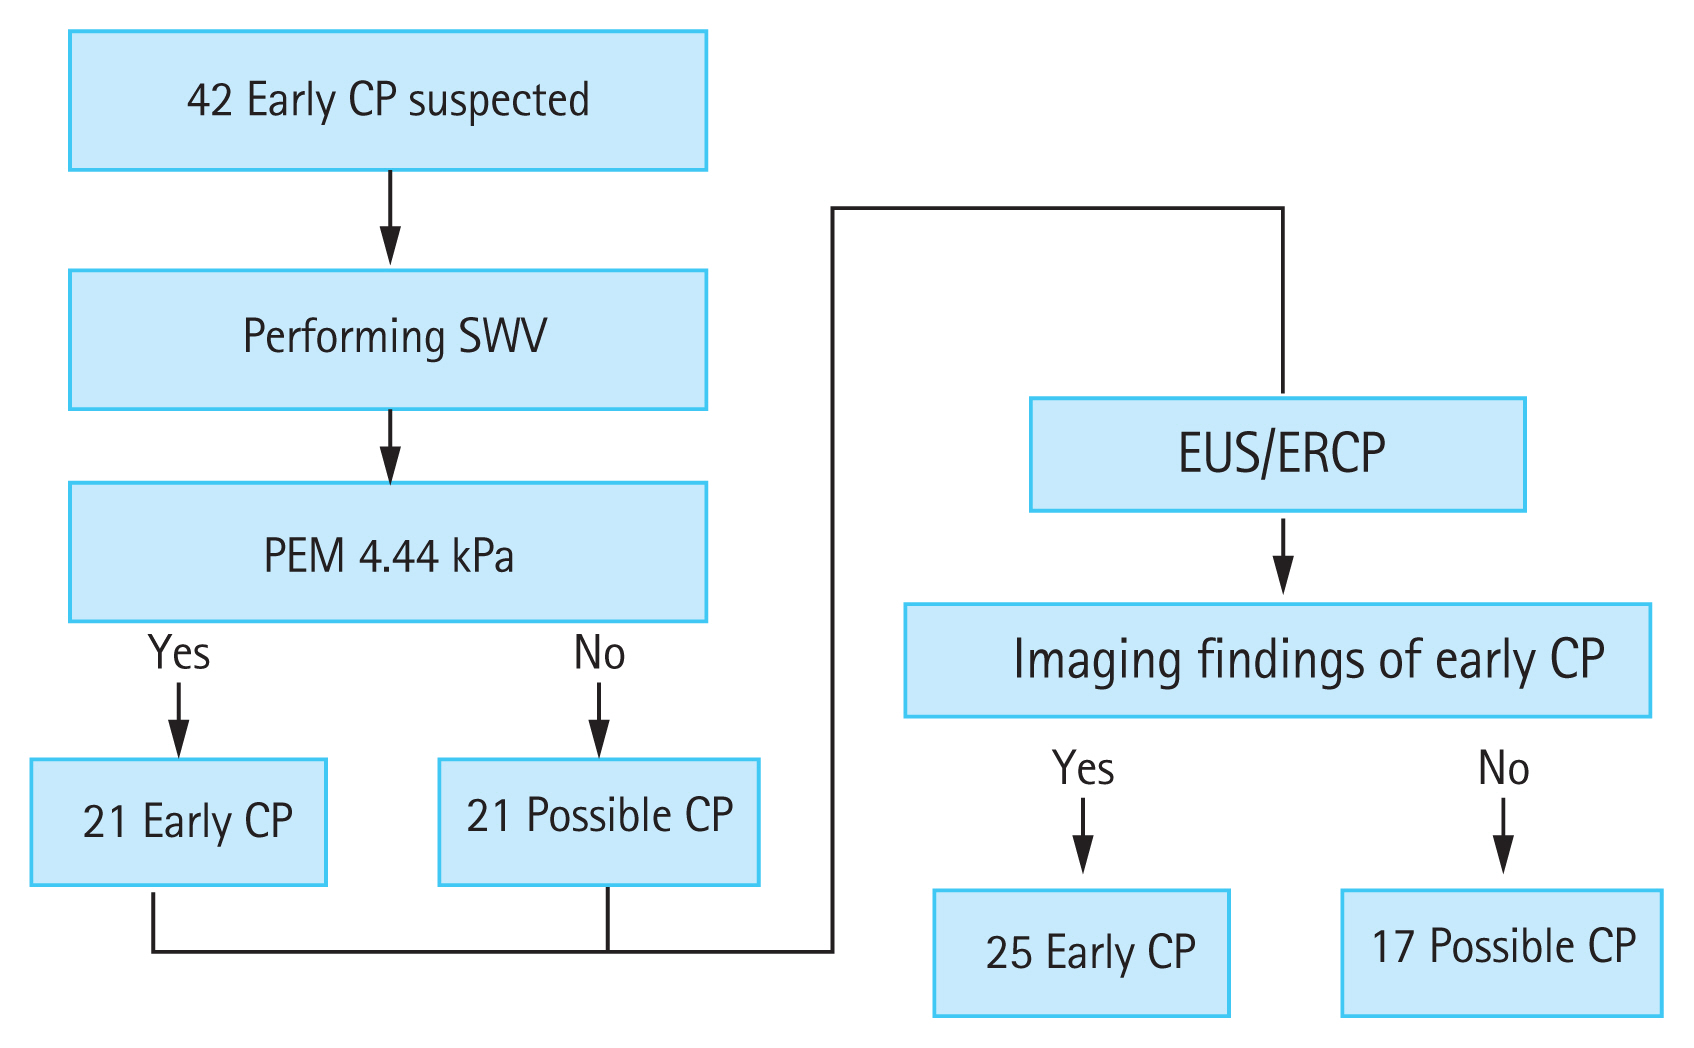
Cutoff value for early-stage chronic pancreatitis (CP) calculated by receiver operating characteristic analysis was 4.44 kPa. A value higher than 4.44 kPa indicated early-stage CP, and a lower value indicated possible CP. Endoscopic ultrasonography (EUS) and endoscopic retrograde cholangiopancreatography (ERCP) were performed for the final diagnosis. Cases in which findings met the diagnostic criteria were diagnosed as early-stage CP, and cases that did not were diagnosed as possible CP. SWV, shear wave velocity; PEM, pancreatic elastic modulus.
The diagnostic accuracy of EUS/ERCP with SWV had 76% sensitivity and 88% specificity, and the rate of correct diagnosis was 81% rate (Table 2). We concluded that SWV could be used to diagnose CP with high accuracy and could also contribute to the diagnosis of early-stage CP.
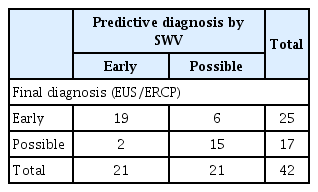
Comparison of EUS and ERCP with that of SWV in diagnosing early-stage chronic pancreatitis
CHANGES IN THE PANCREAS WITH AGING
Examination with EUS elastography and histogram analysis [38,39] has shown that the hardness of the pancreas itself increases with age. Aging will definitely become a confounding factor in the examination of the pancreas with ultrasonography/EUS elastography in the future.
CONCLUSIONS
We demonstrated the capability in the diagnosis of chronic pancreatitis and its stages using elastography through two steps evaluation. There are many types of elastographies and evaluation methods (both ultrasonography and endoscopic ultrasonography), and the diagnostic ability for chronic pancreatitis tumors is high for each evaluation method. Confounding factors, such as aging, should be taken into account for the thorough understanding of chronic pancreatitis and further study is needed.
Notes
No potential conflict of interest relevant to this article was reported.