Insufficient early renal recovery and progression to subsequent chronic kidney disease in living kidney donors
Article information
Abstract
Background/Aims
Renal recovery of a kidney donor after undergoing nephrectomy though challenging is essential. We aimed to examine the effect of estimated glomerular filtration rate (eGFR) percent change at 1-month post-donation on insufficient kidney function after kidney donation.
Methods
A total of 3,952 living kidney donors who underwent donor nephrectomy from 1982 to 2019 from eight different tertiary hospitals in Korea were initially screened. Percent changes in the eGFR from baseline to 1-month post-donation were calculated. The degree of percent changes was categorized by quartile, and the 1st quartile was regarded as the group with the lowest decreased eGFR at 1-month after donation. The remaining eGFR less than 60 mL/min/1.73 m2 was the end-point. The Cox proportional hazard model was used for evaluating the impact of initial eGFR and eGFR percent change at 1-month post-donation on the condition with remaining eGFR < 60 mL/min/1.73 m2. In the multivariate analysis, we used variables with a p < 0.1 in the univariate analysis.
Results
A total of 1,585 donors were included in the analysis. During 62.2 ± 49.3 months, 13.7% of donors showed renal insufficiency. The 4th (adjusted hazard ratio [aHR], 10.41; 95% confidence interval [CI], 5.15 to 21.04) and the 3rd (aHR, 4.29; 95% CI, 2.15 to 8.56) quartiles of percent change in eGFR and the pre-donation eGFR (aHR, 0.90; 95% CI, 0.88 to 0.92) were associated with the development of renal insufficiency.
Conclusions
The impact of worse initial renal recovery on renal insufficiency was pronounced in donors with lower pre-donation eGFRs. Additionally, worse initial renal recovery of remaining kidney affected the long-term development of renal insufficiency in kidney donors.

INTRODUCTION
Live kidney donation has increased correspondingly with the growing incidence of end-stage kidney disease (ESKD) worldwide. Live donor kidney transplantation is believed to have a considerable benefit for recipients in terms of preserving lives, relieving uremic comorbidities, and improving the quality of life. On the contrary, kidney donor needs to be considered that about one-third of kidney function is lost permanently after donor nephrectomy [1]. Although the 15-year risk of kidney failure was reported to be < 1% for most donors, previous studies have demonstrated a > 8-fold higher risk of post-donation ESKD in living kidney donors than in healthy controls satisfying the donor eligibility criteria [2–4].
In any case, the kidney function of living donors immediately falls following nephrectomy in spite their initially sufficient kidney function. Compensatory hyperfiltration leads to the restoration of kidney function subsequently within several months or years [5,6]. Kidney function recovery with compensatory hyperfiltration after donor nephrectomy appears to be related to kidney reserve, which is defined as an elevation in the glomerular filtration rate (GFR) above basal fasting values induced by a high-protein diet, amino acid or dopamine infusion, and acute kidney injury [7,8].
In general, the degree of kidney function recovery after acute kidney injury may affect the long-term adverse kidney outcome [9]. Although donor nephrectomy has different pathophysiology from the acute kidney injury, it is also consisted in the iatrogenic loss of kidney function. Therefore, these compensatory hyperfiltration could affect long-term kidney function. Pre-donation kidney function has been used as a fundamental indicator for kidney donation [10], but there is limited data on adequate post-donation renal recovery for the prediction of long-term remaining kidney function. In this regard, it needs to identify the clinical implications of early post-donation renal recovery in living kidney donors. This could provide a basis for the development of interventions to prevent ESKD after live kidney donation.
In this regards, we aimed to evaluate the impact of baseline kidney function and kidney function recovery 1-month post-donation on long-term kidney outcomes.
METHODS
Study population
This study consisted of patients from eight different tertiary hospitals in Korea. A total of 3,952 living kidney donors who underwent donor nephrectomy from 1982 to 2019 were initially screened. Donors without data on pre-donation estimated glomerular filtration rate (eGFR), with incomplete data on 1-month eGFR, or who were followed up for less than 1-year were excluded from the study (Supplementary Fig. 1).
Data source and acquisition
We collected data, including demographic information such as age, sex, height, weight, and systolic blood pressure. The body mass index was classified according to the Asia-Pacific guidelines: underweight (< 18.5 kg/m2), normal (18.5–22.9 kg/m2), overweight (23.0–24.9 kg/m2), and obese (≥ 25 kg/m2) [11]. Laboratory variables consisted of plasma hemoglobin, serum creatinine (sCr), calcium, phosphorus, glucose, uric acid, total cholesterol, and albumin levels. All data were collected based on the date of donation using electronic medical records from each institution. Information on whether living kidney donors showed progression to ESKD or not was initially collected from electronic medical records, and this information was additionally obtained from the Korean Society of Nephrology ESKD registry [12].
Definitions and clinical parameters
Kidney function was determined by eGFR based on the Chronic Kidney Disease Epidemiology Collaboration equation [13]. We defined ‘renal recovery status’ as the change in percentage from pre-donation eGFR to eGFR 1-month post-donation. To investigate the impact of baseline eGFR and eGFR changes on the clinical outcome, we divided eGFR into the four groups based on the quartile range. For the baseline eGFR, 1st quartile represented the lowest eGFR at donation. For the eGFR changes, the lowest (1st) quartile represented lowest decreased eGFR at 1-month after donation. The primary outcome was the condition with remaining eGFR < 60 mL/min/1.73 m2; it was calculated by using the last follow-up sCr levels and age. Then, we identified the relative risk factor including the eGFR percent change at 1-month post-donation for the remaining eGFR < 60 mL/min/1.73 m2. Finally, we evaluated the mixed effect of baseline eGFR and eGFR percent change at 1-month post-donation where the remaining eGFR < 60 mL/min/1.73 m2. In the mixed model, each groups were defined based on the initial eGFR and eGFR percent change at 1-month post-donation as follows; Group 1, 3rd and 4th quartile in initial eGFR with 1st and 2nd quartile in eGFR change; Group 2, 3rd and 4th quartile in initial eGFR with 3rd and 4th quartile in eGFR change; Group 3, 1st and 2nd quartile in initial eGFR with 1st and 2nd quartile in eGFR change; Group 4, 1st and 2nd quartile in initial eGFR with 3rd and 4th quartile in eGFR change.
Statistical analyses
To compare the baseline characteristics according to the quartile ranges of eGFR at 1-month post-donation, we employed the analysis of variance (ANOVA) and chi-square tests. We demonstrated unweighted linear terms for trends between groups in the ANOVA. Post hoc analysis was performed by Bonferroni method. Continuous variables were expressed as means with standard deviations, and categorical variables were expressed as numbers with percentages. Two-sided p values were derived by setting the significance level at 0.05. The Cox proportional hazard model was used for evaluating the impact of initial eGFR and eGFR percent change at 1-month post-donation on the condition with remaining eGFR < 60 mL/min/1.73 m2. The variables used were as follows: age, sex, systolic blood pressure, body mass index, serum hemoglobin, calcium, phosphorus, glucose, uric acid, cholesterol, albumin, initial eGFR, and eGFR percent change from pre-donation to 1-month post-donation. Prior to the Cox regression analysis, all variables were found to satisfy the proportional hazard assumption. In the multivariate analysis, we used variables with a p < 0.1 in the univariate analysis. We performed a Kaplan-Meier analysis with a log-rank test to evaluating time to event. All statistical analyses were performed using SPSS version 20.0 (IBM Corp., Armonk, NY, USA).
Ethical considerations
This study was approved by the Institutional Review Board of each participating hospital (Seoul National University Hospital: H-1903-116-1019; Kyungpook National University Hospital: 2019-04-014; Keimyung University Dongsan Hospital: 2020-04-003; Jeonbuk National University Hospital: CUH-2019-05-068; Chonnam National University Hospital: CNUH-2019-163; Seoul National University Bundang Hospital: B-1905/540-402; Pusan National University Hospital: H-1905-018-079; Seoul Metropolitan Government Seoul National University Boramae Medical Center: 20190422/30-2019-28/053). The study was conducted in accordance with the principles of the Declaration of Helsinki. Written informed consent by the patients was waived due to a retrospective nature of the current study.
RESULTS
Study population
After excluding the ineligible subjects, 1,585 donors were finally included in the study (Fig. 1). The baseline characteristics of the included and excluded subjects are presented in Supplementary Table 1. The excluded subjects showed younger age and higher serum phosphorus, lower serum uric acid, lower total cholesterol, and lower serum albumin levels. There was no statistical difference in the pre-donation eGFR between the two groups. In addition, several excluded subjects had donated their kidney before the year 2000. After stratifying the period of donation by decade, 54.0% (n = 333/617) of donors in the 2000 to 2009 period and 11.8% (n = 105/892) of donors in the 2010 to 2019 period had no available data on the eGFR 1-month post-donation, respectively.

Flow diagram of kidney donor enrollment. eGFR, estimated glomerular filtration rate.
Renal recovery after donation
Among the included donors, the mean pre-donation eGFR was 99.1 ± 15.2 mL/min/1.73 m2, and the mean eGFR at 1-month post-donation was 67.7 ± 14.8 mL/min/1.73 m2. The changes in percent change in the mean eGFR from baseline to 1-month after donor nephrectomy was 68.6% ± 12.2%. These values were divided into quartiles, and the first quartile was regarded as the lowest decrease in eGFR post-donation, ranging from 74.7% to 141.6%. The second, third, and fourth quartiles (based on the initial eGFR) were represented as 66.6%–74.7%, 60.9%–66.6%, and 39.8%–60.9%, respectively.
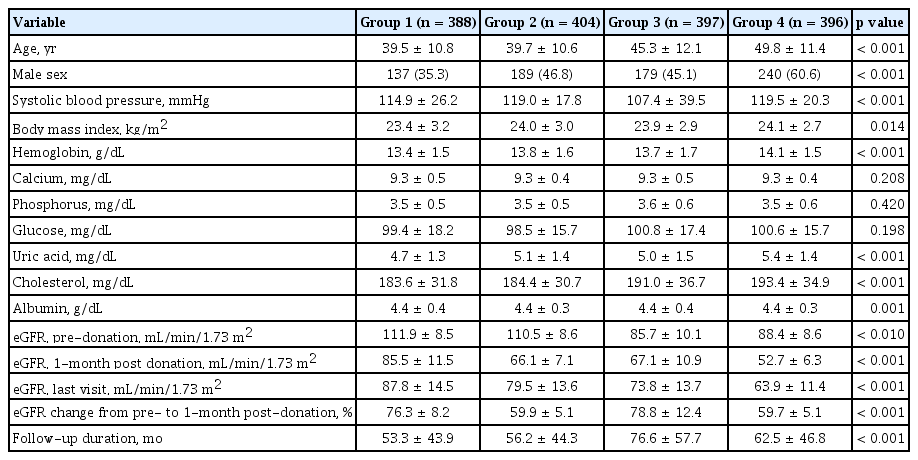
Comparisons between baseline characteristics of live kidney donors (according to the quartile ranges of eGFR percent change at 1-month post-donation) revealed that renal recovery was more insufficient in the older donors and, more common in men than in woman. Furthermore, it was associated with higher systolic blood pressure, more obese, higher serum hemoglobin, and higher serum uric acid levels. The greater decrease in eGFR at 1-month post-donation was detected in the donors who had a lower post-donation eGFR (Table 1). The result for the post-hoc analysis is represented in the Supplementary Table 2. The pre-donation eGFR varied, according to the quartiles of eGFR percent changes at 1-month post-donation, although not in a dose-responsive manner (Fig. 2).

Comparison of baseline characteristics according to the quartiles of renal recovery 1-month post-donation
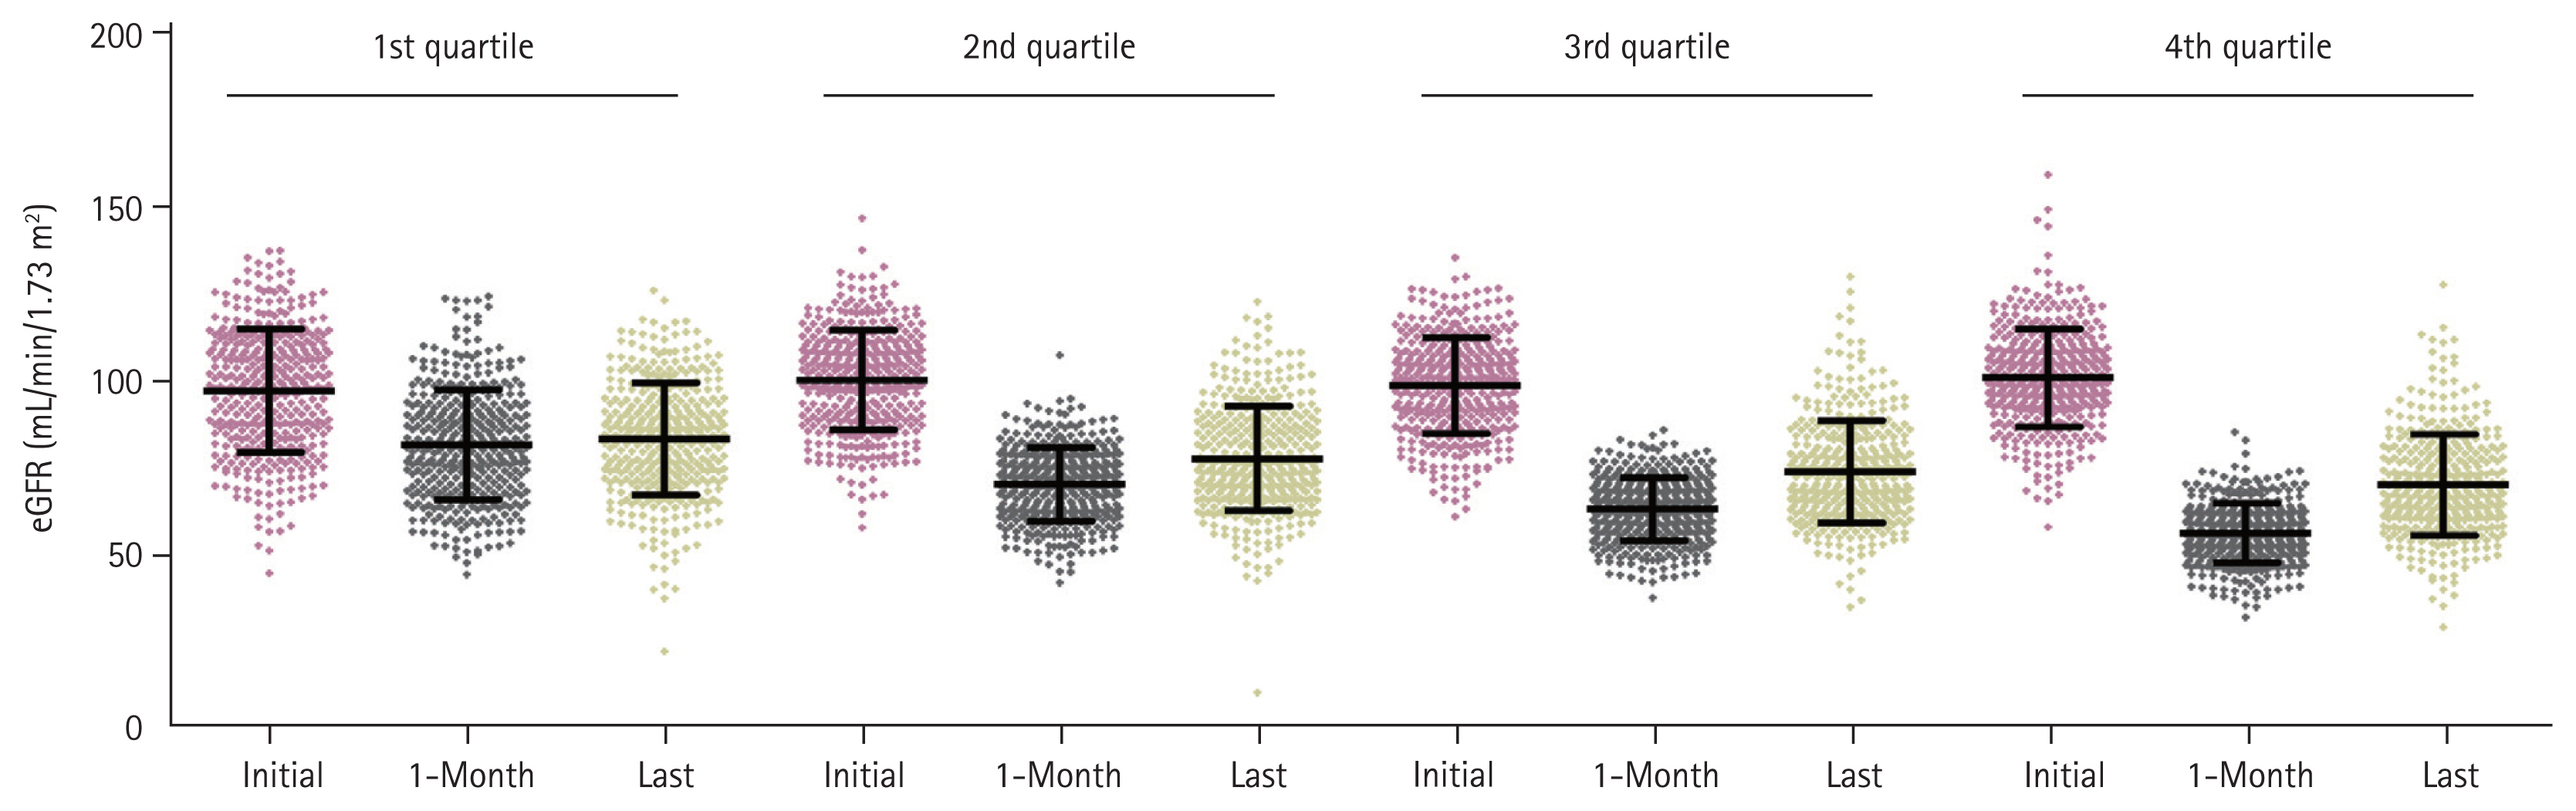
Distribution of estimated glomerular filtration rate (eGFR) at donation, 1-month, and the last visit according to the quartile of percent change on eGFR at 1-month post-donation. Quartile was defined based on the percent change of eGFR from baseline to 1-month, 1st quartile showed the lowest decreased eGFR at 1-month, and 4th quartile showed highest decreased eGFR at 1-month after donation.
Risk factors associated with insufficient renal recovery
Next, we examined the clinical risk factors associated with worse renal recovery after kidney donation. Every 1-year increase in age increased the risk for insufficient renal recovery by 3% (adjusted hazard ratio [aHR], 1.03; 95% confidence interval [CI], 1.02 to 1.05). The male sex was associated with a 44% increased risk for insufficient renal recovery in comparison with the female sex (aHR, 1.44; 95% CI, 1.01 to 2.05). In addition, an increment of 1 mg/dL in the serum uric acid level increased the risk for insufficient renal recovery by 16% (aHR, 1.16; 95% CI, 1.04 to 1.29). Lastly, an increase of 1 mL/min/1.73 m2 in pre-donation eGFR increased the risk for insufficient renal recovery at 1-month post-donation by 2% (aHR, 1.02; 95% CI, 1.01 to 1.03) (Supplementary Table 3).
Development of the condition with remaining eGFR < 60 mL/min/1.73 m2 after donation
There were 217 (13.7%) donors who showed the condition with remaining eGFR < 60 mL/min/1.73 m2 during the follow-up period. Among them, 193, 21, 2, and 1 patient showed CKD stage 3a, 3b, 4, and 5, respectively. None of the patients required renal replacement therapy in the included population. In the comparison between the subjects with eGFR < 60 mL/min/1.73 m2 and eGFR ≥ 60 mL/min/1.73 m2, those with eGFR < 60 mL/min/1.73 m2 showed the following characteristics: older age, male sex, greater proportion of lower body weight and obesity, higher serum hemoglobin, glucose, uric acid, cholesterol, and lower phosphorus levels, lower pre-donation eGFR, and greater change in eGFR at 1-month post-donation (Supplementary Table 4).
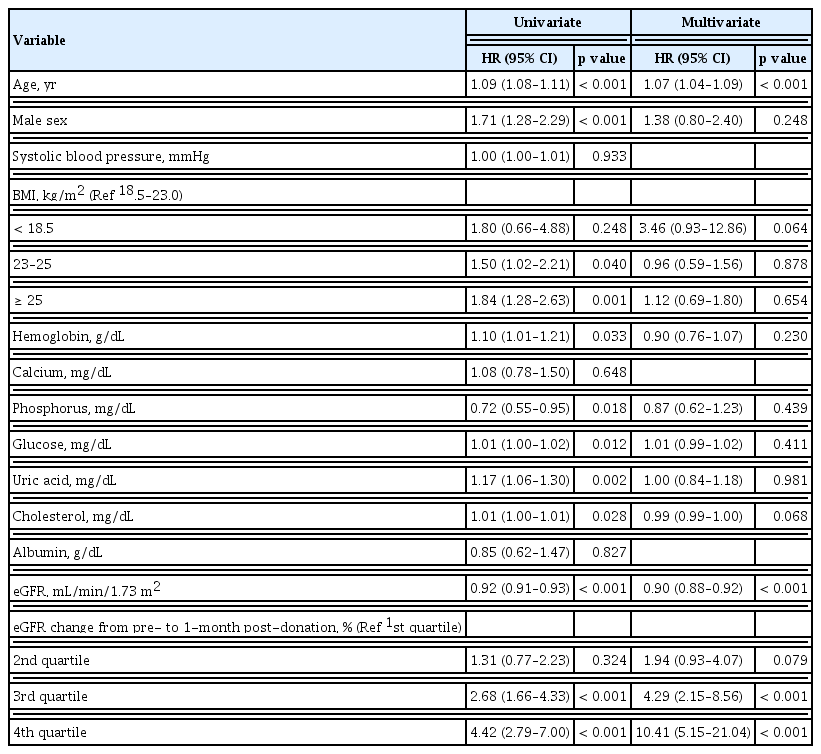
Pre-donation eGFR was negatively associated with the condition with remaining eGFR < 60 mL/min/1.73 m2 after donation. Every 1 mL/min/1.73 m2 increase in the pre-donation eGFR lowered the risk for the development of the condition with remaining eGFR < 60 mL/min/1.73 m2 by 10% (aHR, 0.90; 95% CI, 0.88 to 0.92; p < 0.001) (Table 2). When the pre-donation eGFR was divided by quartiles, a clear difference was observed between the 2nd and the 3rd quartile groups; the median value of eGFR was 99.6 mL/min/1.73 m2 (Supplementary Fig. 2).
Risk factors associated with the development of the condition with remaining eGFR < 60 mL/min/1.73 m2
During the follow-up period of 62.2 ± 49.3 months, the condition with remaining eGFR < 60 mL/min/1.73 m2 free survival rate tended to decrease as the higher quartiles of the eGFR change at 1-month post-donation compared with the pre-donation level (p < 0.001) (Fig. 3). After the multivariate adjustment for pre-donation clinical factors, worse renal recovery, in the 3rd and the 4th quartiles of percent change in eGFR from pre-donation to 1-month post-donation, was associated with increased risk for the condition with remaining eGFR < 60 mL/min/1.73 m2 after donation (3rd quartile: aHR, 4.29; 95% CI, 2.15 to 8.56; p < 0.001; 4th quartile: aHR, 10.41; 95% CI, 5.15 to 21.04; p < 0.001, respectively) (Table 2).

Cumulative rate free from renal insufficiency according to the quartile of estimated glomerular filtration rate (eGFR) change at 1-month post-donation. The lowest (1st) quartile represented lowest decreased eGFR at 1-month after donation.
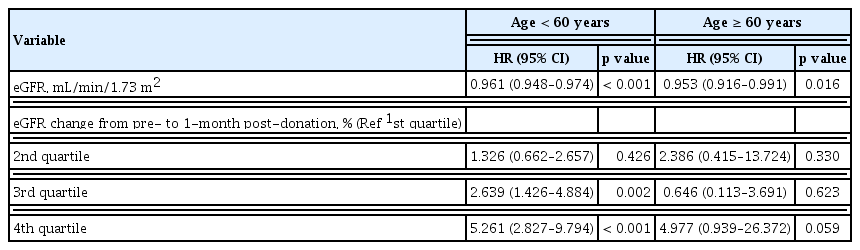
As expected, every 1-year increase in age elevated the risk for the condition with remaining eGFR <60 mL/min/1.73 m2 by 7% (aHR, 1.07; 95% CI, 1.04 to 1.09). To evaluate the impact of renal recovery on the development of the condition with remaining eGFR < 60 mL/min/1.73 m2 according to the age, we divided group by age 60. A greater changed in eGFR percent at 1-month post-donation was significant risk factor for the condition with remaining eGFR < 60 mL/min/1.73 m2 in age less than 60. On the contrary, initial eGFR was still showed statistical significance for the condition with remaining eGFR < 60 mL/min/1.73 m2 in both age groups (Table 3).
Impact of compensatory hyperfiltration for the development of the condition with remaining eGFR < 60 mL/min/1.73 m2 according to age 60 years
Pre-donation eGFR vs. eGFR percent change at 1-month post-donation in the development of the condition with remaining eGFR < 60 mL/min/1.73 m2
Based on the previous statements, we found that both lower pre-donation eGFR and less renal recovery were associated with insufficient kidney function. According to the quartile range of the pre-donation eGFR, a greater eGFR was significantly associated with a greater 1-month post-donation eGFR and last eGFR (Supplementary Table 5). Because of the sequential interaction between pre-donation eGFR and eGFR percent change at 1-month post-donation, we further stratified both variables using a dichotomized value in each.
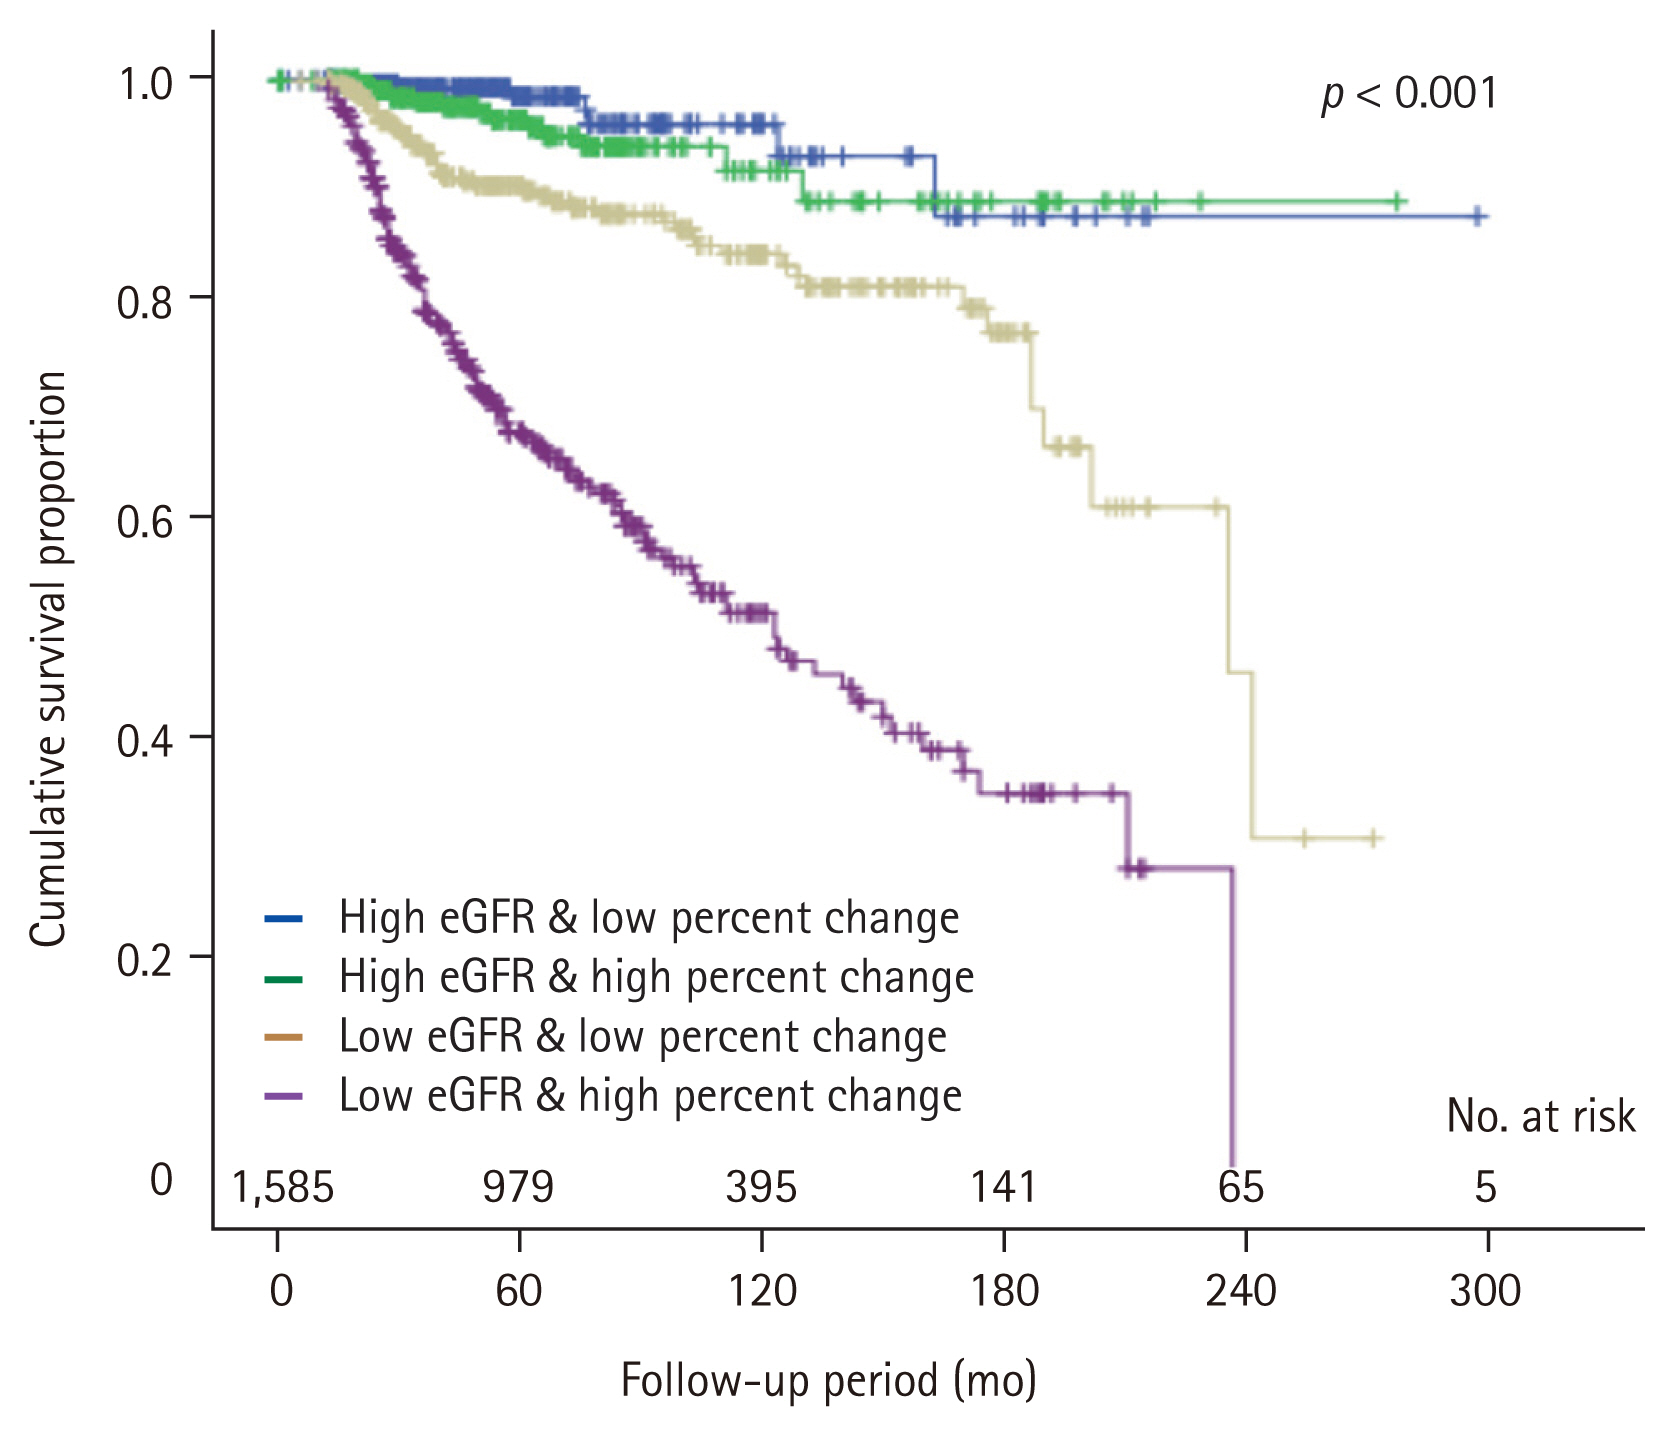
We demonstrated the baseline characteristics according to the four sequential groups in the Table 4. The result for the post-hoc analysis was represented in the Supplementary Table 6. Group 2 and 3 showed different initial eGFR, but the eGFR percent change at 1-month post-donation was similar. Interestingly, group 4 showed a significantly higher initial eGFR, but lower last eGFR than group 3. It was directly related to the degree of renal recovery. As shown in Fig. 4, a higher number of decreased eGFR at 1-month after donation (the 3rd and the 4th quartiles in eGFR change) did not affect long-term insufficient kidney function in donors with higher pre-donation eGFR (Group 1 vs. 2). However, it significantly affected the long-term kidney function of living donors with a lower pre-donation eGFR (Group 3 vs. 4) (Fig. 4).
Comparison of baseline characteristics according to mixed model using initial eGFR and eGFR percent change at 1-month post-donation
Cumulative rate free from renal insufficiency according to the quartile of estimated glomerular filtration rate (eGFR) change at 1-month post-donation.
DISCUSSION
A decreased eGFR after kidney donation is an inevitable outcome among living kidney donors. Although post-donation eGFR could affect the long-term kidney outcome, there is no consensus on the evaluation of adequate recovery of remaining kidney at a specific time point and the management of the associated factors. In this regard, this study investigated the significance of the eGFR percent change at 1-month after donation in the development of the condition with remaining eGFR < 60 mL/min/1.73 m2.
After nephrectomy, the eGFR could be theoretically decreased to half of the baseline eGFR, and the process of renal hyperfiltration determines the degree of renal recovery. A recent study reported on the impact of early post-donation kidney function using the 6-month post-donation eGFR as a relative factor for the development of ESKD [14]. From another perspective, we also assessed the impact of post-donation eGFR as a renal recovery for long-term kidney outcomes. Kidney functional adaptation may occur within a few months and kidney damage over 3 months can be considered as a chronic change [15]. Indeed, most donors show a plateau of increased eGFR within several months [16]. In this regard, we used the eGFR percent change at 1-month post-donation as a marker for early renal recovery.
After donor nephrectomy, the eGFR recovered by > 90% compared to the pre-donation eGFR in some donors, while others did not show an increase in eGFR compared to the immediate post-donation eGFR. The kidney functional reserve was represented as a difference between the baseline eGFR and the peak eGFR after exposure to stress conditions such as a high-protein diet, acute kidney injury, pregnancy, and nephrectomy status [7]. A decrease in kidney functional reserve implies a loss of physiological adaptability, which is common in elderly subjects and subjects with a higher baseline eGFR [17]. Kidney functional reserve was closely linked to the eGFR percent change at 1-month post-donation in living kidney donors. According to the present study, the degree of eGFR percent change at 1-month post-donation affect to long-term insufficient kidney function. However, this impact was more pronounced in younger age group. Considering quite donors are young aged populations, an effort for evaluation and assessment of kidney function after donor nephrectomy is needed to improve the long-term kidney outcome for a donor.
Pre-donation eGFR is a critical factor affecting the long-term kidney outcome. In contrast to the findings of a recent report [14], a higher eGFR at donation was regarded as a favorable factor for long-term kidney outcomes in another study [18–20]. Similarly, we also identified that a higher eGFR at donation decreased the risk for the development of the condition with remaining eGFR < 60 mL/min/1.73 m2. In addition, following the result of the mixed model consisting of the pre-donation eGFR and eGFR percent change at 1-month post-donation, the pre-donation eGFR showed a more powerful association with the condition with remaining eGFR < 60 mL/min/1.73 m2 after donation. Nevertheless, in subjects with lower baseline eGFR, the degree of eGFR percent change at 1-month post-donation had a critical role for the development of the condition with remaining eGFR < 60 mL/min/1.73 m2 after donation in this study.
Indeed, Rook et al. [21] reported that post-donation eGFR was best predicted by the baseline eGFR, kidney functional reserve representing the maximum GFR, and age. In our study, the pre-donation eGFR, quartile range of eGFR percent change at 1-month post-donation, and age were found to be significant factors associated with long-term kidney outcome. Moreover, the kidney functional reserve, represented by eGFR percent change at 1-month post-donation, had a more significant impact on the kidney outcome in subjects with a lower pre-donation eGFR than in those with a higher pre-donation eGFR. Therefore, subjects with an eGFR < 100 mL/min/1.73 m2 need to be monitored meticulously by evaluating the kidney functional reserve at pre-donation [22], and with regular follow-ups with a strict focus on lifestyle modifications post-donation.
This study demonstrated the impact of early renal recovery on long-term kidney outcomes based on the multi-center in Korea. Regular follow-up after the donation is important to improve long-term outcomes, but assessing the risk before donation also critical for a donor [23,24]. Suggesting the importance of these respects, we proposed an independent approach before deciding to donate especially in a potential donor with lower eGFR or younger age. However, there were several limitations to be considered in this study. First, it was a retrospective study, and the inclusion period was diverse according to the eight different institutions. Second, the follow-up duration was short to evaluate the hard outcome. Several decades ago, it was not common to follow-up regularly after donation, so quite a lot of donors were excluded in the study because of the lack of data. Third, we used estimated GFR, not measured GFR. Fourth, the method for measuring of sCr was not evaluated. These methodological limitations were related to the multicenter retrospective study design. Fifth, we did not evaluate a kidney functional reserve before donation; therefore, for the clinical implementation, this aspect needs to be investigated in further studies. Lastly, even we conducted this study with a large population using eight tertiary hospitals, no hard endpoints were available for evaluation. Considering the long-life expectancy of donors, it should be solved in future studies with a larger population, longer follow-up period.
In conclusion, in addition to pre-donation eGFR, eGFR percent change at 1-month post-donation is vitally important in evaluating the risk of the condition with remaining eGFR < 60 mL/min/1.73 m2 after donation. Earnest evaluation and management to reduce the risk factors for insufficient recovery of remaining kidney could be helpful in improving the long-term kidney outcomes of living kidney donors.
KEY MESSAGE
1. Renal recovery represented by the percent change in the estimated glomerular filtration rate (eGFR) from pre-donation to 1-month post-donation was associated with the remaining eGFR less than 60 mL/min/1.73 m2.
2. In particular, this renal recovery showed a significant role in donors with lower pre-donation eGFR.
3. Assessing early renal recovery may be a fundamental methodologic approach for improving long-term outcomes in living kidney donors.
Acknowledgments
We thank for acquisition and organization of data to Dr. Jung Nam An of the Department of Internal Medicine, Hallym University Sacred Heart Hospital, Anyang, Korea, and Dr. Jong Cheol Jeong of the Department of Internal Medicine, Seoul National University Bundang Hospital, Seongnam, Korea.
Notes
No potential conflict of interest relevant to this article was reported.