Effect of L-carnitine on quality of life in covert hepatic encephalopathy: a randomized, double-blind, placebo-controlled study
Article information

Abstract
Background/Aims
L-carnitine is potentially beneficial in patients with hepatic encephalopathy (HE). We aimed to evaluate the impact of L-carnitine on the quality of life and liver function in patients with liver cirrhosis and covert HE.
Methods
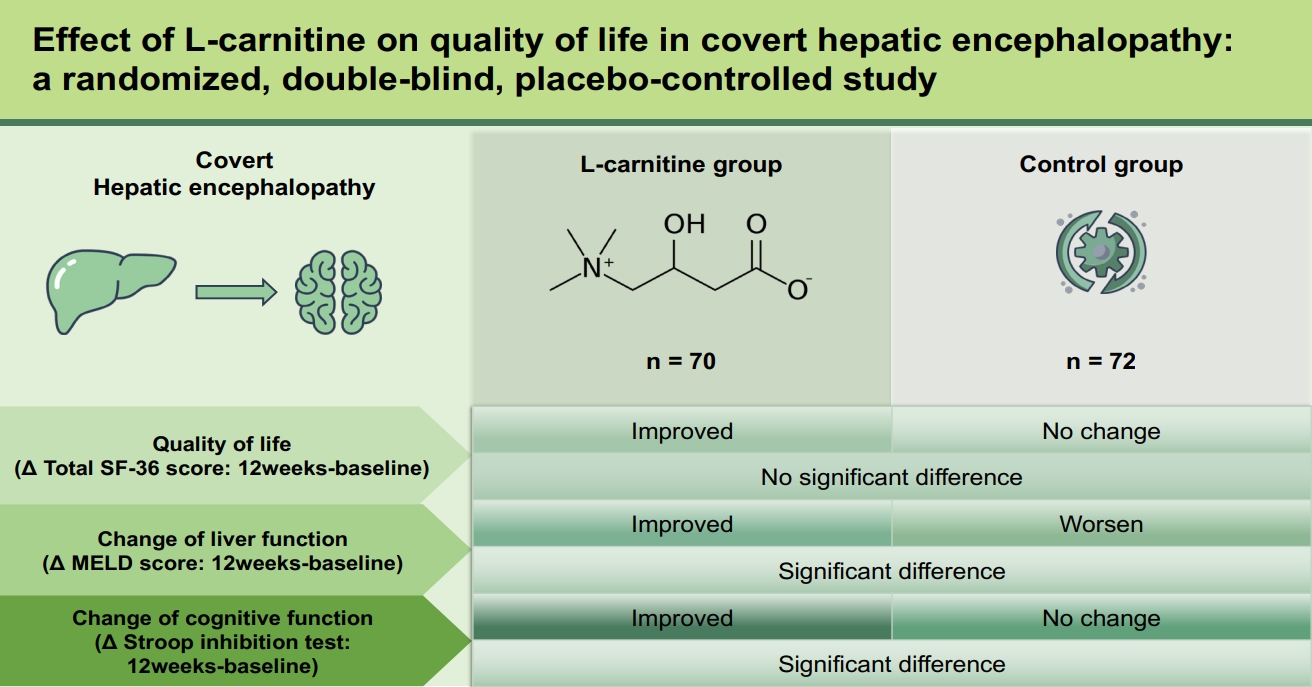
We conducted an investigator-initiated, prospective, multi-center, double-blind, randomized phase III trial in patients with covert HE. A total of 150 patients were randomized 1:1 to L-carnitine (2 g/day) or placebo for 24 weeks. Changes in quality of life and liver function were assessed at 6 months. The model for end-stage liver disease (MELD), the 36-Item Short Form Survey (SF-36), the psychometric hepatic encephalopathy score (PHES), and the Stroop Test were evaluated in all patients.
Results
The total SF-36 score significantly improved in the L-carnitine group after 24 weeks (difference: median, 2; interquartile range, 0 to 11; p < 0.001); however, these values were comparable between the two groups. Furthermore, there was a significant ordinal improvement in PHES scores among patients with minimal HE who were in the L-carnitine group (p = 0.007). Changes in the total carnitine level also positively correlated with improvements in the Stroop test in the L-carnitine group (color test, r = 0.3; word test, r = 0.4; inhibition test, r = 0.5; inhibition/switching test, r = 0.3; all p < 0.05). Nevertheless, the MELD scores at week 24 did not differ between the groups.
Conclusions
Twenty-four weeks of L-carnitine supplementation was safe but ineffective in improving quality of life and liver function.
INTRODUCTION
Patients with covert hepatic encephalopathy (HE), which includes West Haven grade I HE to minimal HE, have decreased cognitive functions, including attention, space-time, coordination, exercise speed, and reaction time [1,2]. Covert HE decreases the ability to work and increases the risk of job loss [3]. Additionally, it increases the risk of falls, fractures, and death [4]. Therefore, the early diagnosis of covert HE is important for timely intervention and prognosis in patients with liver cirrhosis. Lactulose and rifaximin have been shown to improve cognitive function and quality of life in covert HE [5]. Other treatment options are under investigation, including carnitine, probiotics, and L-ornithine-L-aspartate.
L-carnitine plays an important role in the transportation of long-chain fatty acids into the mitochondria [6] and activates the tricarboxylic cycle, hence inducing ureagenesis, and thereby reducing ammonia concentrations [7]. Several reports have suggested that carnitine has additional effects on chronic liver disease [8–10]. To date, there have been six clinical studies on carnitine use in patients with HE [11–16]. However, these studies have all been conducted by the same group. Moreover, their definition of covert HE and assessment of cognitive dysfunction were unclear. Furthermore, whether carnitine can improve quality of life or can have additional benefits in patients with covert HE has not yet been elucidated. We hence need more data based on double-blind studies with a larger cohort to draw a better conclusion on these issues.
Therefore, we performed a randomized, double-blind, placebo-controlled study, wherein we administered L-carnitine to patients with liver cirrhosis and covert HE and evaluated its effects on quality of life and liver function.
METHODS
Study design
This multicenter, double-blind, investigator-initiated, and phase III clinical trial (HELIOS study; registered at the Clinical Research Information Service; KCT0002029, https://cris.nih.go.kr/) was conducted at 13 academic centers in the Republic of Korea. Patients with covert HE were randomized 1:1 to receive L-carnitine or placebo for 6 months (Fig. 1).
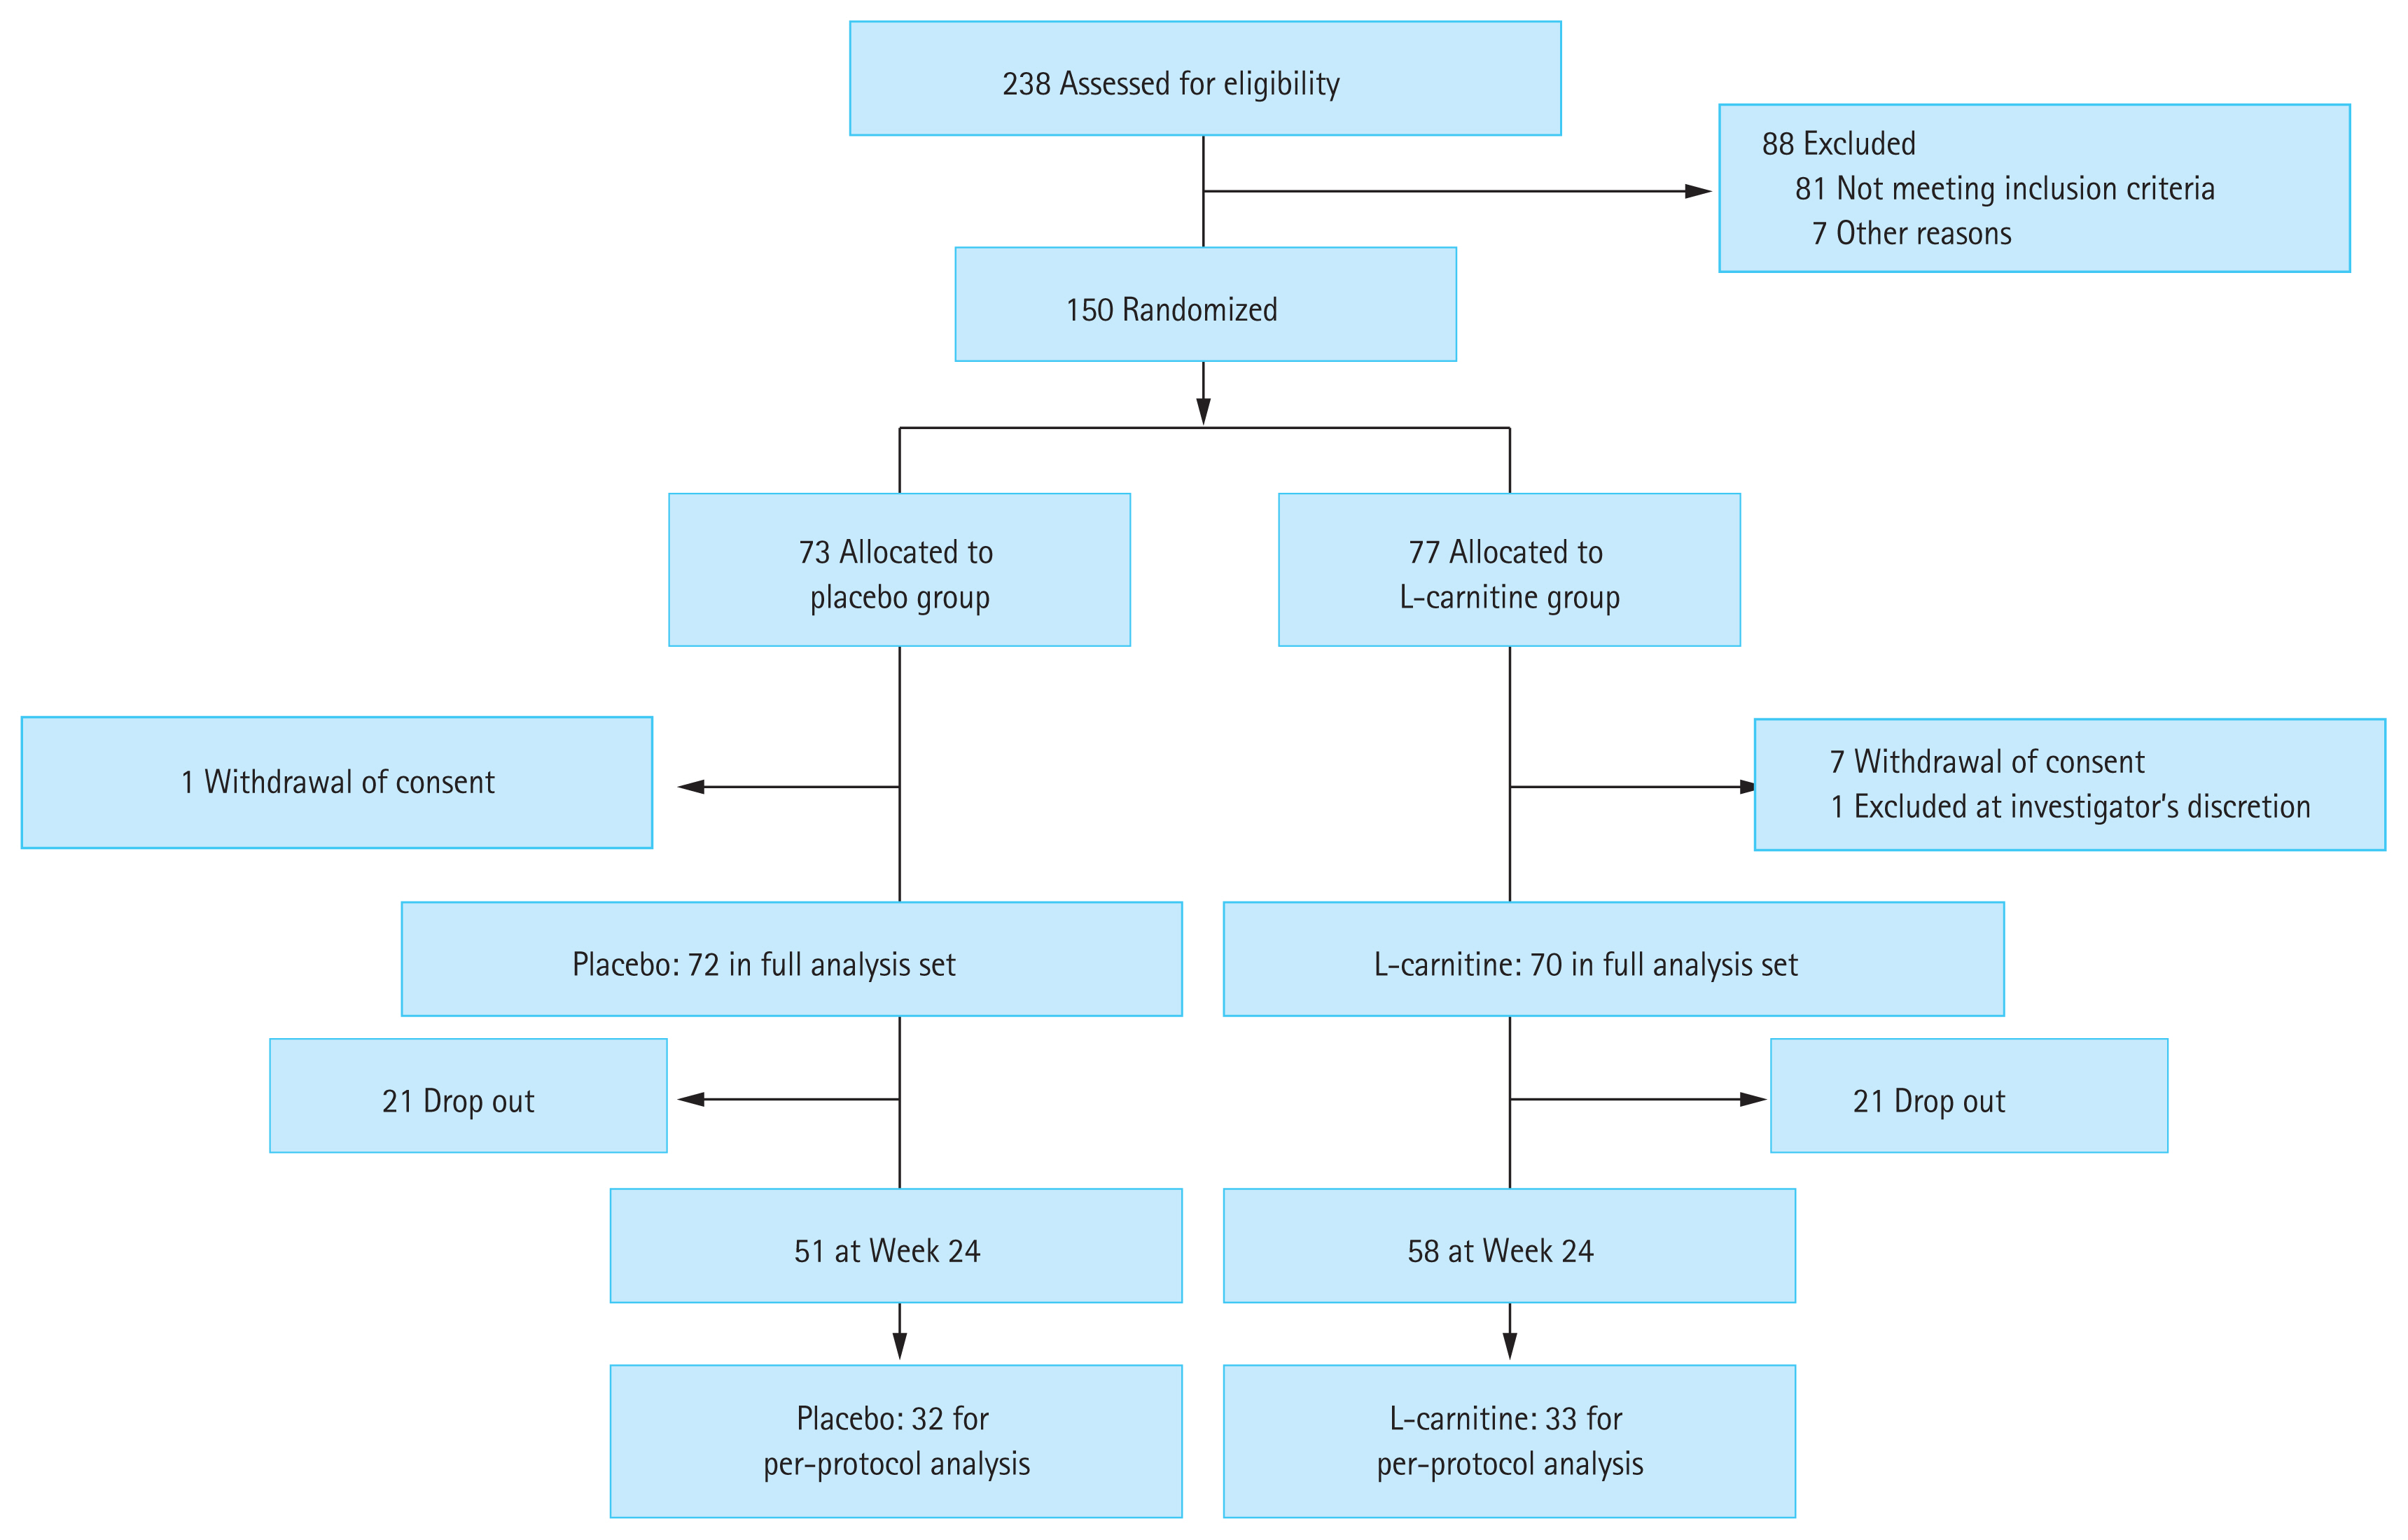
Flow chart of patient selection.
Randomization
Participants who met the inclusion criteria were registered in the trial via electronic data capture (a web-based registration system) and an interactive web-based response system (a web-based randomization system). A random allocation sequence was generated using a computer. Randomization was performed with the blocks stratified by the center and severity of liver disease (Child-Pugh A vs. B or C). Participant allocation was concealed from both the investigator and the participant.
Inclusion criteria
Thirteen academic centers in the Republic of Korea participated in this study. The inclusion criteria were as follows: (1) patients with liver cirrhosis aged 19 to 65 years and (2) diagnosed with covert HE. Liver cirrhosis was diagnosed through either liver biopsy or clinical findings, meeting one or more of the following criteria: (1) presence of surface nodularity of the liver and one or more signs of portal hypertension (ascites, splenomegaly, or portosystemic shunt) on abdominal imaging; (2) esophageal or gastric varices on endoscopy; (3) thrombocytopenia (platelet count ≤ 100,000/mm3); (4) hypoalbuminemia (albumin ≤ 3.5 g/dL); and (5) prolongation of prothrombin time (PT) (international normalized ratio ≥ 1.3). Minimal HE was diagnosed when the psychometric hepatic encephalopathy score (PHES) was < −4. Covert HE was defined as either grade 1 in the West Haven classification or grade 0 in the same classification while meeting the minimal HE definition described above.
Exclusion criteria
Patients were excluded if they met any of the following criteria: (1) previously diagnosed with overt HE; (2) prescribed and treated with medications affecting the natural course of HE, such as neomycin, lactulose, lactitol, branched-chain amino acids, probiotics, and rifaximin in the 2 weeks before enrollment; (3) had been or is currently being treated for a neurological or psychiatric disease; (4) is being treated with viable hepatocellular carcinoma or other malignancies; (5) had developed an infection or gastrointestinal bleeding within 6 weeks before enrollment; (6) has a serum alanine aminotransferase level > 400 IU/L; (7) has a serum creatinine level > 1.5 mg/dL; or (8) has alcohol dependence or a history of alcohol abuse.
Intervention
At the baseline visit (Visit 1), each patient was provided with 2 g (three tablets of 333 mg to be taken twice a day) of either L-carnitine or placebo drugs orally, to be repeatedly taken for 24 weeks.
Study endpoints
The primary endpoint was to assess the effect of L-carnitine on the improvement of quality of life compared to that of the placebo. This assessment was performed using the 36-Item Short Form Survey (SF-36) questionnaire at 24 weeks. The secondary endpoints were to assess the additional effects of L-carnitine administration for 24 weeks on the improvement of the model for end-stage liver disease (MELD), serum ammonia, and normalization of covert HE compared to the placebo.
Study follow-up and measurements
After the baseline visit, the patients were followed up every 3 months. The West Haven criteria, SF-36, PHES, and Stroop test were performed on all patients [17]. The PHES consisted of five tests: the digit symbol test, number connection test (NCT)-A, NCT-B, serial dotting, and line tracing. Assessments were based on normative Korean data [18]. Minimal HE was diagnosed when PHES scores were < −4. The Stroop test was developed to screen minimal/covert HE in both easier and more objective ways by using a web-based smartphone method. The diagnostic performance of minimal HE was excellent when using the Stroop test (area under the receiver operating characteristic curve, 0.75; 95% confidence interval, 0.67 to 0.84; p < 0.001) [17].
Sample size and rationale
The sample size was based on a previous study assessing the effects of acetyl-L-carnitine administration on the improvement of SF-36 in patients with minimal HE [16]. The difference in SF-36 score changes from the score measured at the baseline to that at 90 days between the acetyl-L-carnitine group and placebo group was 4.85, and the standard deviation was presumed to be 10 based on these results. We maintained a statistical power of 80% with a 2.5% one-sided significance level. In addition, we allowed a rate of withdrawal or loss to follow-up of up to 10%. The final sample size was estimated to be 150 participants.
Handling of dropouts or missing data
For the efficacy endpoints, the last observation carried forward method was used for missing data imputation. The SF-36 is expected to improve over time, hence it is more conservative to replace the missing data using this method. However, the available data set underwent safety analysis without imputation of missing data.
Statistical analysis
All analyses were performed using the full analysis set according to the intention-to-treat principle, which included all patients who received at least one dose of the investigational product. Demographic and baseline characteristics were summarized by the intervention group and were tested statistically to identify any imbalance between the groups. For continuous variables, group comparisons of efficacy endpoints were tested using an independent two-sample t test or Wilcoxon rank-sum test, whereas within-group comparisons were tested using the paired t test or Wilcoxon signed test. These tests were also performed depending on the results of the normality test. The generalized estimating equations logit model was used for categorical variables to test the time effect within a group and the interaction effect of time × group.
Ethics approval and informed consent
This study was approved by the Institutional Review Boards of all participating centers (HYUH 2015-10-003, SGPAIK 2015-11-010) and was performed in accordance with relevant guidelines and regulations. The study was conducted in accordance with the ethical principles of the Declaration of Helsinki. Informed consent was obtained from all the participants enrolled in this study.
RESULTS
Basic characteristics
A total of 238 patients with liver cirrhosis were screened between June 2015 and December 2017. Among them, 150 patients with covert HE evaluated using PHES underwent randomization. Among them, 72 and 70 patients were assigned to the placebo group and the L-carnitine group, respectively (Fig. 1, full analysis dataset). Among them, 21 patients in the placebo group and 12 in the L-carnitine group were dropped out because of consent withdrawal (16 patients in the placebo group and eight in the L-carnitine group), loss to follow-up (two patients in the placebo group), discontinuation due to adverse events (two patients in the placebo group and three in the L-carnitine group), and discontinuation at the investigator’s discretion (one patient from each group). Fifty-one and 58 patients completed the study at week 24 in each group. The most common etiology for liver cirrhosis was chronic hepatitis B (88.7%), and the proportion of patients with chronic hepatitis B receiving antiviral treatment did not differ between the groups (Table 1). The median MELD score was 8.0 points. The compliance of the patients in the placebo and L-carnitine groups was 90.5% ± 11.5% and 85.1% ± 17.2%, respectively, which was not significantly different.
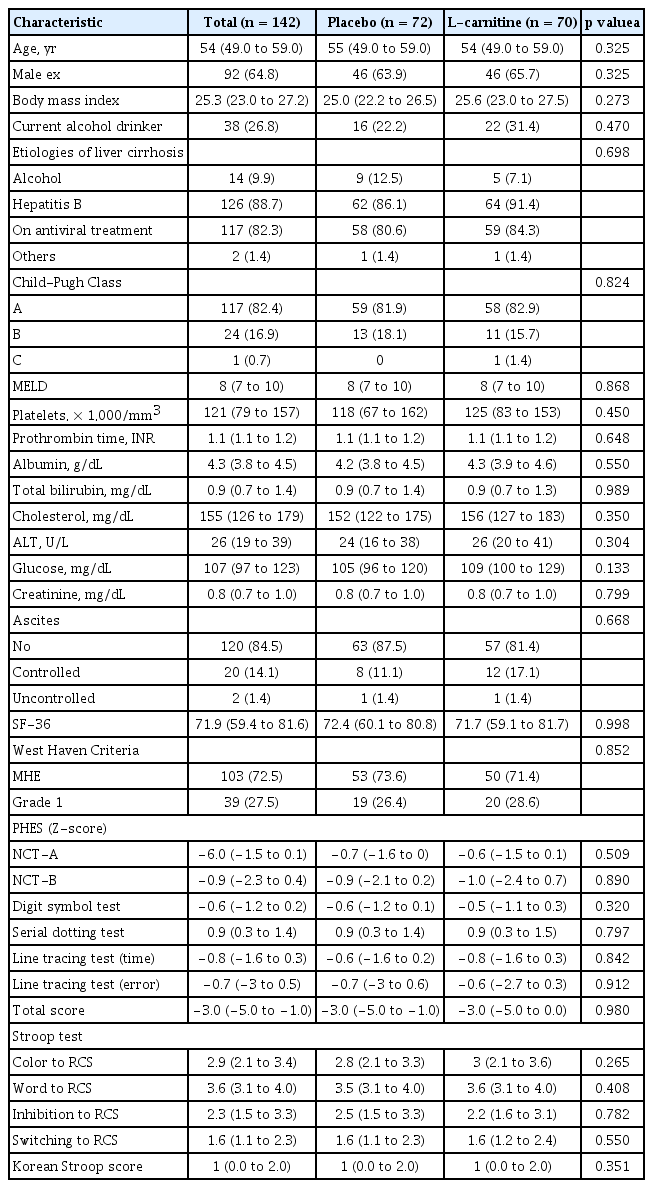
Baseline characteristics of patients
Effects on quality of life
There was a significant improvement in SF-36 values within the L-carnitine group after 24 weeks (p < 0.001), but the median SF-36 values of both groups were comparable at week 24 (Table 2). Both physical and mental component scores were improved in the L-carnitine group, but the mental component score was improved in the placebo group as well, resulting in no difference between both groups at 24 weeks.
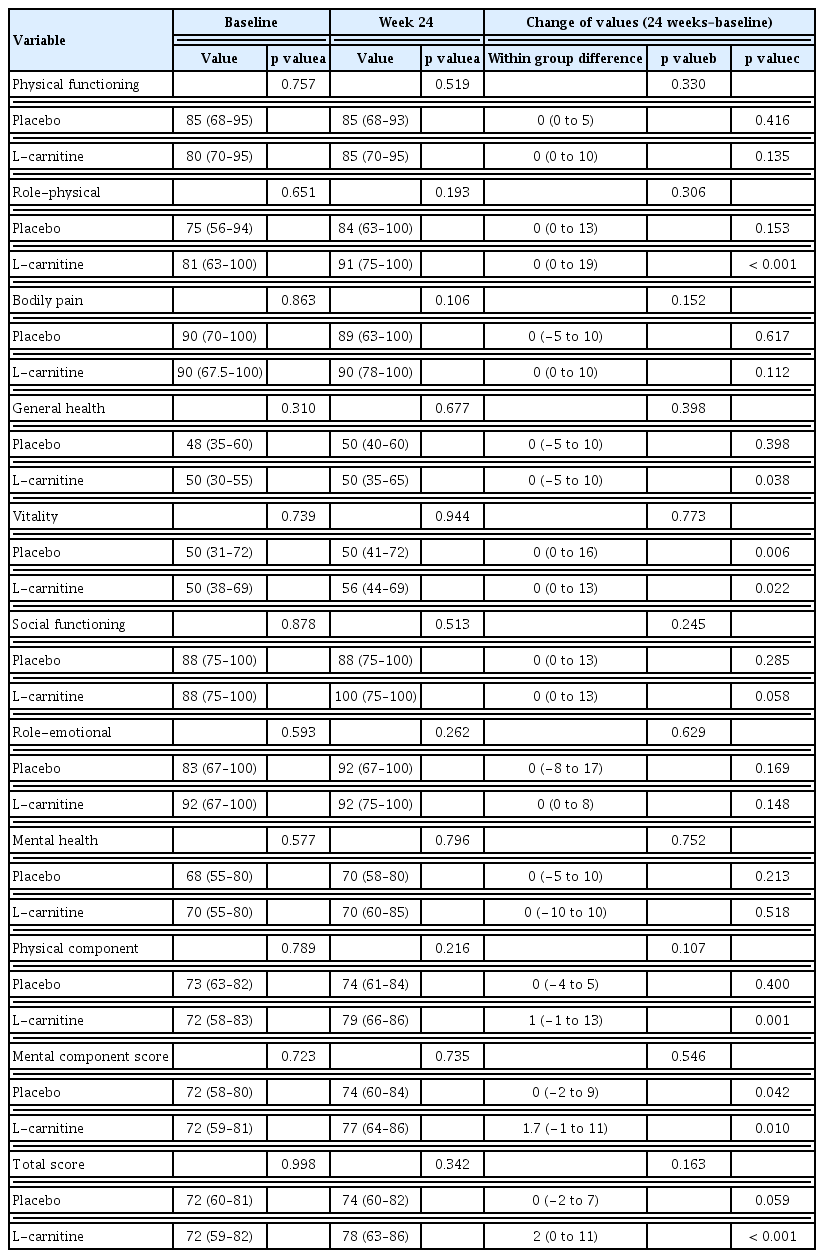
The comparison of quality of life assessed by SF-36 between the groups and within the group during 24 weeks
Effects on liver chemistry and MELD score
Aspartate aminotransferase levels were decreased in the L-carnitine group after 24 weeks of treatment compared to that at the baseline (p = 0.014) (Supplementary Table 1). PT also improved in the L-carnitine group, whereas total bilirubin concentration worsened in the placebo group after 24 weeks. The MELD scores were increased in the placebo group (p = 0.047) and were significantly decreased in the L-carnitine group (p = 0.008). Hence, the gaps in the change of MELD scores were significantly different between the two groups (p = 0.003). However, the MELD scores of both groups at week 24 were comparable (Fig. 2). Furthermore, the serum ammonia levels did not exhibit significant differences between or within each group after 24 weeks of treatment.

Comparison of the model for end-stage liver disease (MELD) scores and their components between the two groups. (A) MELD score, (B) prothrombin time-international normalized ratio (PT-INR), (C) total bilirubin, (D) creatinine. NS, not significant.
Effects on cognitive function
The changes in PHES scores and the normalization rates of minimal and covert HE at week 24 were compared between the groups (Supplementary Table 2). Both groups exhibited improved PHES scores, with no difference in values between groups at week 24. However, the ordinal association of the change in PHES scores during sequential visits (e.g., baseline, week 12, and week 24) among patients with minimal HE diagnosed at the baseline was significantly improved within the L-carnitine group (p = 0.007) (Fig. 3). The inhibition test, which is one of the subtests in the Stroop test, also showed significant improvement within the L-carnitine group after 24 weeks (2.3 ± 1.1 at the baseline vs. 2.7 ± 1.1 at 24 weeks, p < 0.001), but not in the placebo group (Fig. 4A). Additionally, this difference between the baseline level and the level at week 24 was significantly higher in the L-carnitine group (0.0 ± 0.8 in the placebo group vs. 0.3 ± 0.7 in the L-carnitine group, p = 0.038). However, the rate-correct scores of each subtest in the Stroop test were comparable for both groups at 24 weeks.
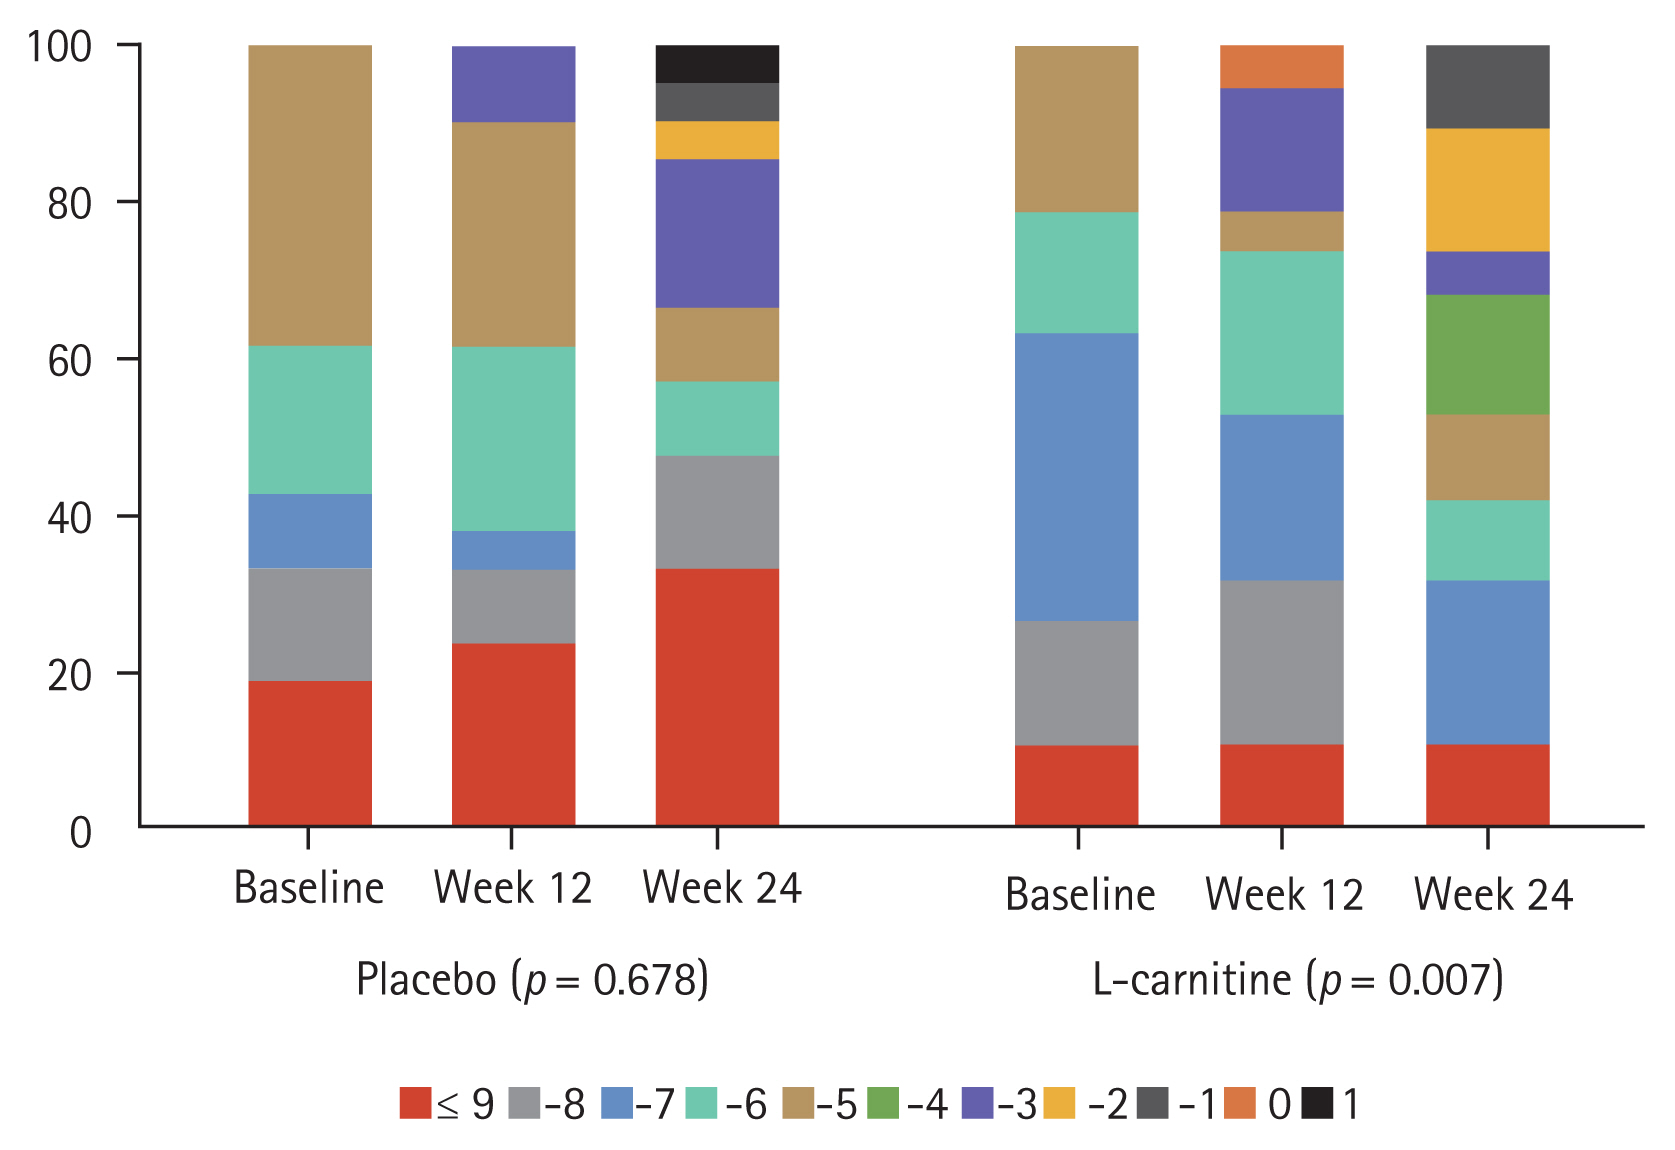
Comparison of the improvement in psychometric hepatic encephalopathy scores between the two patient groups among those with minimal hepatic encephalopathy diagnosed at the baseline.
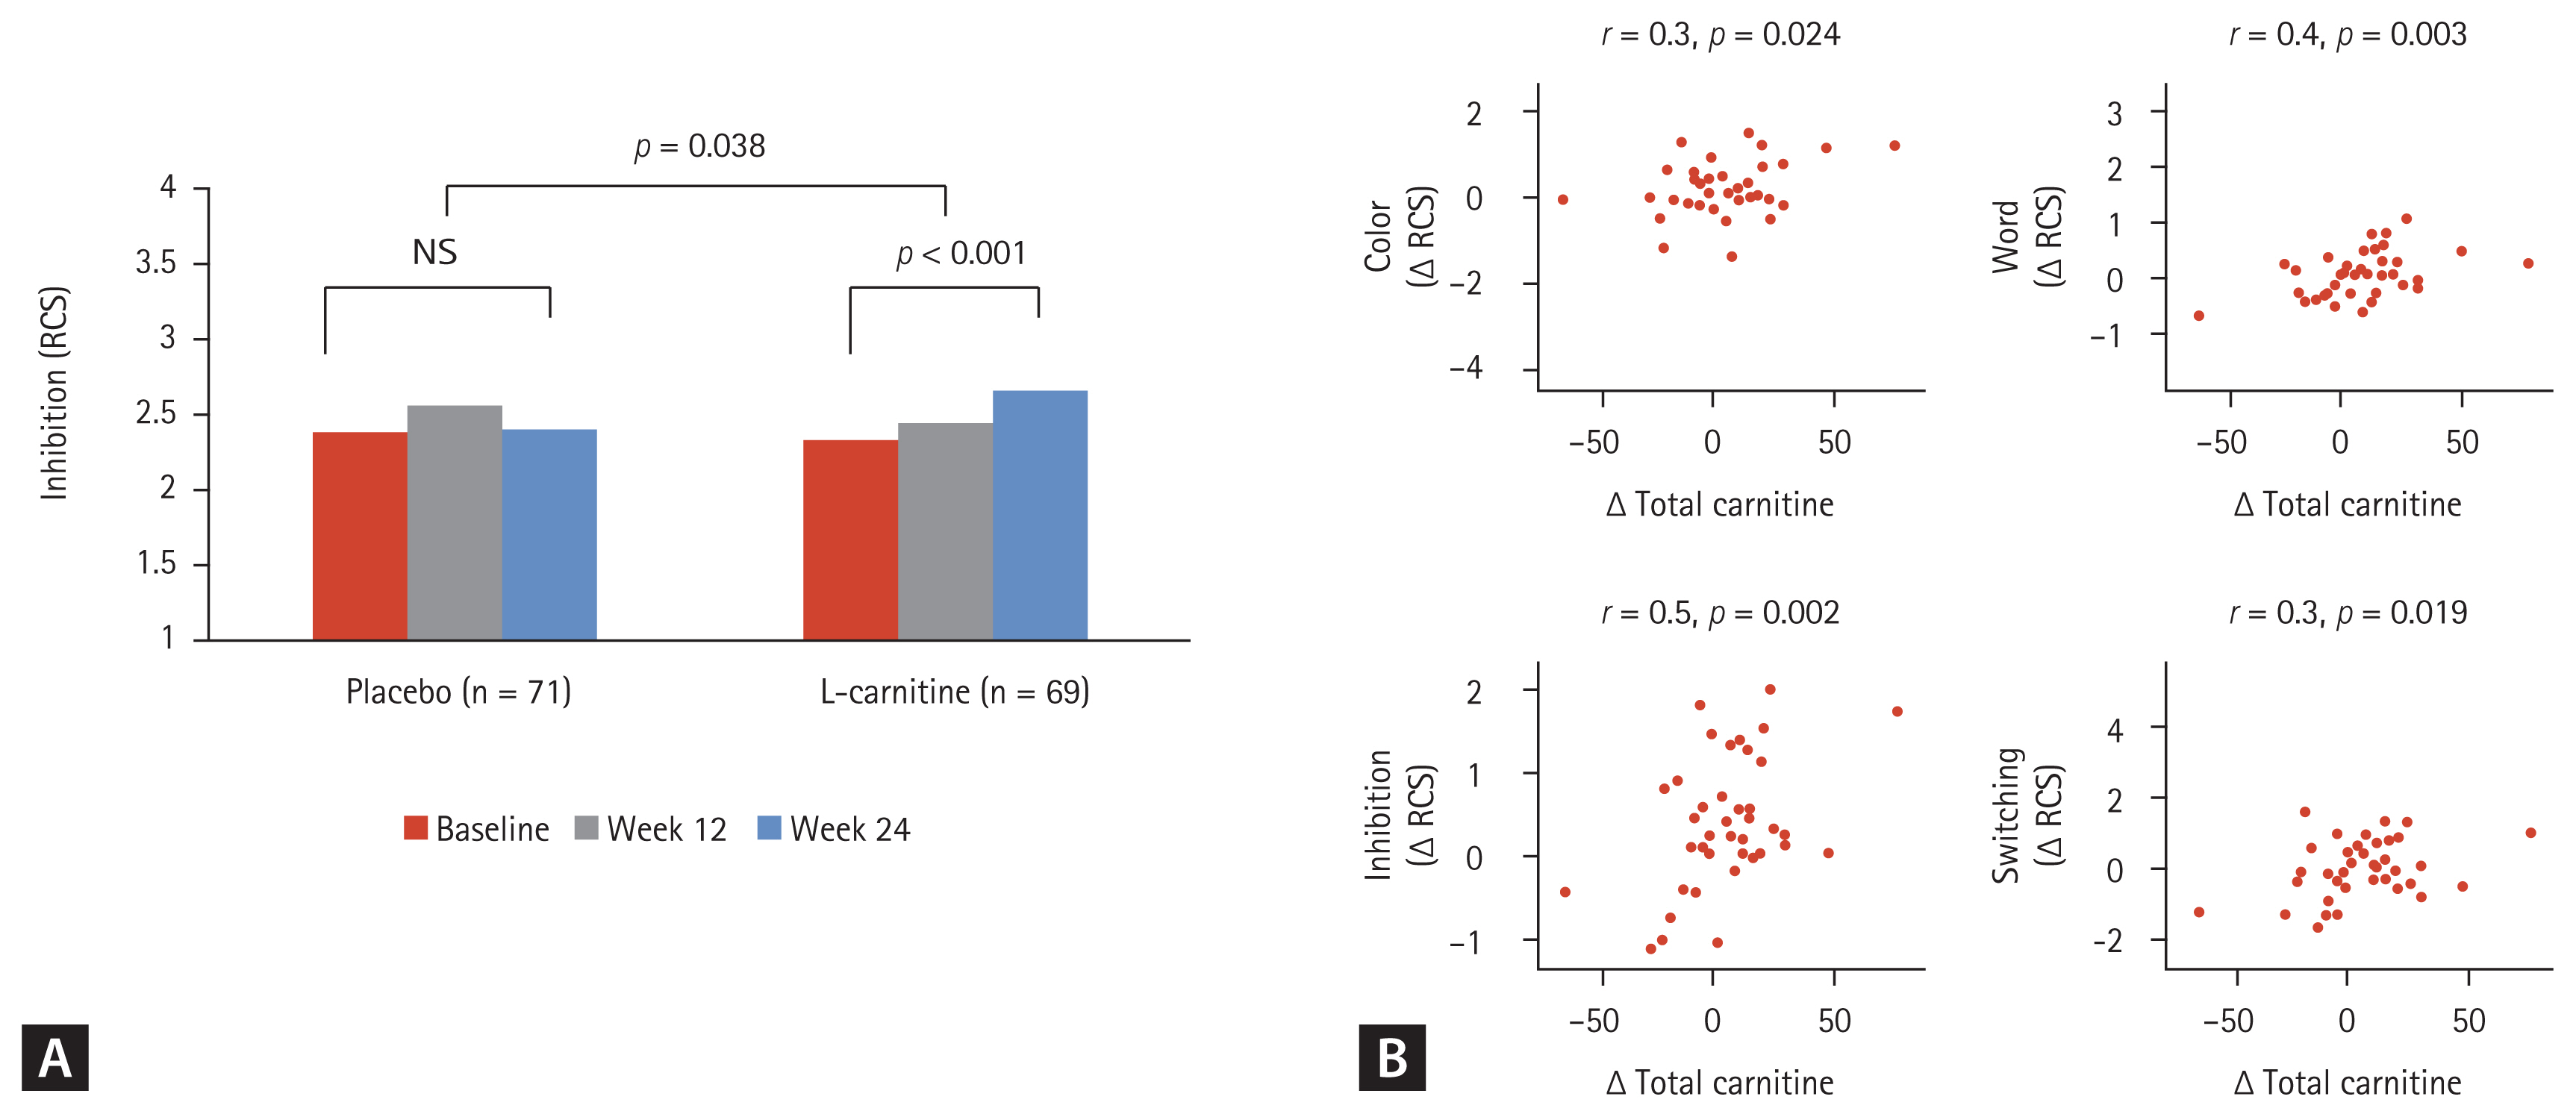
Stroop test. (A) Comparison of the Stroop inhibition subtest between the two groups. (B) Correlation of serum carnitine level and Stroop results among the patients in the L-carnitine group. RCS, rate-correct score; NS, not significant; Δ, difference.
Correlation of serum carnitine level and cognitive function/quality of life
Serum levels of total carnitine and free carnitine were elevated in the L-carnitine group and were significantly different between the two groups at week 24 (reference values: 42–81 μmol/L [males] and 31–67 μmol/L [females] for total carnitine; 35–67 μmol/L [males] and 25–55 μmol/L [females] for free carnitine; 3.8–19 μmol/L for acyl carnitine). However, serum acylcarnitine levels did not significantly increase in the L-carnitine group. Furthermore, the change in total carnitine level between the baseline and at week 24 was positively correlated with the improvement of rate-correct scores of all four components in the Stroop test (color test, r = 0.3; word test, r = 0.4; inhibition test, r = 0.5; switching test, r = 0.3; all p values < 0.05) (Fig. 4B). However, the change in total carnitine level between the baseline and at week 24 was not significantly correlated with improvement in quality of life as assessed by the SF-36.
Safety analysis
Adverse events were observed in 25 out of 72 patients in the placebo group and 29 out of 70 patients in the L-carnitine group (34.7% vs. 41.4%, p = 0.490). In addition, the rate of serious adverse events did not differ between the two groups (8% in the placebo group vs. 11% in the L-carnitine group). However, there were no serious adverse events related to the study drugs in either group. Overall, 21 patients out of the full analysis data set stopped the study drugs either transiently or permanently. There were 5.6% (four out of 72 patients) and 7.1% (five out of 70 patients) in the placebo and L-carnitine groups, respectively, who permanently discontinued the medication due to adverse events, and these numbers did not differ between the groups. Events leading to death were also not observed in either group.
Per-protocol analysis of the endpoints
Sixty-five patients were included in the per-protocol analysis (32 patients in the placebo group and 33 in the L-carnitine group) (Fig. 1). Nineteen patients in the placebo group and 25 patients in the L-carnitine group were excluded from the per-protocol analysis due to one or more reasons such as inadequate compliance to the medications (< 80%), violation of the visiting windows, or not meeting the inclusion/exclusion criteria. The total SF-36 scores, especially the physical component scores, PHES scores, and the rate-correct scores of the inhibition test were improved within the L-carnitine group after 24 weeks of treatment (Supplementary Table 3). However, the SF-36 scores, PHES scores, normalization rate of minimal HE, and rate-correct scores on the Stroop test at week 24 did not differ between the two groups.
DISCUSSION
This is the first prospective, randomized, double-blind, placebo-controlled, multicenter clinical trial that evaluated the effects of carnitine on quality of life and liver function. The definition and diagnostic criteria of minimal HE were unclear in two previous clinical trials conducted in patients with minimal HE [15,16]. The patients included in those studies had liver cirrhosis but had no overt HE compared to patients with liver cirrhosis and only minimal HE. Moreover, their assessment of minimal HE had not been based on data normative to their population [16].
Our study has several strengths compared to previous ones. First, this study was based on the largest number of participants with the longest period of treatment (up to 24 weeks). Most previous studies have evaluated the effects of carnitine for only 4 to 12 weeks [19]. Secondly, this is the first study to evaluate the improvement of cognitive function by performing an assessment using the Stroop test as well as the PHES, which were based on normative data [17,18]. Stroop results and MELD scores are more objective than the PHES values in the evaluation of liver function among patients with covert HE. The difference in the median rate-correct scores of the Stroop inhibition test after 24 weeks was significantly higher in the L-carnitine group than in the placebo group. Additionally, liver function improved within the L-carnitine group based on MELD scores. However, the median rate-correct scores of the Stoop inhibition test and the MELD scores did not significantly differ between the placebo and L-carnitine groups at week 24. Therefore, we are cautious in drawing a conclusion regarding the beneficial effects of L-carnitine on the quality of life of patients with covert HE, which was the primary endpoint of this study.
Our study had some limitations. First, a quarter of the patients dropped before the completion of the study period. Missing data were handled using the last observation carried forward method in the analysis of the endpoints, except for the safety outcome. Therefore, the effects of L-carnitine may have been underestimated. Additionally, the possibility of a type II error should be considered in the interpretation of our findings, since the limited number of patients in each arm could have led to the limited effect of L-carnitine on the quality of life. Nevertheless, we arrived at similar results when the per-protocol analysis was applied, despite half of the patients in each group not being included in the analyses. Additionally, the change in total carnitine levels after 24 weeks showed a positive correlation with the improvement in the Stroop test. Traditionally, serum carnitine levels are reportedly maintained at normal concentrations among patients with liver cirrhosis [20,21]. The disruption of mitochondrial permeability and the subsequent lowering of L-carnitine levels incorporated into the mitochondria in patients with cirrhosis reportedly lead to intrinsic insufficiency at the mitochondrial level, even with normal serum levels [22]. Therefore, we could assume that patients with liver cirrhosis and covert HE may benefit from L-carnitine supplementation even with normal serum concentrations. Second, the appropriate dose of L-carnitine required for the improvement of cognitive function and quality of life could not be determined in our study. Nevertheless, the little increase in serum acylcarnitine levels following 24 weeks of L-carnitine treatment suggests that 2 g of L-carnitine may not be sufficient to discriminate its positive effects. In previous studies, L-carnitine was administered at doses up to 4 to 6 g per day [23]. If we had administered higher doses of L-carnitine, the effects on cognitive function and quality of life could have been more remarkable than our present findings. Third, as 89% of our participants had chronic hepatitis B, we could not exclude the effect of antiviral treatment on the marginal improvement in the results of the inhibition test or the MELD scores in the L-carnitine group. However, the proportion of patients who were already on stable antiviral treatment did not differ between the groups. Therefore, the possible beneficial effects of antiviral treatment were minimal in this study. Fourth, following the improved results of PHES in both groups without significant change in serum ammonia levels, we could not exclude the possibility of learning effects that patients could have achieved during the repeated examinations throughout the study period.
In conclusion, 24 weeks of L-carnitine supplementation was safe but was not effective in improving the quality of life among patients with covert HE. However, their MELD scores were stabilized with L-carnitine supplementation, and the difference in total carnitine concentration exhibited a positive correlation with improvements in cognitive function among these patients.
KEY MESSAGE
1. Twenty-four weeks of L-carnitine supplementation (2 g/day) was ineffective in the improvement of quality of life in liver cirrhosis patients with covert hepatic encephalopathy (CHE).
2. Twenty-four weeks of L-carnitine supplementation (2 g/day) was safe in liver cirrhosis patients with CHE.
3. Further studies with higher doses of L-carnitine supplementation would be needed to confirm the possible beneficial effects on the improvement of covert hepatic encephalopathy and liver function.
Notes
Conflict of interest
This study was financially supported by the Ildong Pharmaceutical Company. The funding source had no role in the study design, implementation, data collection, analysis, and interpretation, or in the preparation, review, and approval of the manuscript.