Association between serum ferritin levels and colorectal cancer risk in Korea
Article information

Abstract
Background/Aims
The concentration of serum ferritin, a storage form of iron, may be associated with carcinogenesis in various cancers. There are only limited studies on the relationship between serum ferritin levels and colorectal cancer (CRC) risk, especially in the Asian population. This study aimed to analyze the association between CRC incidence and serum ferritin levels.
Methods
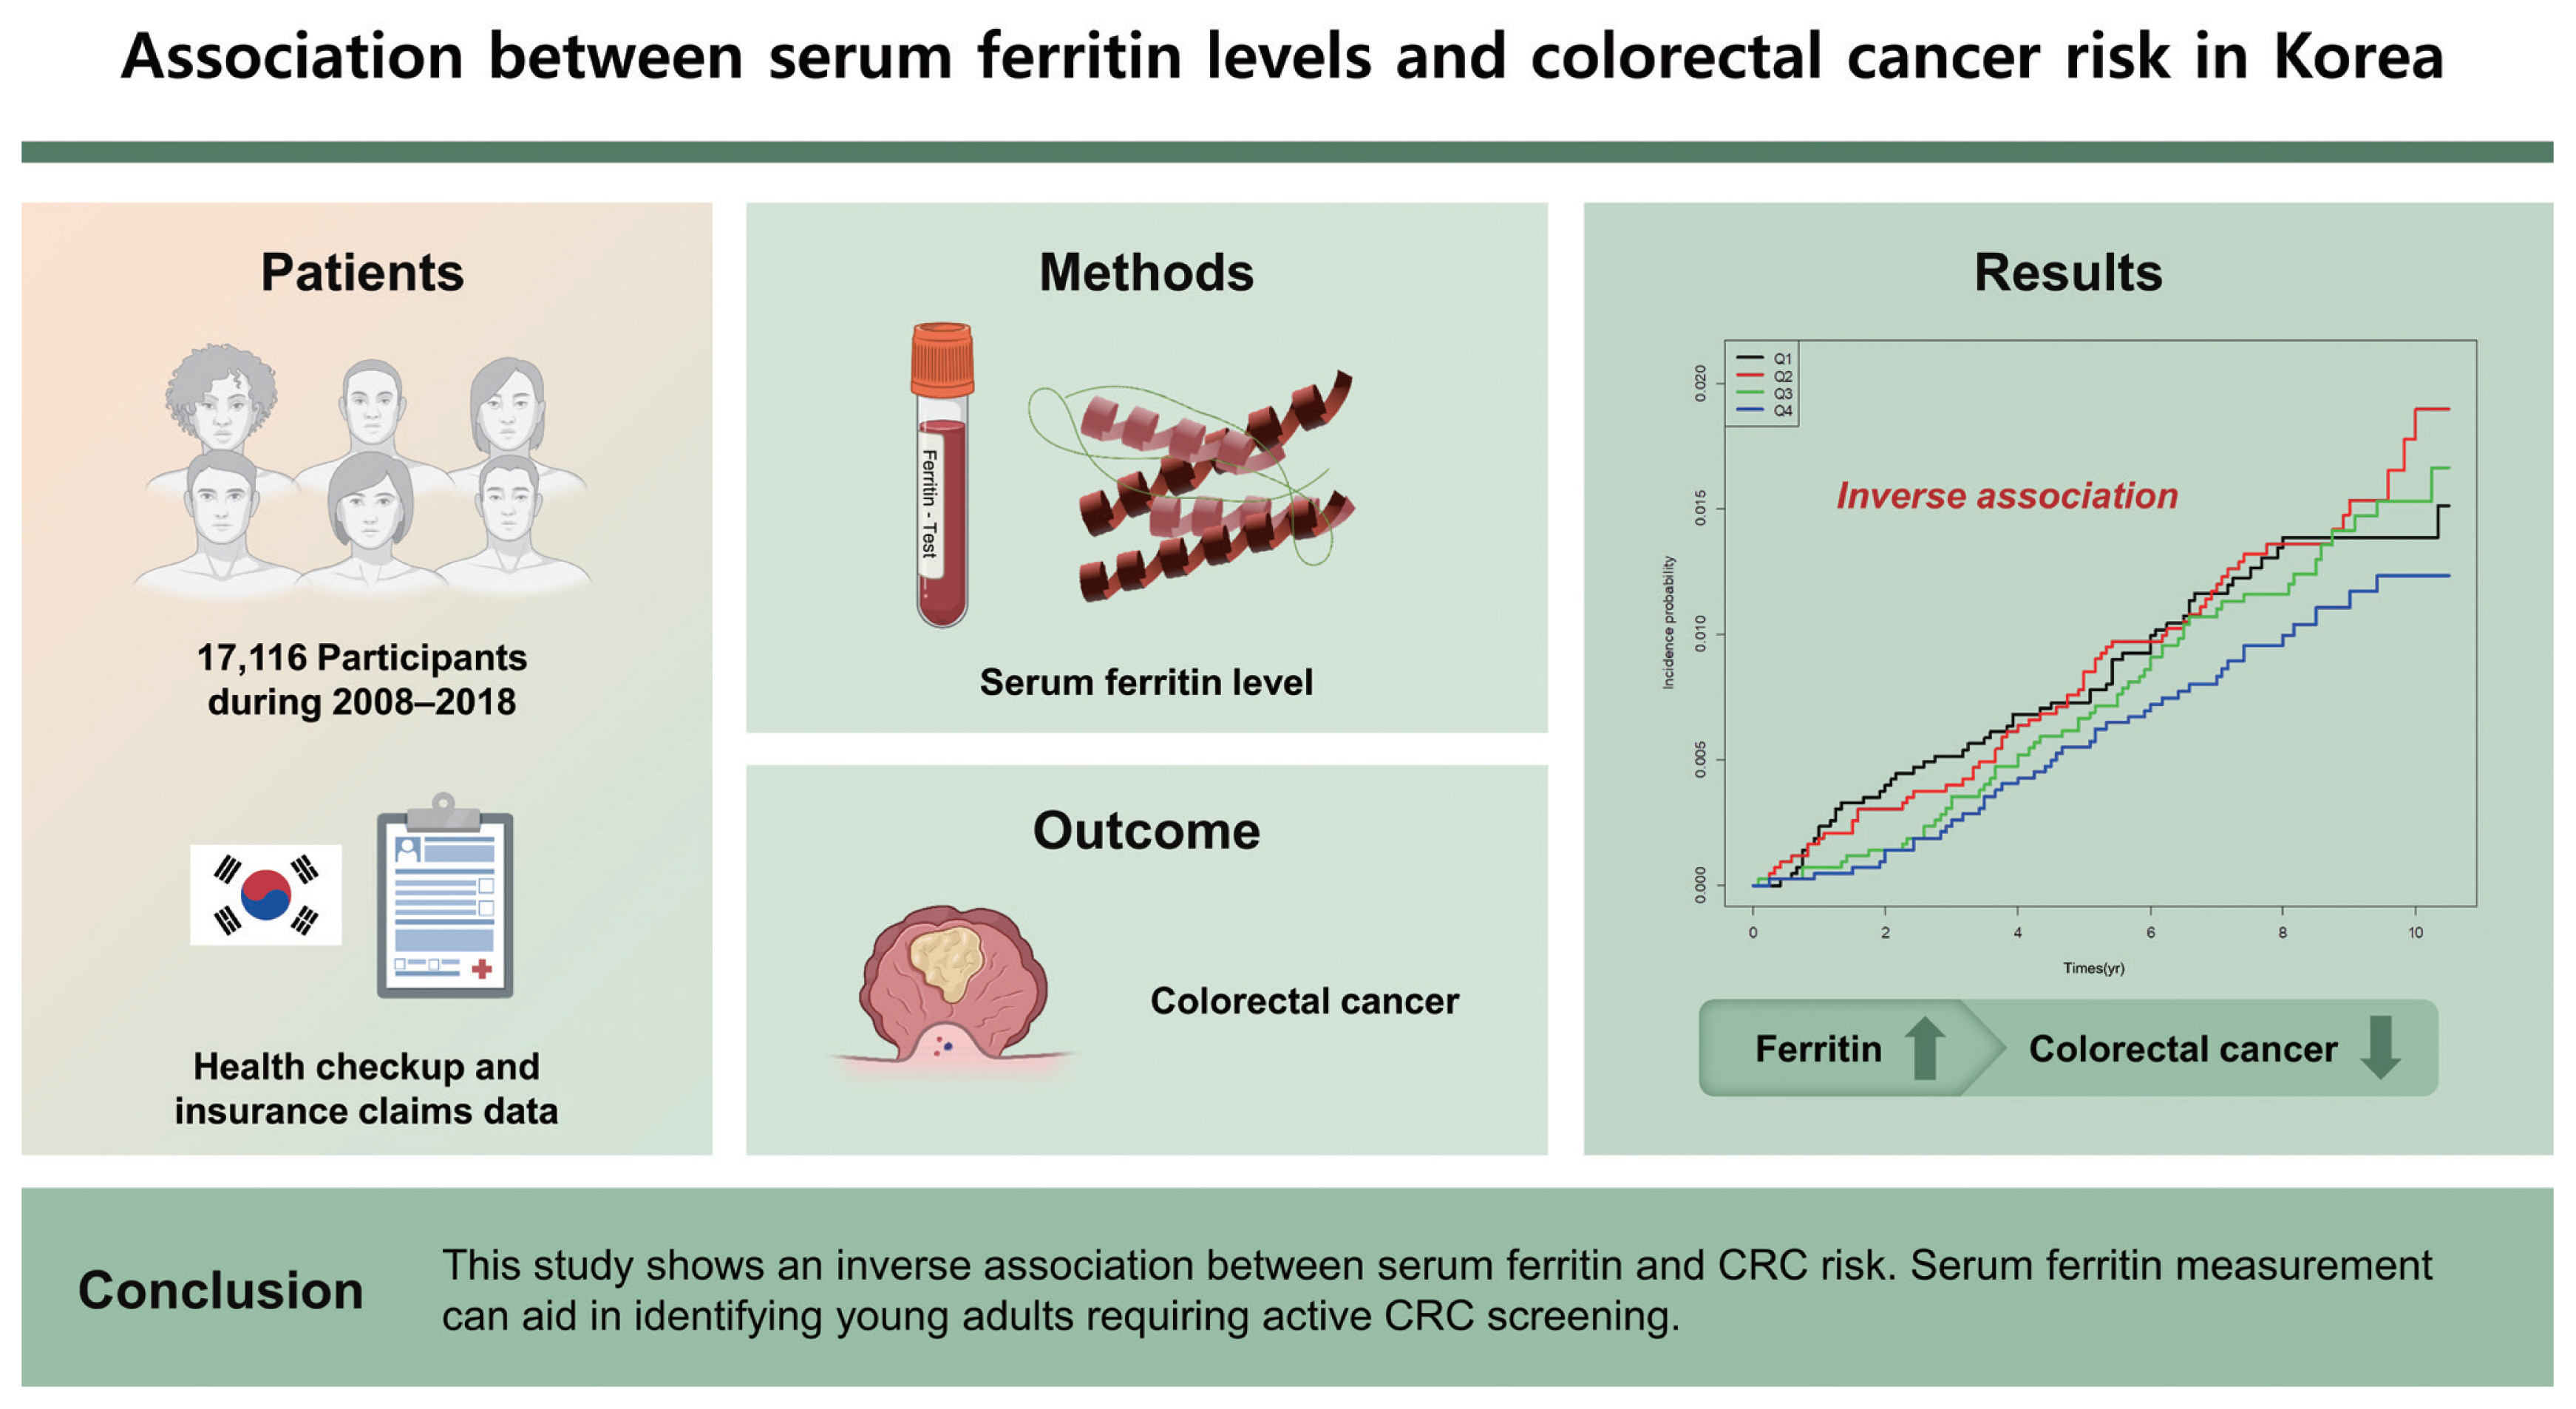
This was a national cohort study that used health checkup and insurance claims data of the Korean population. CRC incidence according to the serum ferritin level was analyzed during 2008–2018 in 17,116 participants.
Results
The hazard ratio (HR) of CRC incidence decreased as serum ferritin levels increased (Q1: HR, 1.000 [95% confidence interval [CI], reference]; Q2: HR, 0.811 [95% CI, 0.558 to 1.178]; Q3: HR, 0.654 [95% CI, 0.442 to 0.968]; Q4: HR, 0.443 [95% CI, 0.285 to 0.687]; p = 0.0026). In subgroup analysis, 40 to 64 years of age, sex, body mass index of < 25 kg/ m2, presence of metabolic syndrome, absence of diabetes mellitus, and absence of anemia had HRs of < 0.5 (95% CI) in the highest quartiles compared with that in the lowest quartiles.
Conclusions
This study shows an inverse association between serum ferritin and CRC risk. Serum ferritin measurement can aid in identifying young adults requiring active CRC screening.
INTRODUCTION
Colorectal cancer (CRC) is the fourth most common cancer worldwide. It was newly diagnosed among 147,950 patients in the United States in 2020 and among 27,909 patients (54.4 patients per 100,000 people) in Korea based on national cancer statistics in 2018 [1,2]. Risk factors for the incidence of CRC include lifestyle-related factors such as high-fat diet, obesity, lack of physical activity, smoking, and alcohol consumption [3]. Red meat consumption is also known to be a strong risk factor [3], which can be considered in relation to the dietary iron level. Iron in red meat is present in the form of heme iron, and CRC risk increases according to heme iron intake [4].
Iron, which has the ability to transfer unpaired electrons, is a key player in oxidation–reduction (redox) reactions. The oxidation states vary, and iron exhibits an oxidation state from −2 to 6. Because of the flexibility in accepting different oxidation states that allows iron to interact with various ligands, iron is essential for sustaining life [5]. However, this ability of iron generates a large amount of hydroxyl radicals, which sometimes cause DNA damage and drive carcinogenesis [5]. This suggests that iron overload in the human body is related to carcinogenesis development. In a study of 14,407 people who were observed for 10 years, 858 patients diagnosed with cancer had higher transferrin saturation and lower total iron-binding capacity than people without cancer; similar results have been reported in other studies [6,7].
In case of excessive levels of systemic iron, iron is sequestered and stored to prevent toxicity. Ferritin is a major iron storage protein that plays a critical role in the maintenance of systemic iron homeostasis [8]. Therefore, serum ferritin levels generally decrease during iron deficiency and increase during iron overload [8]. Based on these concepts, the positive correlation between cancer risk and serum ferritin level is a predictable hypothesis. However, in one meta-analysis, the serum ferritin level in CRC patients was lower than that in healthy patients, contrary to the expected result [9]. There are only limited studies on the association between serum ferritin levels and CRC risk, especially in the Asian population.
This study aimed to analyze the association between CRC risk and serum ferritin levels in the Korean population using linkage data from the 2008 to 2012 Korea National Health and Nutrition Examination Survey (KNHANES) and the National Health Insurance Services (NHIS) claims database.
METHODS
Database and study population
Since 1998, the KNHANES has been conducted regularly under the leadership of the Korea Disease Control and Prevention Agency to monitor the general health and nutritional status of a randomly sampled civilian, non-institutionalized Korean population [10]. Korea’s NHIS is a social insurance payment system that covers approximately 97% of the Korean population. The NHIS data include information of all national routine health examinations and claims data. Claims data include diagnostic codes as per the International Classification of Diseases, 10th revision (ICD-10), disease coding system [11].
This national cohort study used KNHANES data collected during 2008 to 2012. Adults aged more than 40 years who had undergone blood tests for the measurement of serum ferritin levels were included in the study. Participants were healthy people without acute illness or severe comorbidities such as end-stage renal disease. We excluded individuals who were under menstrual status at the time of investigation, who had missing data, and who were previously diagnosed with CRC or any other cancer.
Eligible subjects selected from the KNHANES database were merged with those from the NHIS database to create a cohort dataset. To evaluate newly diagnosed CRC cases, we used cohort data from 2008 with clinical follow-up through to December 31, 2018.
Informed consent of participants was not required because this study used data from the national health database, where consent had previously been obtained for the use of the collected data for research. The Institutional Review Board of The Catholic University of Korea (IRB No. HC21ZISI0063) approved this study. The study was conducted in compliance with the principles of the Declaration of Helsinki.
Laboratory measurements and survey of lifestyle-related factors
Details of the KNHANES framework regarding the content of health surveys, standardized physical examinations, laboratory tests, and definitions of risk factors have been described previously [11]. Among the selected participants, specialists performed physical examinations, including body mass index (BMI) calculation and waist circumference measurement, according to standardized methods. Smoking status was divided into three categories: non-smoker, ex-smoker, or current smoker. Alcohol consumption was assessed based on the average number of alcoholic beverages and frequency of alcohol consumption. Heavy drinkers were defined as participants who consumed more than 30 g/day, whereas mild-to-moderate drinkers were defined as participants drinking less than 30 g/day [12]. Physical activity was defined as walking for at least 150 min/week [12].
Diabetes mellitus (DM), hypertension, and hypercholesterolemia were defined as a fasting glucose level of ≥ 126 mg/ dL, systolic blood pressure (BP) of ≥ 140 mmHg or diastolic BP of ≥ 90 mmHg, and total cholesterol level of ≥ 240 mg/ dL, respectively. Triglyceride, high-density lipoprotein cholesterol, ferritin, and hemoglobin (Hb) levels were obtained from serum or plasma samples at the time of enrollment in the KNHANES. Anemia was defined as a Hb level of < 13.0 g/dL for men and < 12.0 g/dL for women. The criteria for metabolic syndrome were based on a recent study [13].
Clinical outcomes
The primary outcome was newly diagnosed CRC during the follow-up period. Since 2005, the Korean government has implemented policies to expand NHIS benefit coverage to provide financial protection against life-threatening and catastrophic diseases such as cancer, cerebrovascular disease, and heart disease. When a patient is registered for cancer in the NHIS system, the patient is assigned a special code (V193). Therefore, if the participants of this study were newly diagnosed with CRC based on imaging or pathology findings, then they were registered in the NHIS system with the V code assignment. We identified patients who were diagnosed with CRC during the follow-up period using the ICD-10 codes (C18, C19, C20) among the participants who were assigned the V codes (V193), according to protocols established in a previous study [13].
Statistical analysis
Summary statistics were expressed as means and standard deviations for continuous variables and as numbers and percentages for categorical variables. Continuous variables were compared using Student’s t test or analysis of variance, as appropriate. Categorical variables were compared using the chi-squared test. The incidence of CRC was calculated by dividing the number of CRC patients by the sum of the follow-up duration, presented as the rate per 1,000 person-years. Participants were observed on follow-up until the first diagnosis of CRC, censoring by death, or December 31, 2018, whichever occurred first. Clinical outcomes were determined using the Kaplan-Meier method and compared using the log-rank test. Cox proportional-hazard models were used to analyze the association of serum ferritin levels with CRC risk. Hazard ratios (HRs) and 95% confidence intervals (CIs) were also calculated. Statistical significance was set at p < 0.05. Multivariable regression models were constructed with non-adjustment (Model 1), adjustment for age, sex, smoking, alcohol consumption, and exercise (Model 2), and inclusion of the variables in Model 2 plus the presence of BMI, DM, and Hb level (Model 3). All statistical analyses were performed using SAS version 9.4 (SAS Institute, Cary, NC, USA).
Availability of data and materials
Individual participant data will not be shared because access to the data requires legitimate administrative approval. The data access use is restricted until December 2021 in accordance with government regulations.
RESULTS
Study participants
In total, 20,688 people were registered through the KNHANES system during 2008 to 2012, and the datasets were linked to the NHIS system in 2018. After excluding participants who were menstruating, who had missing data including serum ferritin levels, and who were previously diagnosed with any cancer, 17,116 participants were analyzed (Fig. 1).
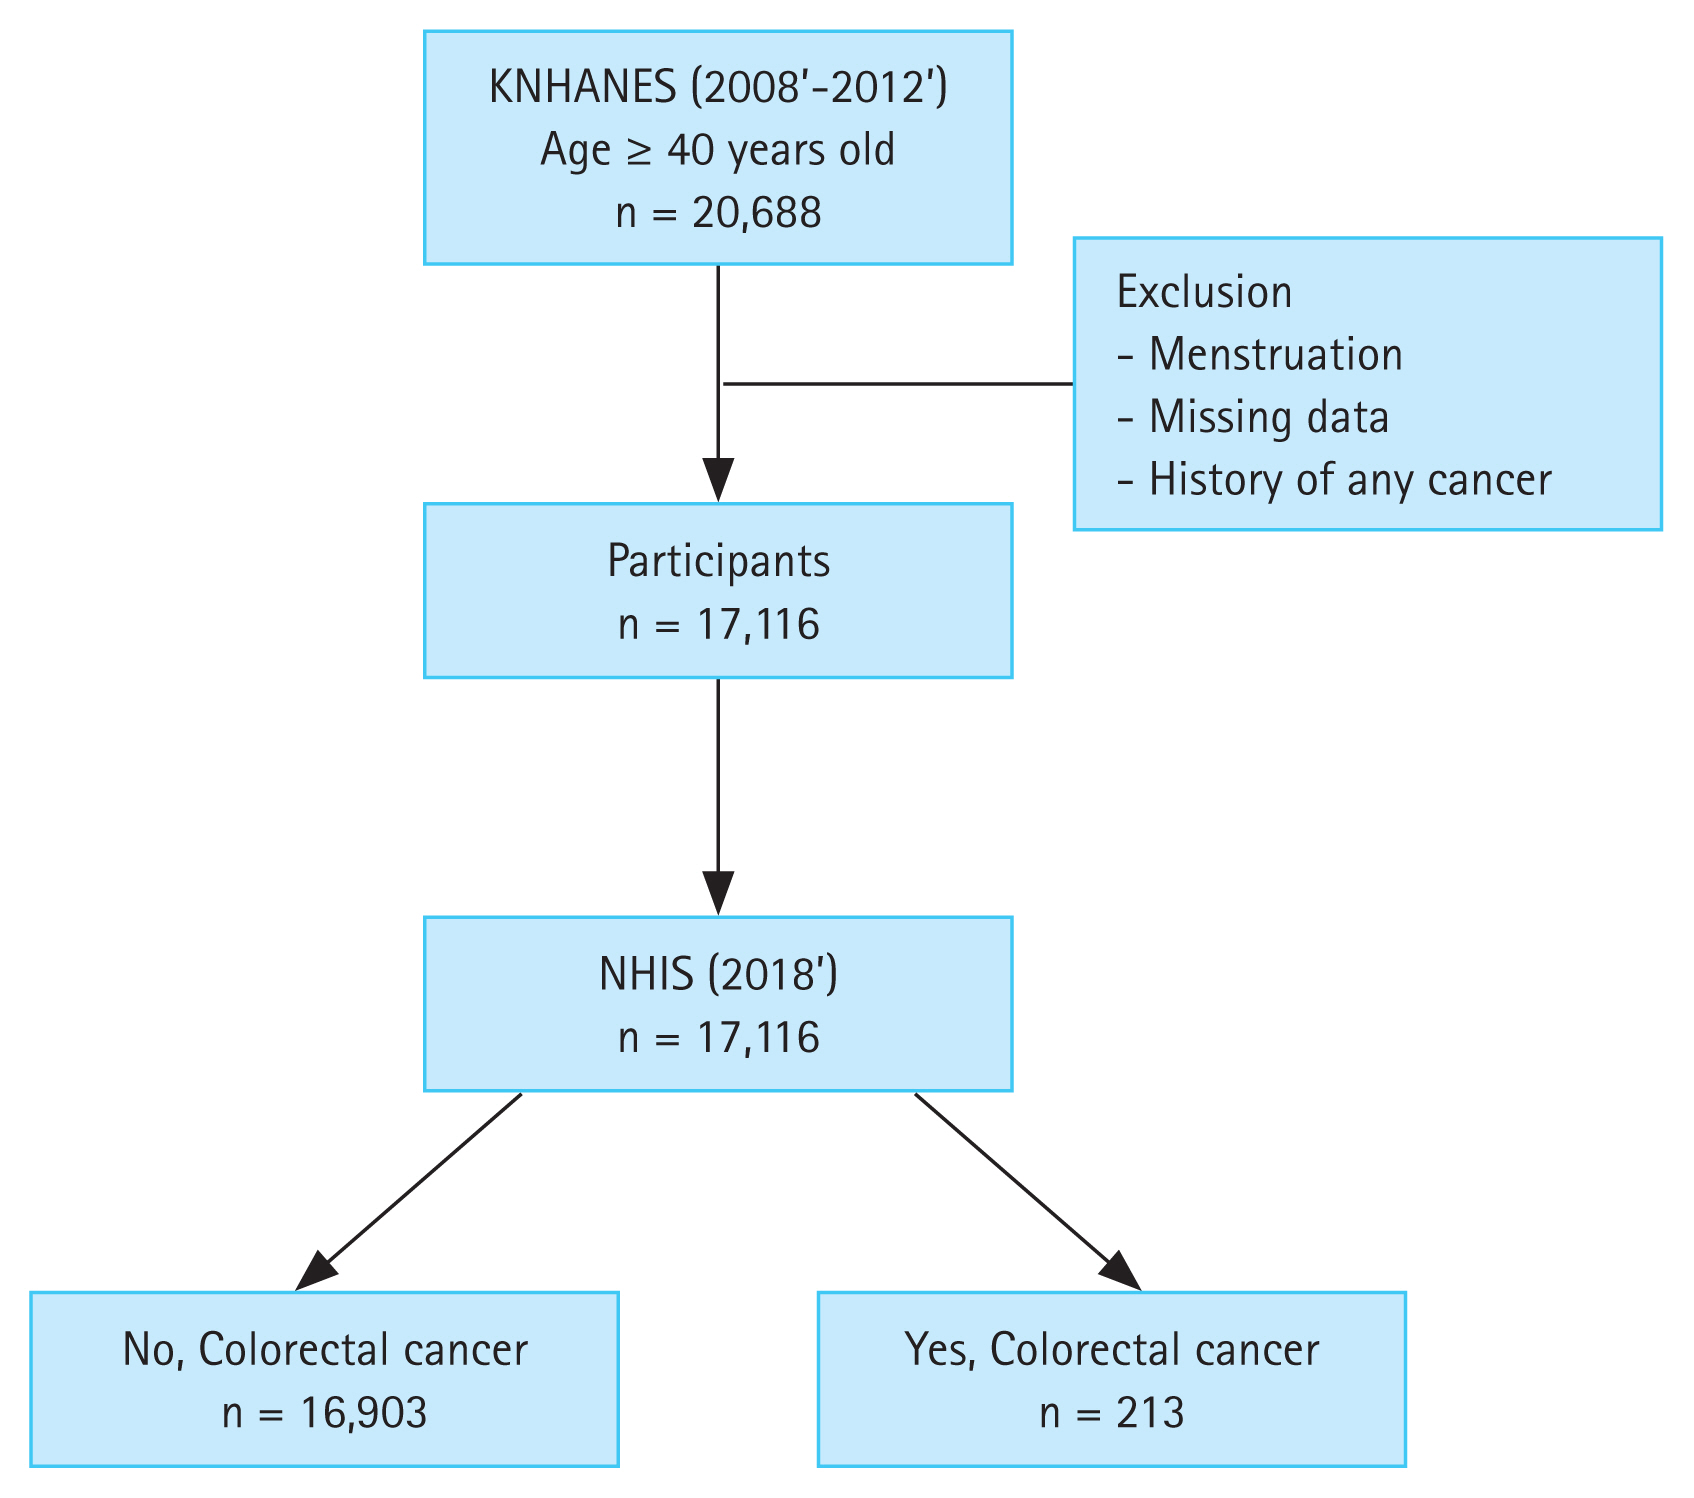
Study design. KNHANES, Korea National Health and Nutrition Examination Survey; NHIS, National Health Insurance Services.
Baseline characteristics of the study participants
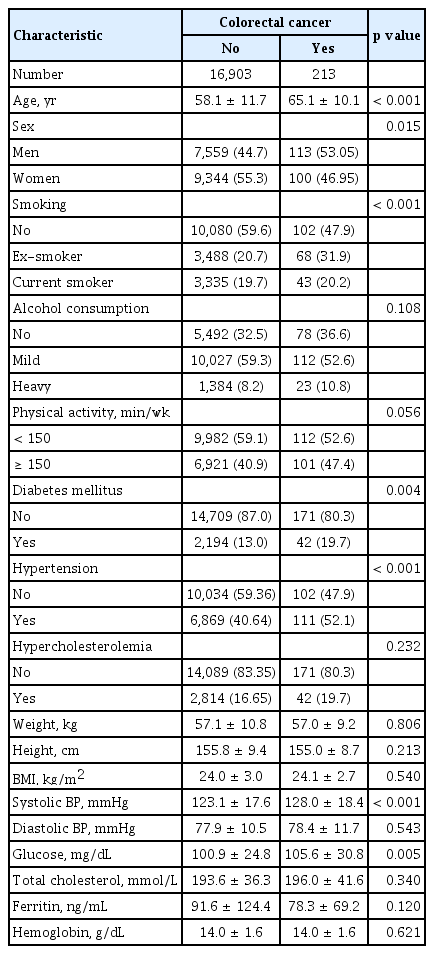
Table 1 shows the baseline characteristics of the study participants. A higher proportion of participants with CRC were male; were older; and had a history of smoking, DM, and hypertension. The mean serum ferritin level was lower in patients with CRC than in those without CRC, but the difference was not significant.
Baseline characteristics of study participants
Table 2 shows the baseline characteristics of participants according to the quartiles of serum ferritin level, with cutoff values of 36.33, 66, and 111.14 ng/mL, respectively. The mean ferritin level in each quartile was 19.96, 50.68, 86.07, and 209.03 ng/mL, respectively. There were significant differences in the proportions of age, sex, smoking history, alcohol consumption, BMI, DM, and Hb levels between quartiles of serum ferritin levels (Table 2). A higher ferritin quartile showed a higher proportion of CRC risk factors such as smoking history, alcohol consumption, DM, and obesity (Table 2).

Baseline characteristics according to the quartile of serum ferritin
Association between CRC risk and serum ferritin levels
Table 3 presents the HRs and 95% CIs for the incidence of CRC according to the serum ferritin level using multiple regression analysis. The unadjusted HR was 0.796 (95% CI, 0.534 to 1.187) in the highest quartile compared with that in the lowest quartile (Model 1). When age, sex, smoking, alcohol consumption, and physical activity were controlled (Model 2), the adjusted HR of the highest quartile was 0.471 (95% CI, 0.306 to 0.722) in comparison to that of the lowest quartile. With additional adjustment for BMI, DM, and Hb level (Model 3), the adjusted HR was 0.443 (95% CI, 0.285 to 0.687). Interestingly, the higher quartile had a lower HR (Table 3). The quartile of ferritin levels showed an inverse relationship with CRC risk. In particular, after adjustment for multiple covariables, Q3 and Q4 of ferritin levels were significantly associated with a low risk of CRC (HR, 0.65 [95% CI, 0.44 to 0.97]; and HR, 0.44 [95% CI, 0.29 to 0.69]; respectively). The cumulative incidence curves of CRC according to serum ferritin levels are shown in Fig. 2. In the highest quartile, the curve was distinctly separated from other quartiles (Fig. 2), and the incidence (1.23 per 1,000 people) was also lower than that in other quartiles (Table 3).
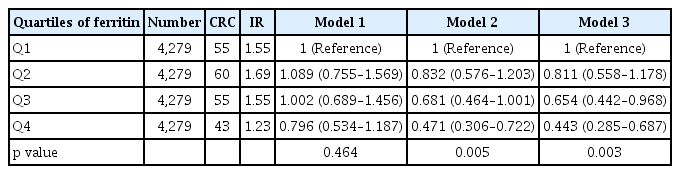
HR and 95% CI for the association between colorectal cancer risk and serum ferritin
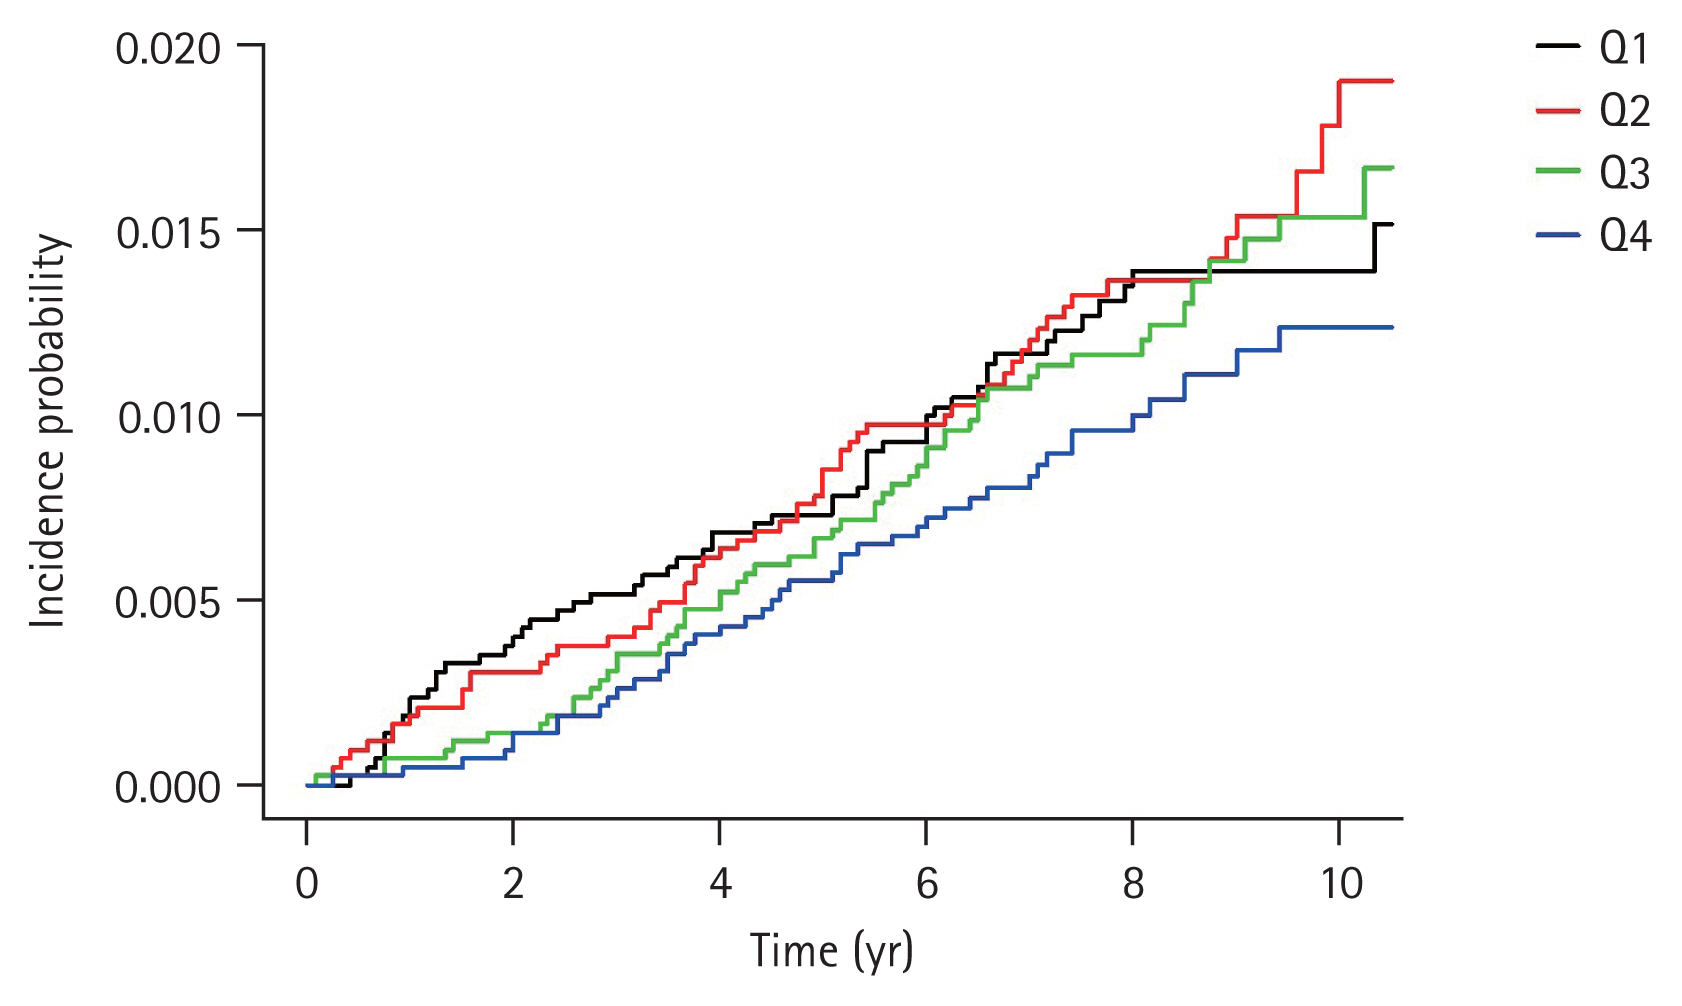
Cumulative incidence curves for colorectal cancer according to the quartiles of serum ferritin.
Subgroup analysis: CRC risk and serum ferritin levels
We evaluated the association between CRC risk and serum ferritin levels in subgroups of age, sex, BMI, metabolic syndrome, DM, and anemia (Table 4). In each subgroup, the serum ferritin level was significantly associated with CRC risk in the age group of 40 to 64 years, males, BMI of < 25 kg/ m2, presence of metabolic syndrome, and absence of DM and anemia, respectively. Interestingly, the significance of ferritin was evident in the CRC risk in the subgroup without anemia and not vice versa. The age group of 40 to 64 years had the lowest HR 0.217 (95% CI, 0.1 to 0.468) among the subgroups. Male sex, BMI of < 25 kg/m2, presence of metabolic syndrome, absence of DM, and absence of anemia presented HRs of < 0.5 in the highest quartiles compared with those in the lowest quartiles (HR, 0.379 [95% CI, 0.216 to 0.665]; HR, 0.387 [95% CI, 0.22 to 0.681]; HR, 0.366 [95% CI, 0.181 to 0.74]; HR, 0.39 [95% CI, 0.236 to 0.644]; and HR, 0.44 [95% CI, 0.276 to 0.702]; respectively).
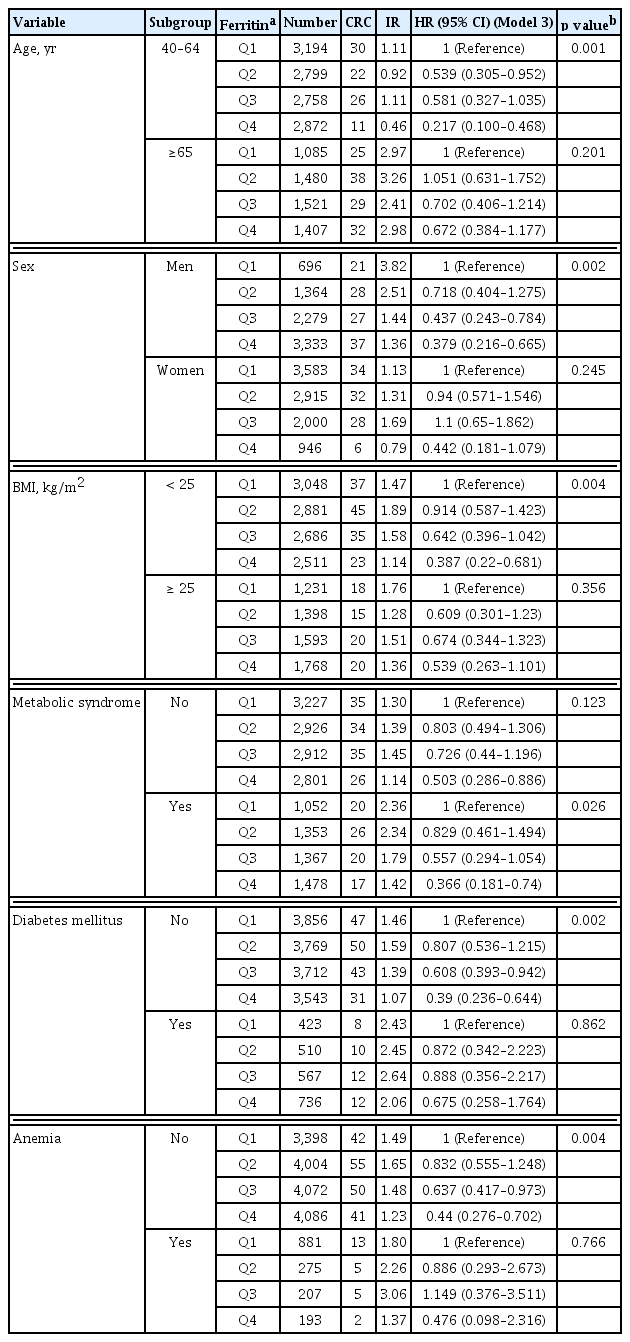
Subgroup analysis of the association between colorectal cancer risk and serum ferritin
DISCUSSION
This is the largest cohort study to analyze the relationship between serum ferritin levels and CRC risk in the Korean population. Serum ferritin levels were inversely associated with CRC risk. In subgroup analysis, there were significant differences in patients with young age and without obesity, DM, and anemia when compared with the other groups. Particularly, in men, a higher ferritin level showed a lower HR, but there was no correlation in women; hence, the sex-based difference was clear.
A study on the relationship between iron storage status and CRC risk conducted in the 1980s reported an increasing tendency of CRC risk in high transferrin saturation, unlike the results of our long-term follow-up study, but the data were not significant and the number of patients with CRC development was small, with only 12 cases [7]. The European Prospective Investigation into Cancer and Nutrition (EPIC)-Heidelberg study analyzed the relationship between iron status and cancer risk in various cancers. There were 256 CRC cases, and there was no difference in HR according to the quartile of serum ferritin levels [14]. However, in contrast to the abovementioned studies, three nested case-control studies reported an inverse association between serum ferritin levels and CRC risk [15–17]. In particular, Cross et al. [15] reported that CRC risk was inversely associated with serum ferritin level, serum iron level, and transferrin saturation, and all these markers were significant. On the contrary, although it is not CRC, in the EURGAST study which investigated stomach cancer risk, serum ferritin levels showed the strongest inverse relationship (HR of the fourth quartile to the first quartile 0.38; 95% CI, 0.25 to 0.57) among all markers of systemic iron status [18]. These previous studies were conducted in Western countries, hence epidemiological evidence on the association between ferritin levels and CRC risk in Asians is lacking. To the best of our knowledge, this is the first large-scale nationwide cohort study to investigate this topic in Asians. The results of a meta-analysis of studies comparing CRC patients with normal subjects support our findings, although it was not an epidemiological study; in this report, CRC patients from Eastern countries had significantly lower serum ferritin levels than normal subjects [9].
Two notable factors observed in the subgroup analysis of our study were age and sex. In terms of age, the significance of serum ferritin was prominent in those under 65 years of age but not in those aged 65 years or over. Elderly people are more prone to nutritional deficiency and chronic inflammation. Because these confounding factors can lead to an increase in the level of serum ferritin [19], it seems that the relationship between ferritin levels and CRC risk is more prominent among younger subjects than among elderly individuals. According to the 2011 to 2016 United States statistics, the incidence of CRC decreased by 3.3% per year for those over 65 years of age but increased by 1% per year for those aged 50 to 64 and by 2% per year for those under 50 years of age [2]. Therefore, considering the age-related differences in incidence patterns, active CRC screening is required if younger people have low serum ferritin levels. Second, there was a sex-based difference in the effect of ferritin on CRC risk. In men, the HR of CRC incidence related to ferritin tended to decrease from Q2 to Q4, and there was a clear difference between the HRs of Q4 and Q2. A difference in CRC risk according to ferritin level was also observed in women, but the difference was not significant. The reason seems to be related to iron intake in women, and as shown in Table 2, the serum ferritin level in women is lower than that in men. The results of a dietary survey showed that, in general, many women had insufficient intake of red meat containing heme iron [20]. In addition, many fertile women exhibited negative iron balance because the intake patterns of foods containing ingredients that impede iron absorption were higher than those of men, and there was also blood loss due to menstruation. These factors may cause complexity in analyzing the relationship between serum ferritin levels and CRC risk in women, unlike men. This may explain the sex-based difference shown in our study. This sex-based difference has previously been reported by Ekblom et al. [16] where, similar to our study, the reduction of CRC risk with an increase in serum ferritin levels was significantly observed only in men. Therefore, young men with low serum ferritin levels should be carefully considered in active CRC screening tests.
There is strong evidence to suggest that dyslipidemia, hypertension, waist circumference, fasting glucose level, and metabolic syndrome are associated with increased CRC risk [13,21–24]. In our study, serum ferritin levels in participants with metabolic syndrome showed a strong inverse correlation. Interestingly, the HR of participants without metabolic syndrome was also less than 0.6 (HR, 0.503; 95% CI, 0.286 to 0.886). This suggests that serum ferritin levels are associated with CRC risk, regardless of the presence or absence of metabolic syndrome. In addition, serum ferritin levels were significantly associated with CRC risk in participants with non-anemia and BMI of < 25 kg/m2 but not in those with anemia and BMI of ≥ 25 kg/m2.
Therefore, in view of these considerations, serum ferritin can assist in identifying people who need active CRC screening tests among healthy people who do not have risk factors commonly known to be related to CRC risk such as anemia, obesity, and metabolic syndrome.
Epidemiological evidence that excessive iron intake increases CRC risk has been reported historically [4]. Most ingested iron is not absorbed and reaches the colorectum [4]. Adenomatous polyposis coli deletion, which is found in most CRC cases, induces the intracellular accumulation of iron in the colorectal epithelium [25]. This activates and enhances the Wnt pathway, a major oncogenic signaling pathway in CRC [25]. As such, there is epidemiological and biological evidence for the association between iron intake and CRC risk, but in a large cohort study, there was no direct correlation between iron intake and systemic iron status [17]. Moreover, contrary to studies showing that iron increases carcinogenic risk because iron is an important factor in genome protection, there are reports that iron deficiency induces oxidative stress and DNA damage, and this is particularly involved in tumorigenesis in gastrointestinal cancer [26]. Therefore, there is still much to be clarified regarding the mechanism of the inverse association between ferritin levels and CRC risk identified in our study.
Aside from CRC pathogenesis in the cellular level of iron and ferritin, this inverse relationship between serum ferritin and CRC risk may be interpreted as a result of undetectable micro-bleeding, which is commonly observed in CRC. A previous study with 9,238 CRC patients reported that serum ferritin levels measured within 180 days of CRC diagnosis were low values [27]. Serum ferritin levels measured around 1 year were normal in most cases [27]. This suggests that factors such as micro-bleeding may affect the change of serum ferritin levels in CRC. However, contrary to this previous result, Kishida et al. [28] reported no difference in serum iron levels in the early-stage CRC compared with those in healthy subjects. Therefore, there is insufficient evidence to explain the causal relationship between serum ferritin and CRC risk, although serum ferritin levels were inversely associated with CRC risk in our study.
Our study has some limitations. Ferritin levels can increase in acute inflammatory states [8]. Therefore, serum C-reactive protein (CRP) levels can help differentiate acute infection or inflammatory disease, but we did not determine CRP values in the participants. However, because the KNHANES was conducted on healthy people, participants with acute infection may have been excluded. In addition, comprehensive iron status was not investigated, and periodic follow-up was not performed. All inspections and investigations in our study were carried out at the national administrative level; therefore, academic aspects of the inspection items were not sufficiently detailed. Second, micro-bleeding of undetectable early-stage CRC and consequent iron deficiency may be a confounding factor in our results. An analysis of the time interval from the measurement of serum ferritin level to the diagnosis of CRC may indirectly provide a clue to this question. However, evaluation of the HR according to time intervals from the time of registration to the time of diagnosis of CRC could not be performed because of limitations of the available data. Instead, in a previous cohort study on stomach cancer, where there is a risk of iron loss due to micro-bleeding, the risk of gastric cancer and serum ferritin levels was inversely related, regardless of the time interval [18]. Another limitation of this study is that our main result is not sex-specific. Since there is a difference in serum ferritin levels according to sex, there may be controversy over applying our results equally to both men and women, although this result was adjusted for sex. To compensate for this limitation, we presented the result of subgroup analysis according to sex.
Despite these limitations, the present study has some strengths. It is the first large-scale cohort study conducted nationwide in an Asian population, and it is a cohort study with long-term follow-up. Contrary to the general results between excess iron intake and cancer risk, this study showed an inverse relationship between serum ferritin levels and CRC risk. In relation to CRC risk, it can be inferred that systemic iron status affects carcinogenesis differently from that of intraluminal iron. Additionally, the inverse relationship between ferritin levels and CRC risk was more prominent in young individuals and males, and a similar trend was found even in the absence of metabolic syndrome, commonly known to induce CRC risk. Therefore, in the case of healthy young men with low serum ferritin levels, more careful observation regarding the risk of CRC is required. To further clarify the significance of our findings, additional research is needed on how systemic iron status, including ferritin, affects colorectal carcinogenesis through interactions in the human body.
KEY MESSAGE
1. There is an inverse association between serum ferritin and colorectal cancer (CRC) risk.
2. Serum-ferritin measurement can aid in identifying young adults who need active CRC-screening tests.
Acknowledgments
This research was supported by a grant from the Korea Health Technology R&D Project through the Korea Health Industry Development Institute (KHIDI), funded by the Ministry of Health & Welfare, Republic of Korea, grant number HI18C0275.
Notes
No potential conflict of interest relevant to this article was reported.