Analysis of the gut microbiome using extracellular vesicles in the urine of patients with colorectal cancer
Article information
Abstract
Background/Aims
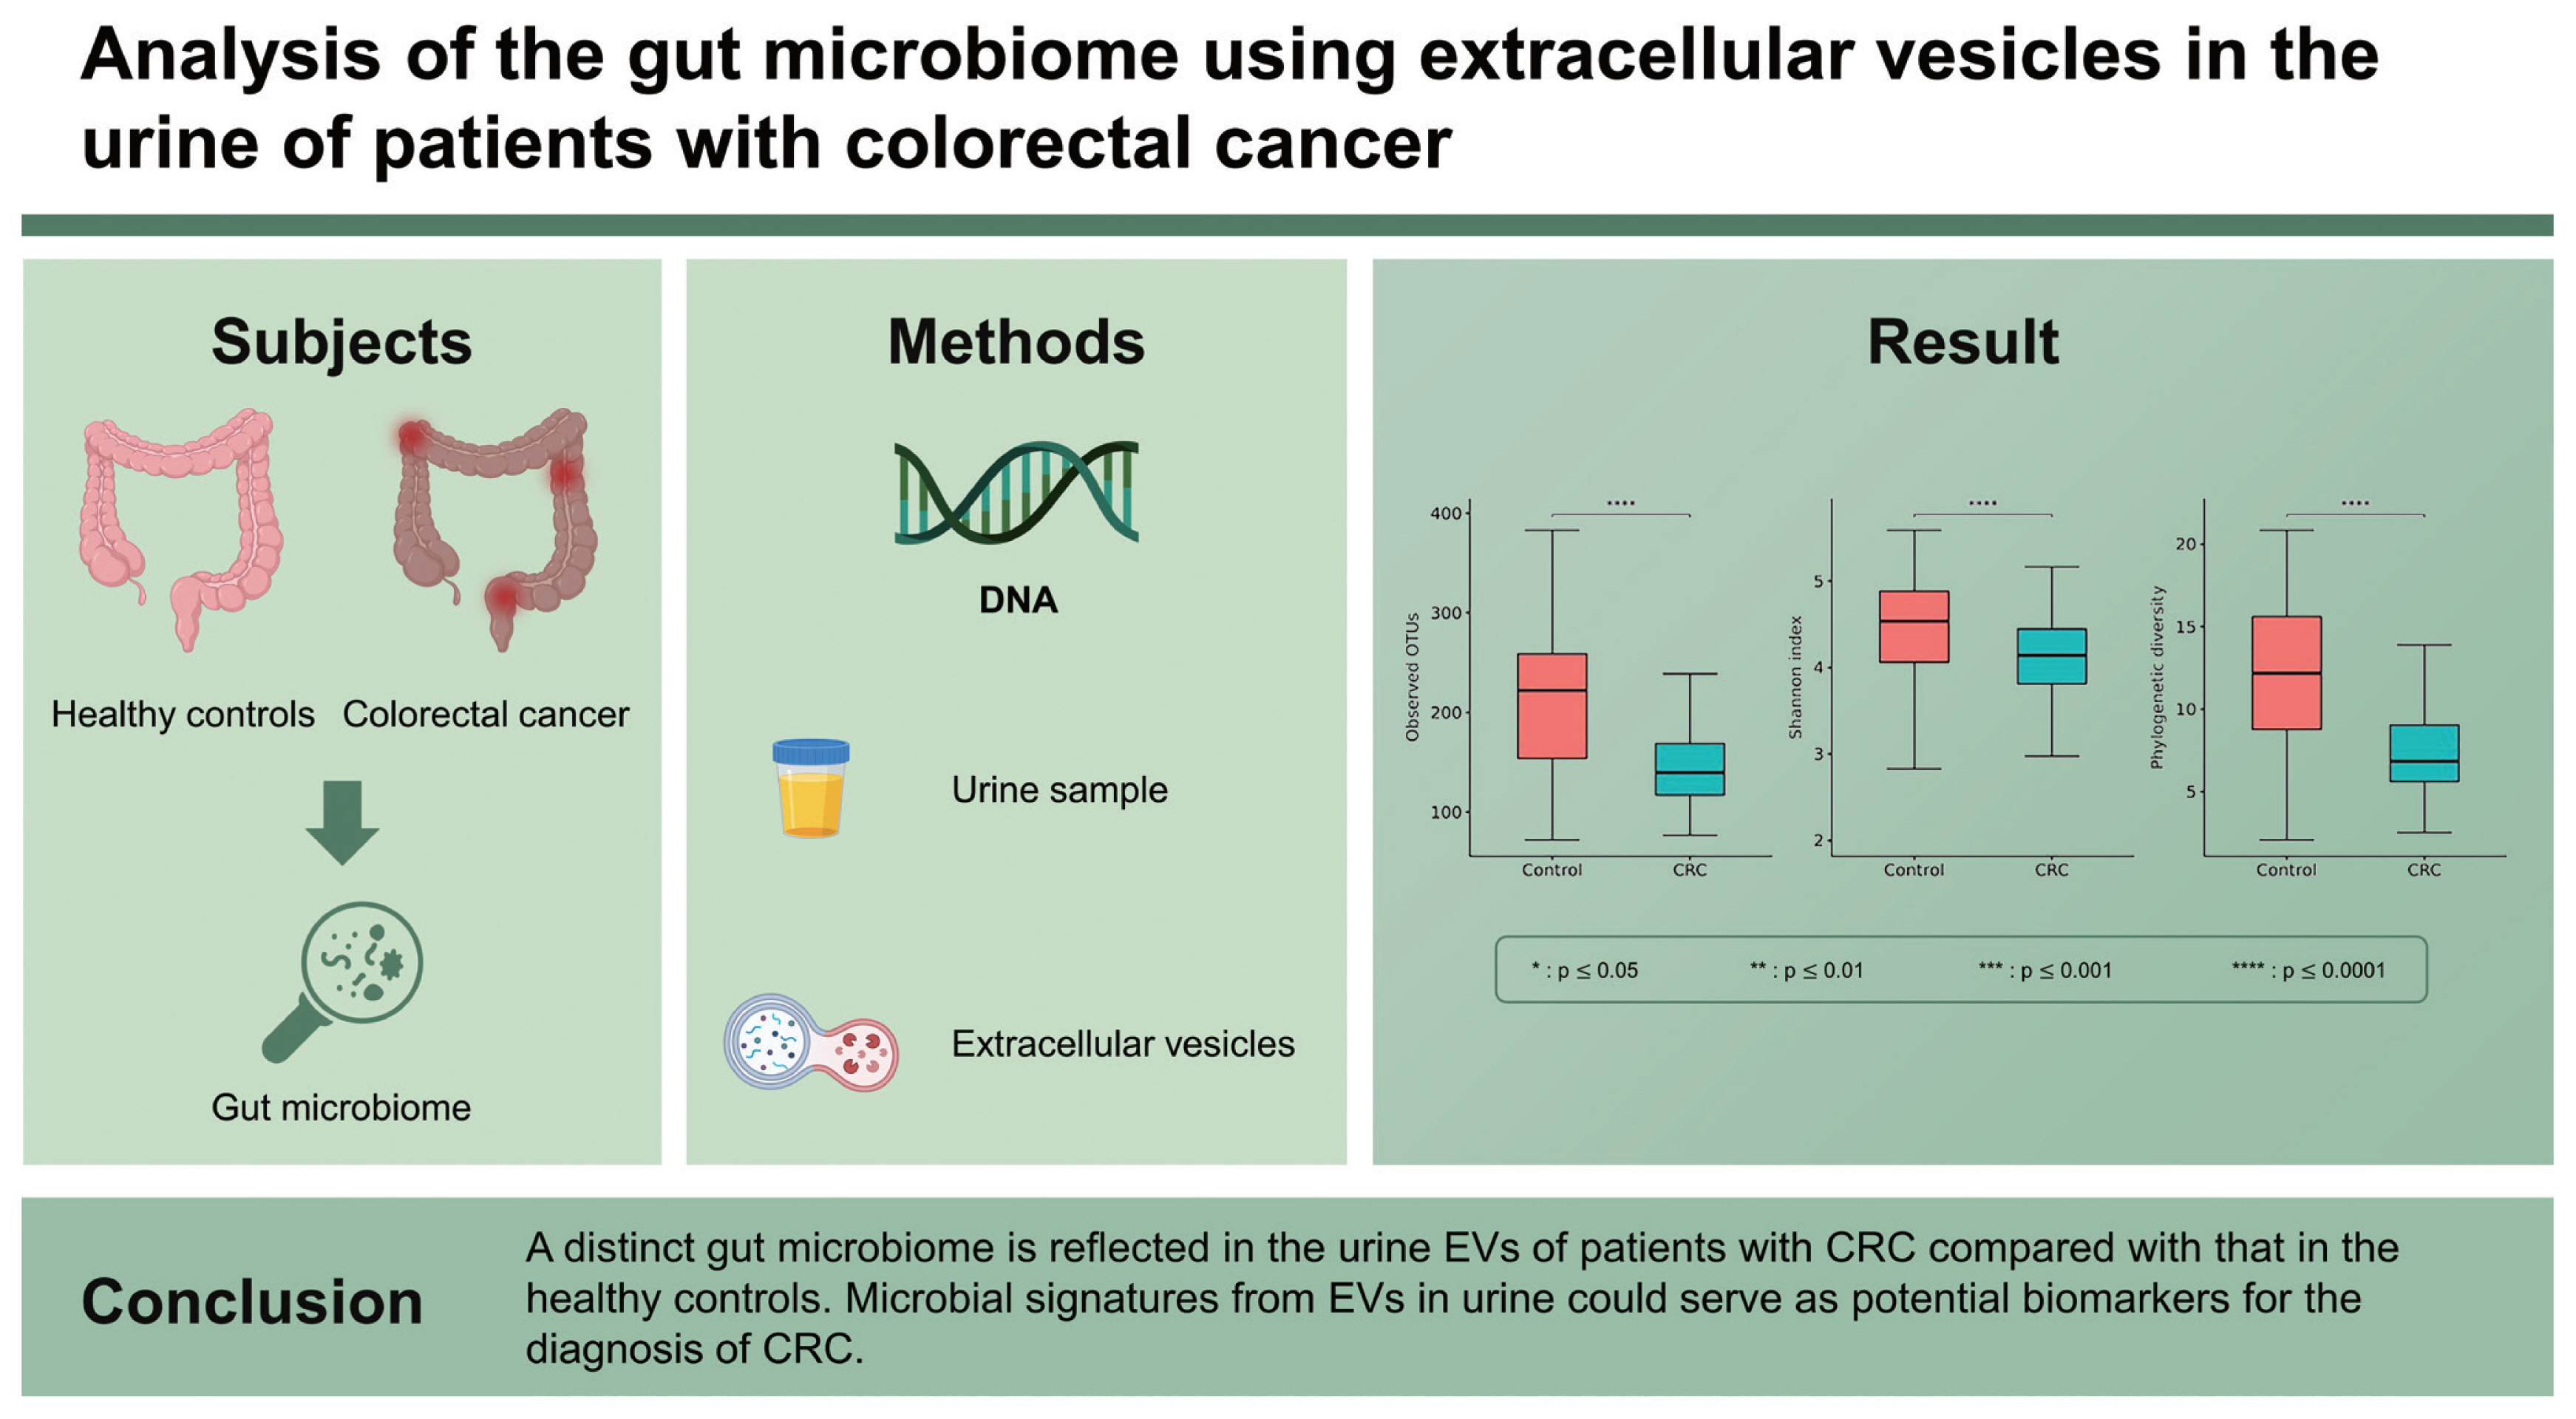
We evaluated the gut microbiome using extracellular vesicles (EVs) in the urine of patients with colorectal cancer (CRC) to determine whether gut-microbe-derived EVs could be a potential biomarker for the diagnosis of CRC.
Methods
EVs were isolated from the urine of patients with CRC and healthy controls. DNA was extracted from the EVs, and the bacterial composition was analyzed using next-generation sequencing of the 16S rRNA.
Results
A total of 91 patients with CRC and 116 healthy controls were enrolled. We found some specific microbiomes that were more or less abundant in the CRC group than in the control group. The alpha-diversity of the gut microbiome was significantly lower in the CRC group than in the control group. A significant difference was observed in the beta-diversity between the groups. The alpha-diversity indices between patients with early- and late-stage CRC showed conflicting results; however, there was no significant difference in the beta-diversity according to the stage of CRC. There was no difference in the alpha- and beta-diversity of the gut microbiome corresponding to the location of CRC (proximal vs. distal).
Conclusions
A distinct gut microbiome is reflected in the urine EVs of patients with CRC compared with that in the healthy controls. Microbial signatures from EVs in urine could serve as potential biomarkers for the diagnosis of CRC.
INTRODUCTION
The advent of next-generation sequencing has enabled the bulk analysis of unculturable microorganisms. Therefore, studies on the gut microbes pertaining to the etiology of colorectal cancer (CRC) have been actively conducted using fecal samples [1,2]. However, limited studies have been conducted on the analysis of extracellular vesicles (EVs) secreted by gut microbes in patients with CRC. Bacteria-derived EVs are secreted by bacteria for communication with other bacteria and host cells [3]. They are composed of various substances such as proteins, lipids, and nucleic acids. As the amount of EVs varies depending on the extracellular environment, it is considered that EVs reflect the activity of bacteria. Bacteria-derived EVs also contain bacterial DNA. Therefore, rather than using the bacterial DNA in feces, DNA analysis of filtered bacterial EVs can indirectly reveal bacterial activity. Considering the recent claim that the activity and metabolites of gut microbes, rather than the composition of gut microbes, are more important in the pathogenesis of CRC [4], the analysis of bacteria-derived EVs has a greater potential than microbiome analysis.
Additionally, some EVs generated by the gut microbes circulate throughout the body via the colonic mucosa and vascular system of the host [5]. They are then eventually excreted in the urine. The convenience of collecting urine compared with other bodily fluids makes it an ideal source of bacteria-derived EVs to analyze the interaction between the gut microbes and the host. Therefore, we evaluated the gut microbiome using EVs extracted from the urine of patients with CRC to determine whether gut microbe-derived EVs could be a potential biomarker for the diagnosis of CRC.
METHODS
Patients
Patients recently diagnosed with CRC at the Seoul National University Bundang Hospital (Seongnam, Republic of Korea) and Chung-Ang University College of Medicine (Seoul, Republic of Korea) were prospectively enrolled in this study. The exclusion criteria were as follows: (1) patients with a history of other malignancies; (2) pregnant women; and (3) patients who were taking antibiotics or probiotics in the past 3 months. Early and late stages of CRC were defined as stages I–III and stage IV, respectively. Proximal CRC was defined as cancer located between the cecum and splenic flexure; distal CRC was defined as cancer located between the splenic flexure and rectum. Urine of the patients was collected before initiating treatment and frozen at −70°C. Control urine samples were obtained from a cohort of healthy individuals with abdominal symptoms but diagnosed as negative for irritable bowel syndrome. Data on the clinical risk factors for CRC, such as smoking history, alcohol consumption history, and body mass index, were collected from all subjects [6]. This study was approved by the Institutional Review Board of Seoul National University Bundang Hospital (IRB No: B-1708/412-301) and Chung-Ang University Hospital (IRB No: 1772-001-290). A written informed consent to participate in this study was obtained from all participants.
Isolation of EVs and extraction of DNA
Bacterial EVs were isolated from the urine of each patient following the procedure described previously [7]. Briefly, each urine sample was centrifuged at 10,000 × g for 10 minutes at 4°C and filtered through a 0.22-μm membrane filter to remove bacteria and foreign particles. The isolated EVs were then boiled at 100°C for 40 minutes, centrifuged at 13,000 rpm for 30 minutes at 4°C, and the supernatant was collected. DNA was extracted using the DNeasy Power-Soil Kit (QIAGEN, Hilden, Germany) and quantified using the QIAxpert system (QIAGEN).
Bacterial metagenomic analysis using DNA from EVs
Bacterial genomic DNA was amplified using primers 16S_V3_F (5′-TCGTCGGCAGCGTCAGATGTGTATAAGAGACAGCCTACGGGNGGCWGCAG-3′)and16S_V4_R(5′-GTCTCG TGGGCTCGGAGATGTGTATAAGAGACAGGACTACH-VGGGTATCTAATCC-3′), which are specific for the V3–V4 hypervariable regions of the 16S rRNA gene. The libraries were prepared using the polymerase chain reaction products according to the MiSeq System guide (Illumina, San Diego, CA, USA) and quantified using QIAxpert (QIAGEN). Each amplicon was then quantified, equimolar ratio adjusted, pooled, and sequenced on MiSeq (Illumina) according to the manufacturer’s recommendations.
Analysis of microbiome derived from EVs
Paired-end reads that matched the adapter sequences were trimmed using Cutadapt version 1.1.6 with a minimum overlap of 11 bases, maximum error rate of 15%, and minimum length of 10 bases [8]. The resulting FASTQ files containing paired-end reads were merged using CASPER version 0.8.2 with a mismatch ratio of 0.27 and quality filtered using the Phred (Q) score-based criteria described by Bokulich [9,10]. The reads shorter than 350 bp and longer than 550 bp after merging were discarded. To identify the chimeric sequences, a reference-based chimera detection step was conducted using VSEARCH version 2.3.0 against the SILVA gold database [11,12]. The sequence reads were clustered into operational taxonomic units (OTUs) using VSEARCH with open clustering algorithm under a threshold of 97% sequence similarity. The representative sequences of the OTUs were finally classified using the SILVA 132 database with UCLUST (parallel_assign_taxonomy_uclust.py script in the QIIME version 1.9.1) under default parameters [13].
Statistical analyses
Group comparisons for diversity metrics were conducted and graphed using R version 3.6.3 (R Foundation for Statistical Computing, Vienna, Austria). Alpha-diversity indices (observed OTUs, Shannon index, and phylogenetic diversity) were compared through the decimal log-transformed relative abundance of the microbiome between groups using Wilcoxon rank sum test (R package “microbiome” version 1.9.19). Group distances for beta-diversity indices (weighted-UniFrac metric, unweighted UniFrac metric, Bray-Curtis dissimilarity, and Jacaard distance) were generated through the permutational analysis of variance (PERMANOVA) using 1000 Monte Carlo permutations (R packages “phyloseq” version 1.30.0 and “vegan” version 2.5.6); principal coordinate analysis (PCoA) plots were generated for visualization. Discriminate taxa (abundance > 0.1%) between the groups were identified using Welch’s t test. Adjusted p values controlling the false discovery rate were reported where appropriate. Results were considered significant when p values were less than 0.05.
RESULTS
Baseline characteristics of the subjects
The CRC group consisted of older individuals and predominantly male compared with the control group (Supplementary Table 1). The proportion of subjects with a history of smoking and alcohol consumption was also significantly higher in the CRC group than in the control group.
Evaluation of the gut microbiome from the urine-derived EVs
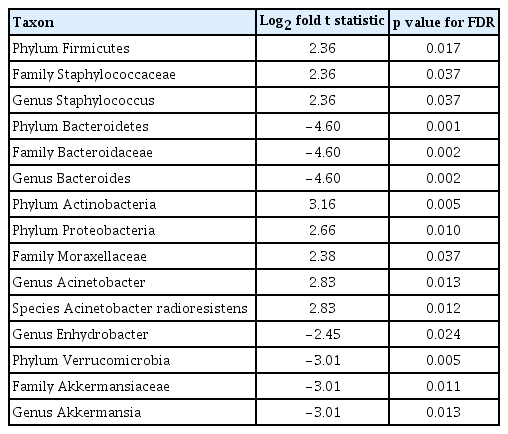
The 16S rRNA sequencing data were obtained from 207 urine samples (91 patients with CRC and 116 healthy controls). The gut microbiome from the urine-derived EVs was compared at the phylum, family, and genus levels (Fig. 1A–1C). The CRC group showed a significant enrichment of the phyla Firmicutes (p = 0.017), Actinobacteria (p = 0.005), and Proteobacteria (p = 0.010) compared with the control group (Table 1). In contrast, the phyla Bacteroidetes (p = 0.001) and Verrucomicrobia (p = 0.005) were relatively depleted in the CRC group compared with those in the control group. At the genus level, Staphylococcus (p = 0.037) and Acinetobacter (p = 0.012) were significantly more abundant in the CRC group than in the control group. However, Bacteroides (p = 0.002), Enhydrobacter (p = 0.024), and Akkermansia (p = 0.013) were significantly less abundant in the CRC group than in the control group.
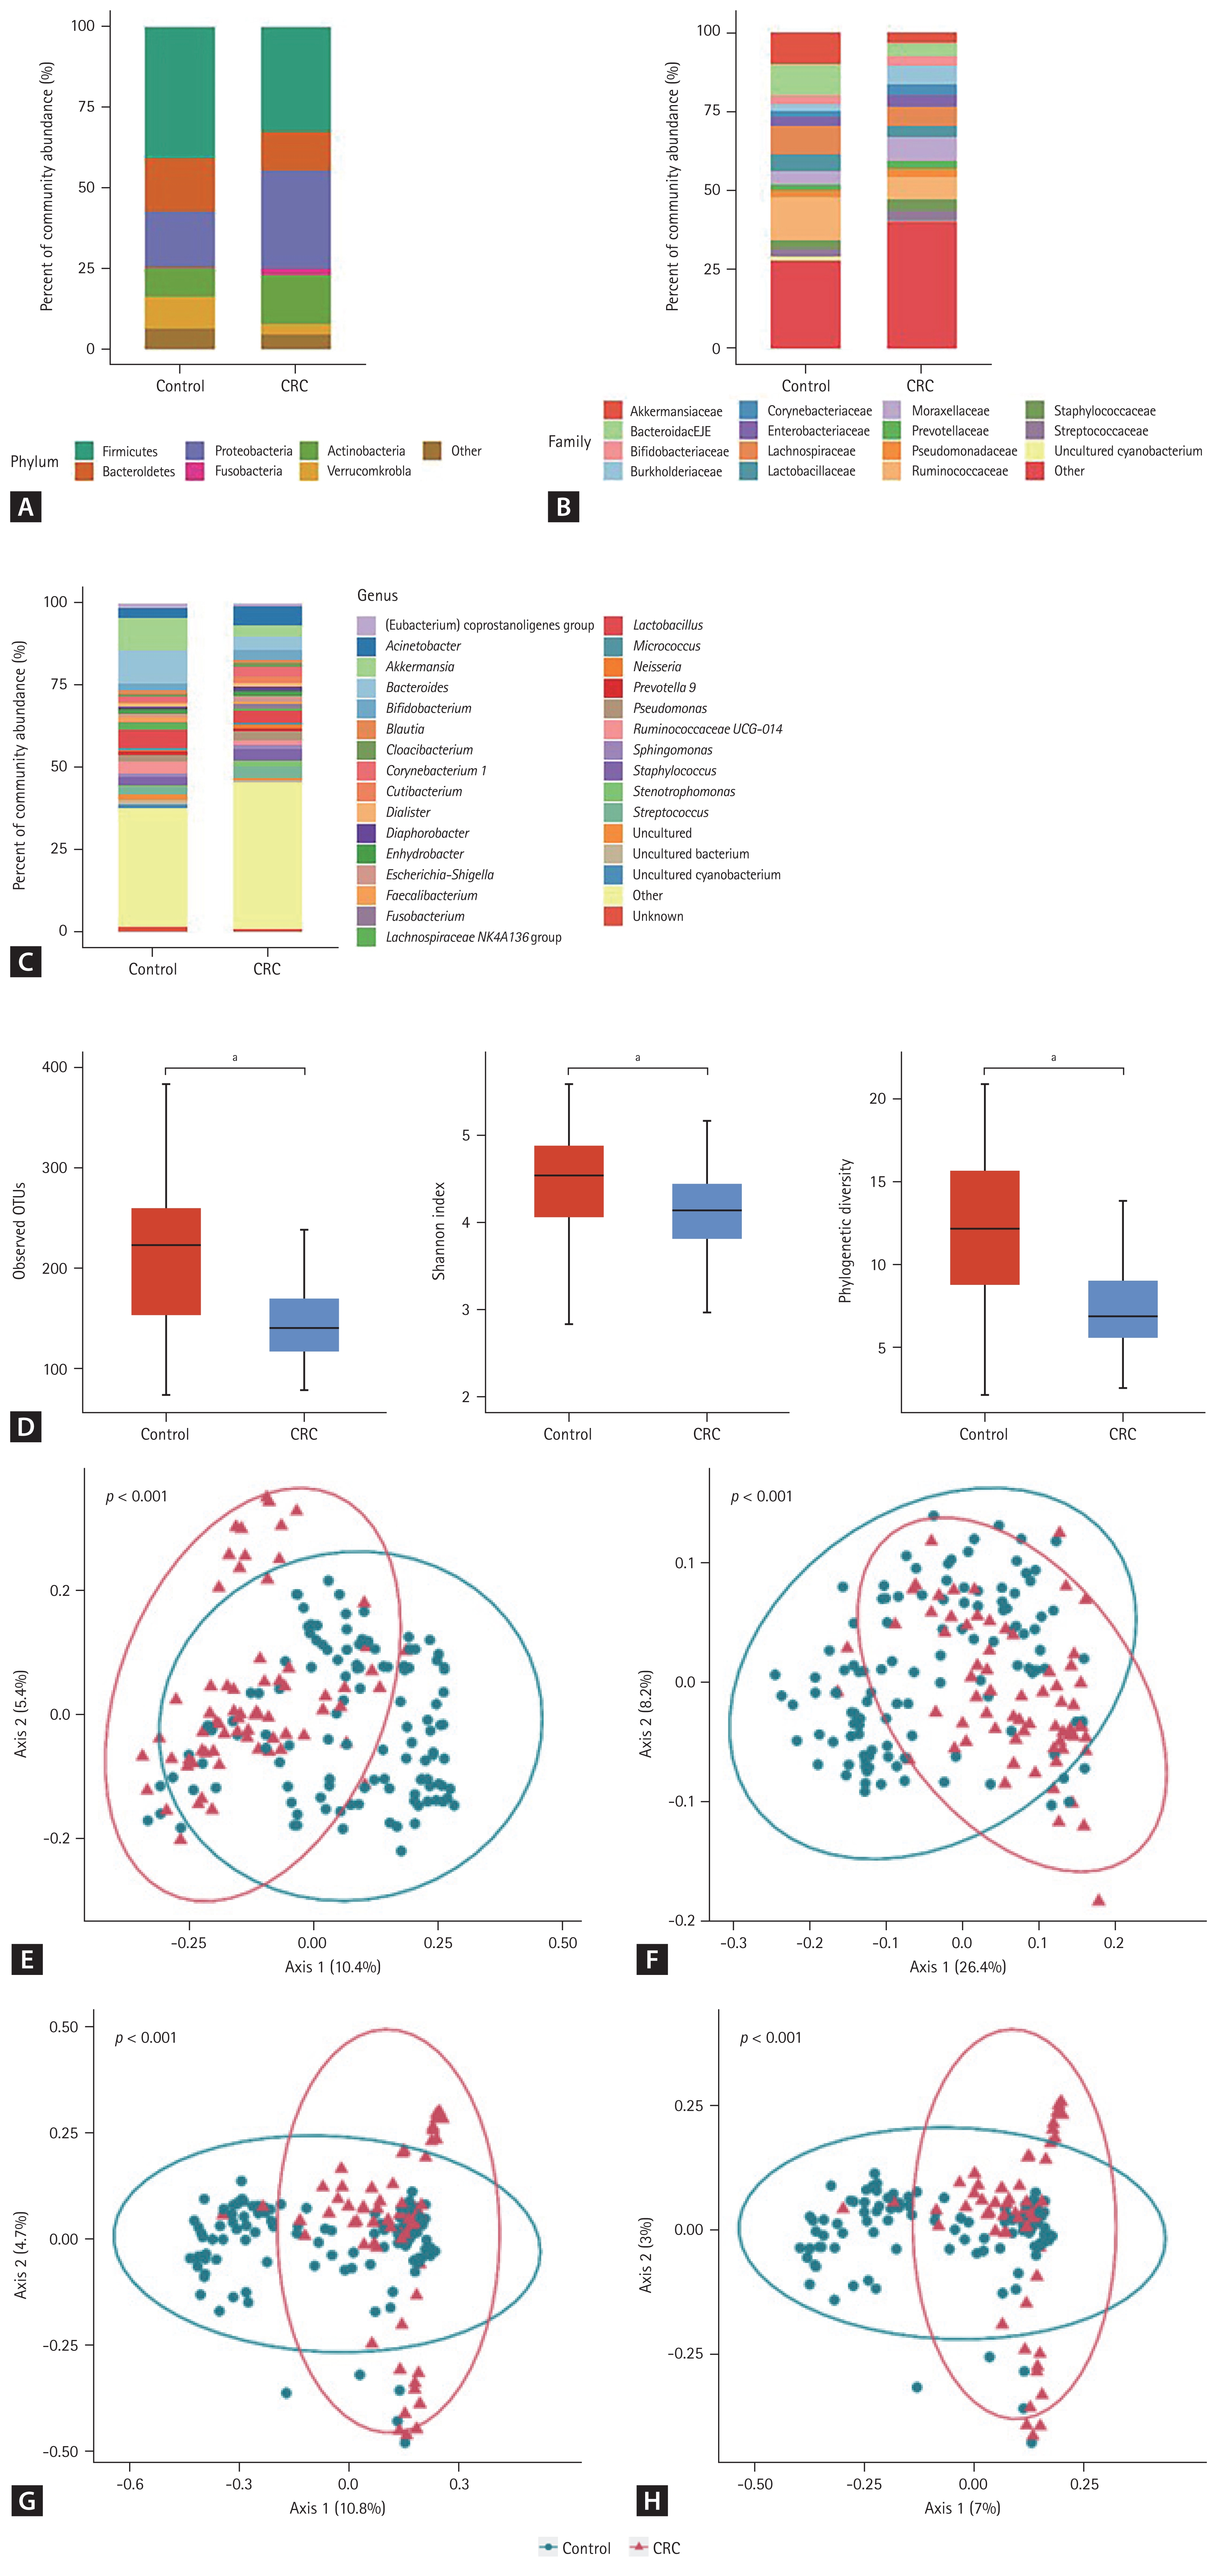
Taxonomic composition (A–D) and principal coordinate analysis (E–H) of the gut microbiome derived from the urine extracellular vesicles of patients with colorectal cancer and healthy controls. (A) Phylum level, (B) family level, (C) genus level, (D) alpha-diversity, (E) UniFrac distance, (F) weighted-UniFrac distance, (G) Bray-Curtis dissimilarity, and (H) Jacaard distance. CRC, colorectal cancer; OTU, operational taxonomic unit. a p ≤ 0.0001.
Relative abundances of the gut microbiota in urine extracellular vesicles
Twenty-two patients in the CRC group who had missing values for clinical factors were excluded because we could not adjust these factors to analyze the diversity of gut microbiome. Therefore, the analysis of alpha- and beta-diversity was performed in 69 patients with CRC and 116 healthy controls. The median of the observed OTUs was 222 (interquartile range [IQR], 154 to 259) in the control group and 140 (IQR, 117 to 169) in the CRC group (p < 0.001) (Fig. 1D). The alpha-diversity of the CRC group was significantly lower than that of the control group (Shannon index, p < 0.001; and phylogenetic diversity, p < 0.001). The beta-diversity between the control and CRC groups was significantly different in all metrics (UniFrac distance, p < 0.001; weighted-UniFrac distance, p < 0.001; Bray-Curtis dissimilarity, p < 0.001; and Jacaard distance, p < 0.001) (Fig. 1E–1H). Axis 1 could account for 7.0% to 26.4% of the variance in microbiomes between the CRC and control groups in the PCoA.
Differences in the gut microbiome according to the stage and location of CRC
The proportions of early and late stages of CRC were 87% and 13%, respectively. The composition of the gut microbiome in the urine-derived EVs at the phylum, family, and genus levels was not significantly different between the early- and late-stage-CRC groups (Fig. 2A–2C). A comparison of indices of alpha-diversity between patients with early- and late-stage CRC showed conflicting results (Fig. 2D). The number of observed OTUs and Shannon index of the late-stage-CRC group were significantly higher than those of the early-stage-CRC group (p = 0.017 and p = 0.016, respectively). However, the phylogenetic diversity of these two groups was not significantly different (p = 0.113). Moreover, there was no significant difference in beta-diversity between the early- and late-stage-CRC groups (Fig. 2E–2H).
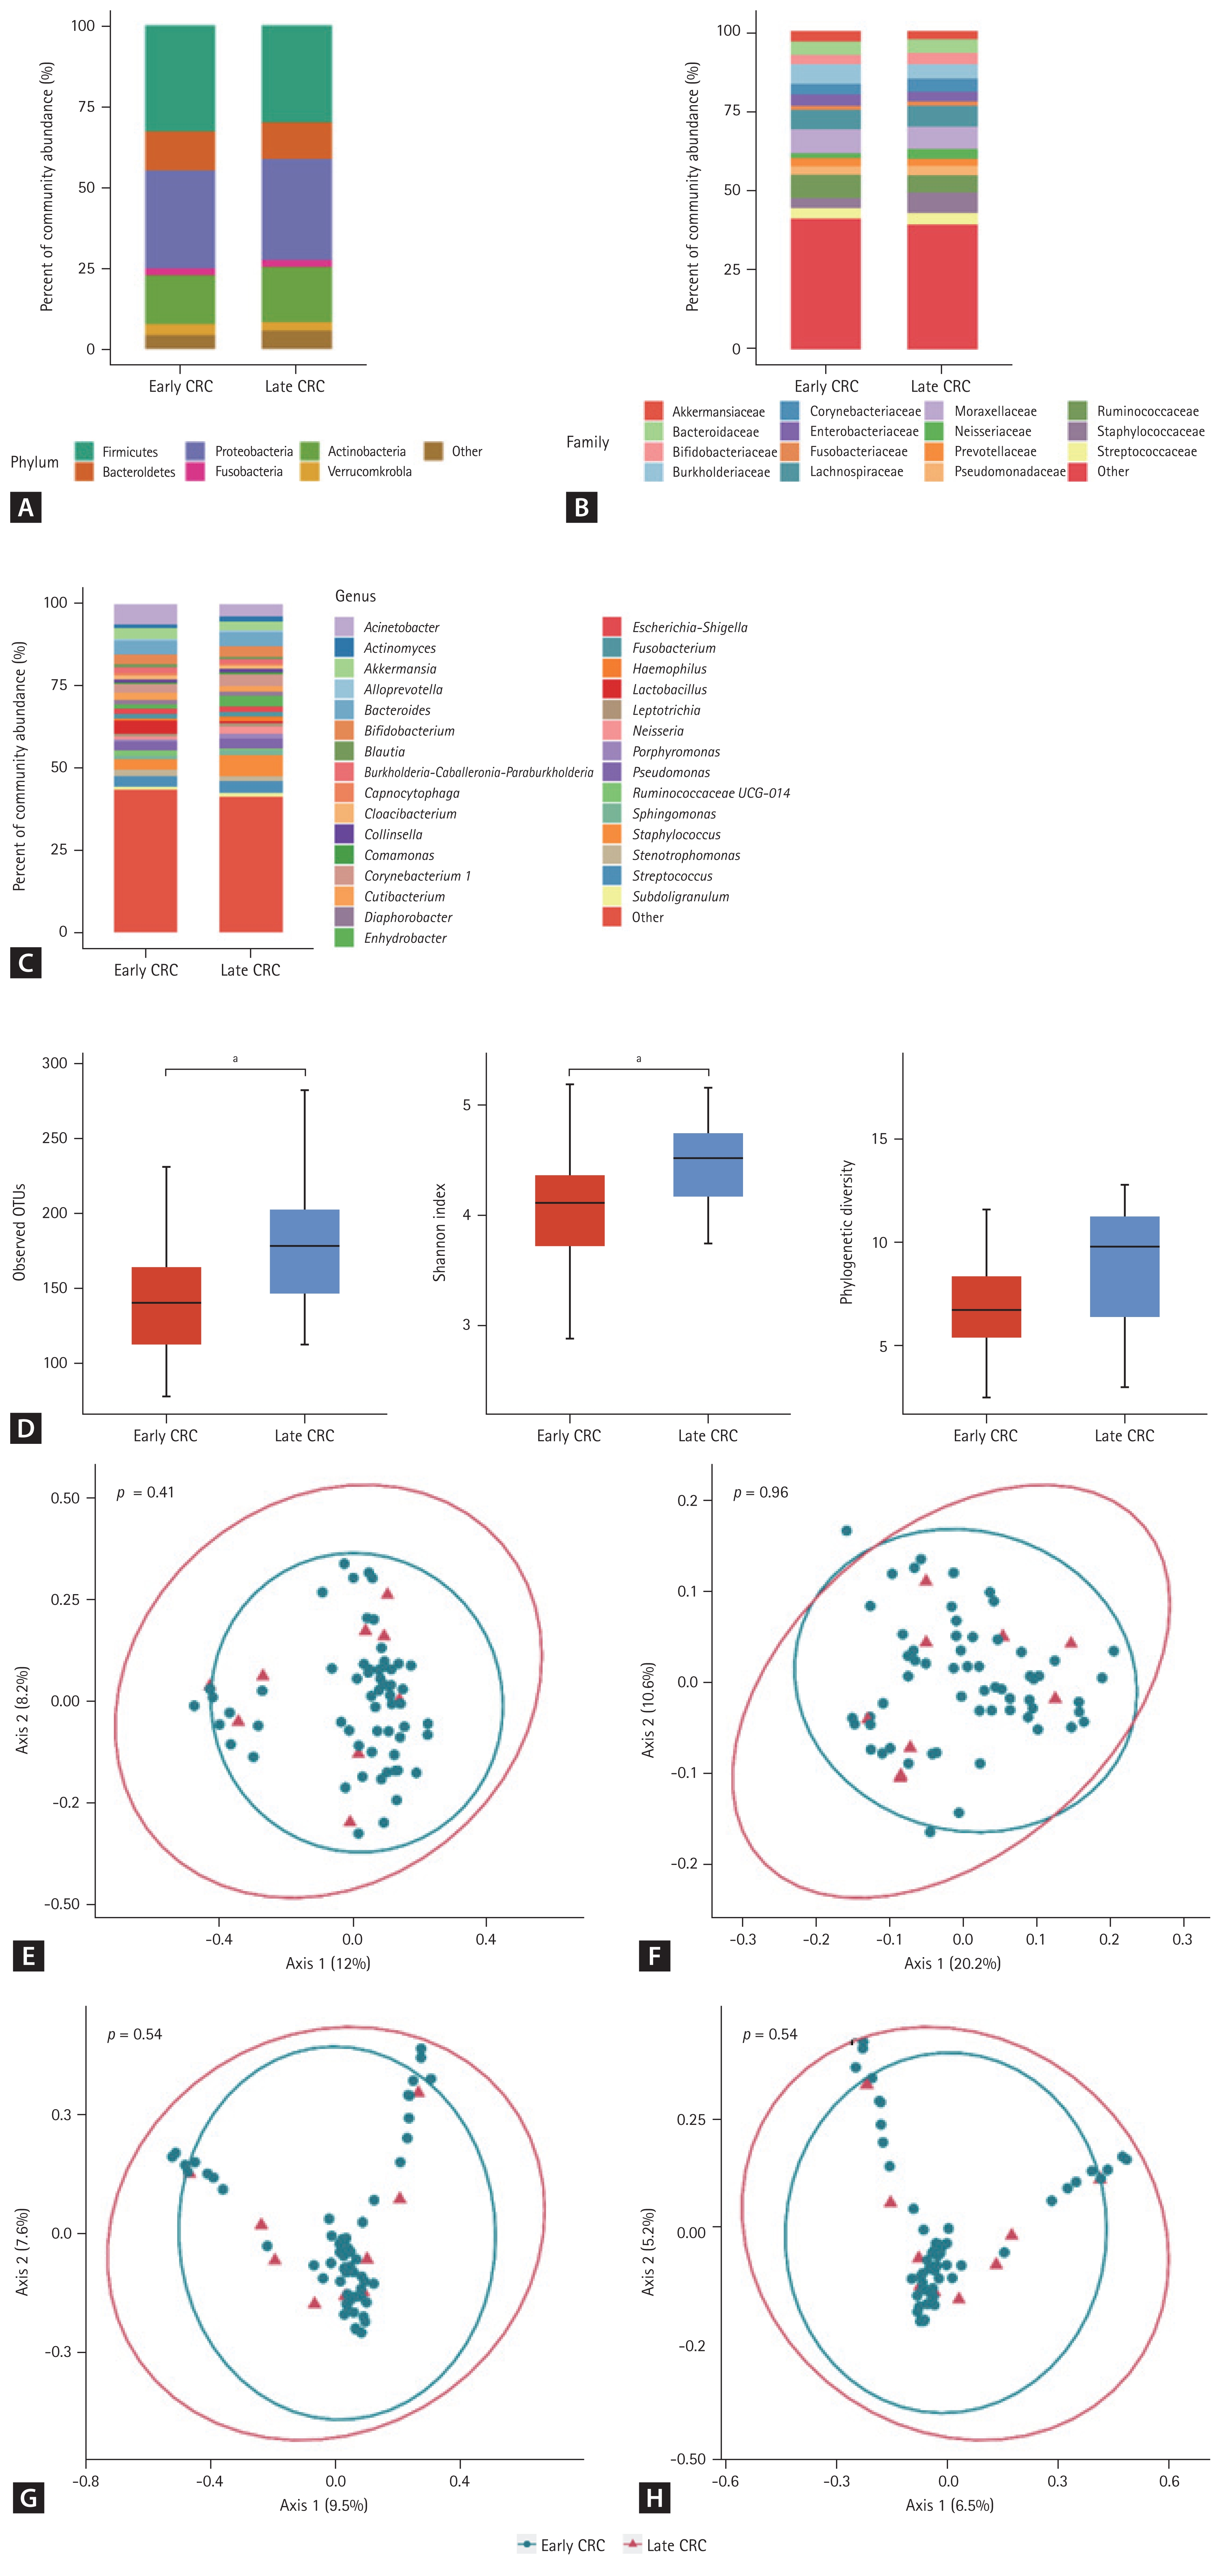
Taxonomic composition (A–D) and principal coordinate analysis (E–H) of the gut microbiome derived from the urine extracellular vesicles of patients with early and late colorectal cancer. (A) Phylum level, (B) family level, (C) genus level, (D) alpha-diversity, (E) UniFrac distance, (F) weighted-UniFrac distance, (G) Bray-Curtis dissimilarity, and (H) Jacaard distance. CRC, colorectal cancer; OTU, operational taxonomic unit. a p ≤ 0.05.
The proportions of the proximal and distal locations of CRC were 29% and 71%, respectively. The composition of the gut microbiome (Fig. 3A–3C), alpha-diversity (Fig. 3D), and beta-diversity (Fig. 3E–3H) did not differ according to the location of CRC (proximal CRC vs. distal CRC).
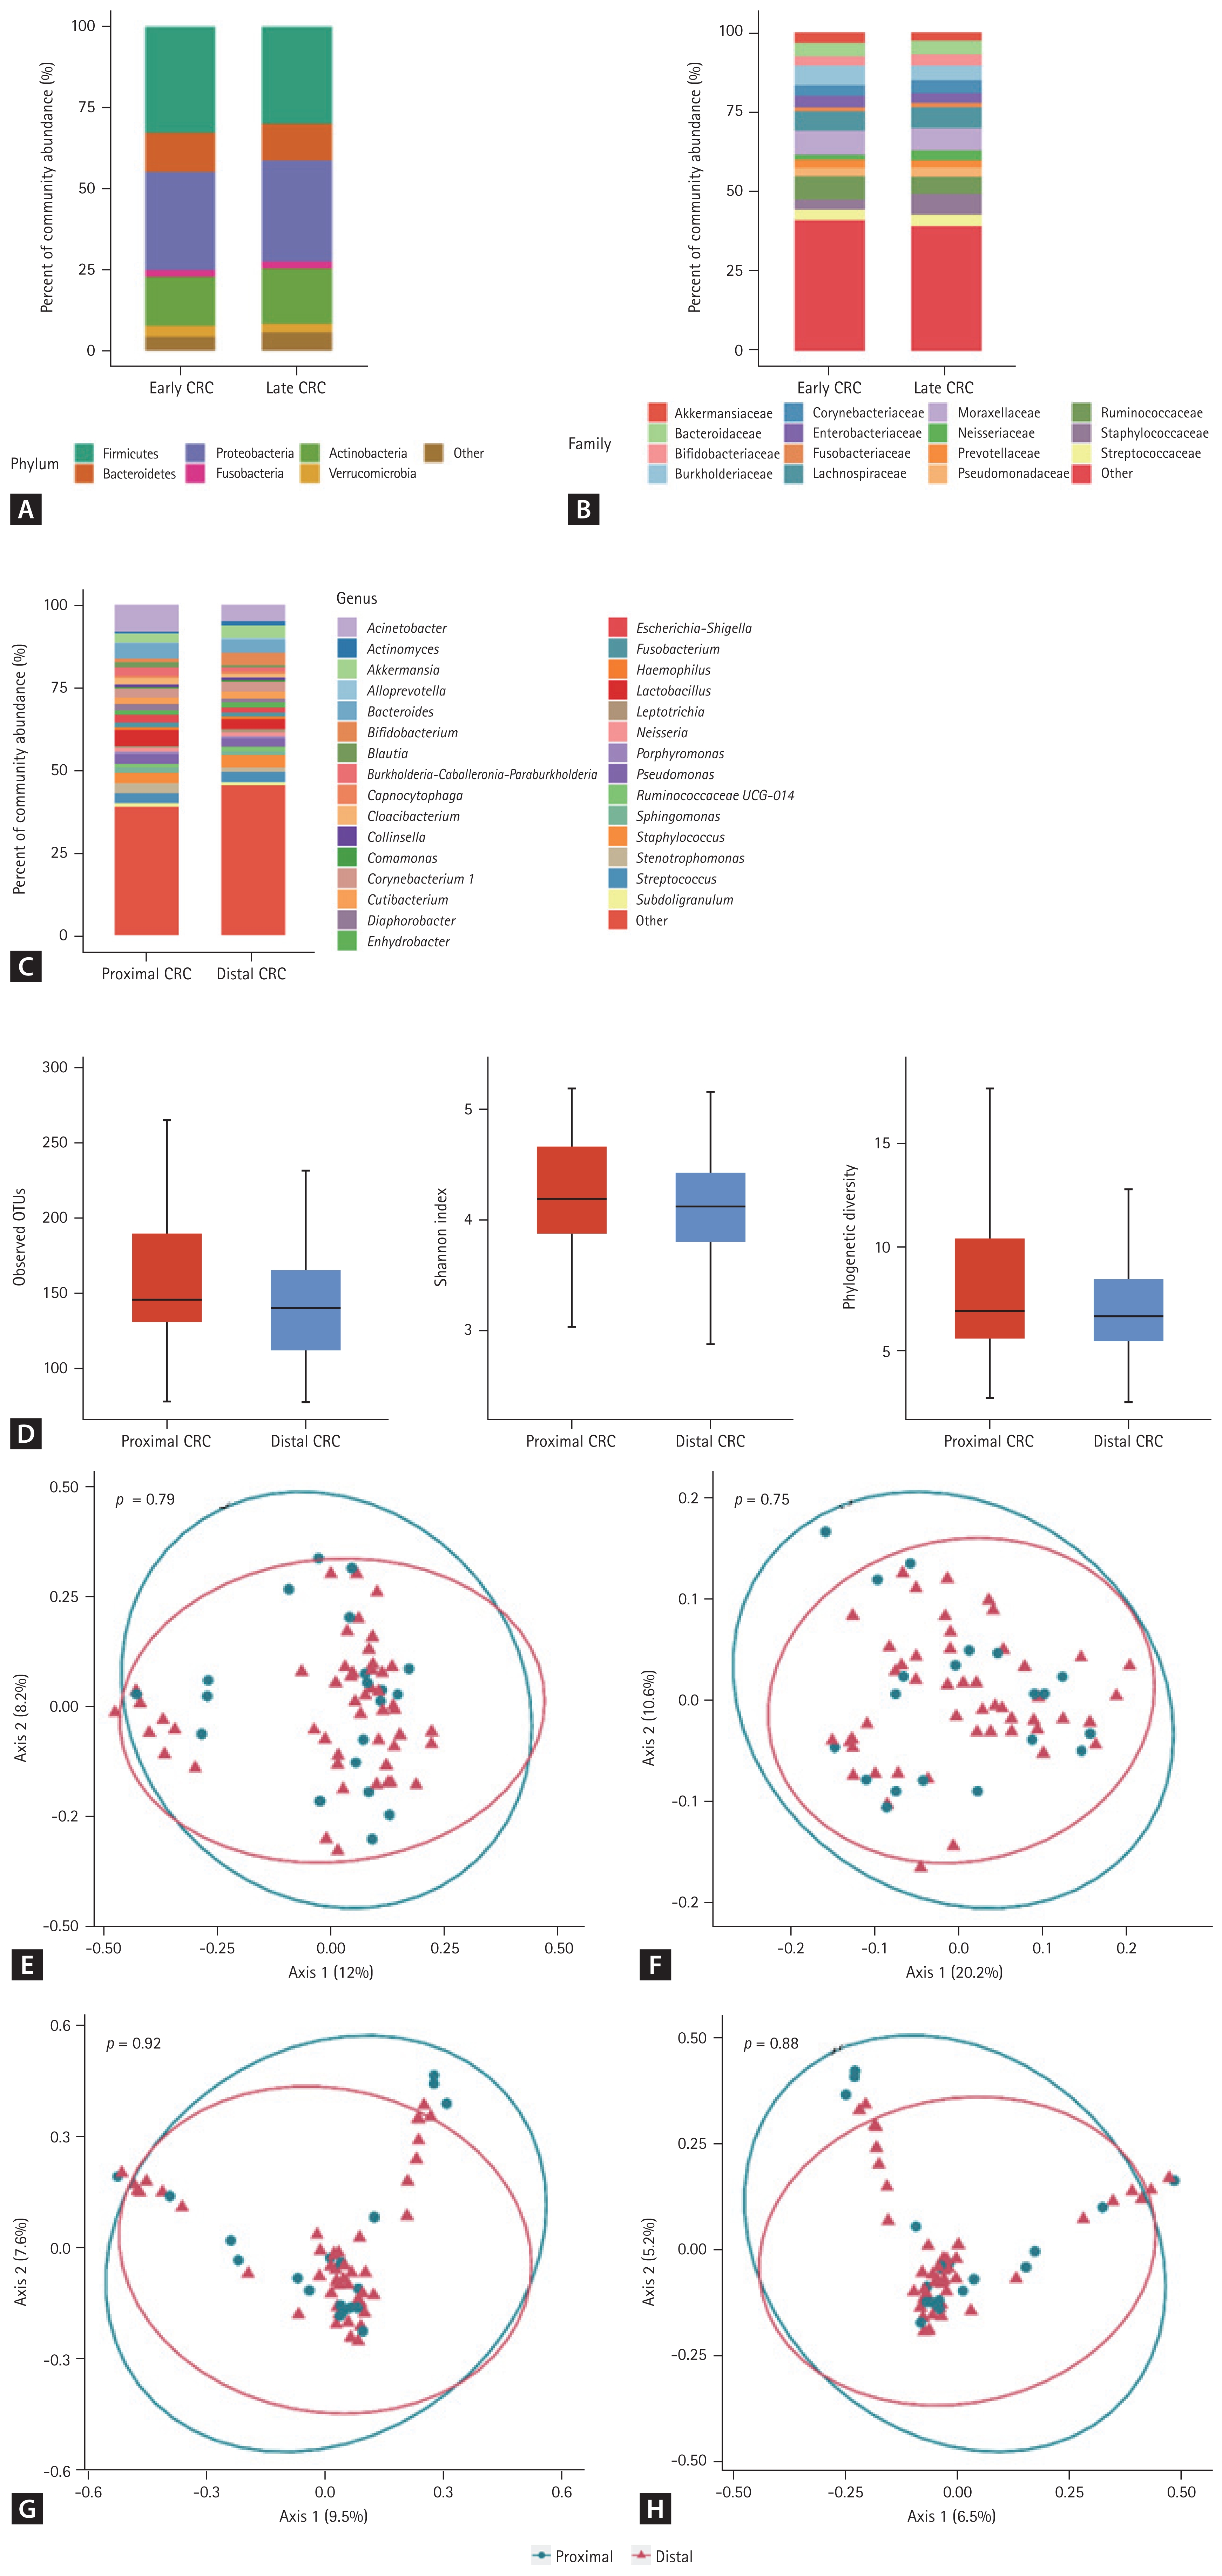
Taxonomic composition (A–D) and principal coordinate analysis (E–H) of the gut microbiome derived from the urine extracellular vesicles of patients with proximal and distal colorectal cancer. (A) Phylum level, (B) family level, (C) genus level, (D) alpha-diversity, (E) UniFrac distance, (F) weighted-UniFrac distance, (G) Bray-Curtis dissimilarity, and (H) Jacaard distance. CRC, colorectal cancer; OTU, operational taxonomic unit.
DISCUSSION
In this study, we found that the alpha-diversity of the gut microbiome in the CRC group was significantly lower than that in the control group, similar to the results of previous studies that evaluated the gut microbiome using feces [1,2]. These findings suggest that the decrease in the protective function offered by various gut microbes may be involved in the pathogenesis of CRC.
As expected, the beta-diversity between the control and CRC groups was significantly different. This finding was highly robust as it was evidenced using quantitative metrics (weighted-UniFrac metric and Bray-Curtis dissimilarity) and qualitative metrics (unweighted UniFrac metric and Jacaard distance) [14]. Specifically, at the genus level, while the abundance of Staphylococcus and Acinetobacter was higher in the CRC group, that of Bacteroides, Enhydrobacter, and Akkermansia was lower in the CRC group than in the control group. Some studies have suggested an association between certain Staphylococcus species and CRC [15,16]. In addition, it has been reported that a high-fat diet, which is associated with the development of CRC, increases Staphylococcus abundance in mice [17]. Nonetheless, Acinetobacter is one of the most predominant genera in rectal cancers [18] and is associated with the development of metachronous adenoma in patients with CRC following surgery [19]. The association between the depletion of Akkermansia in the intestine and the development of CRC is also well-known. A previous study suggested that EVs derived from Akkermansia muciniphila prevent the progression of colitis in a mouse model [20]. Moreover, previous studies have reported conflicting results regarding the association between Bacteroides and CRC. For example, Bacteroides can produce short-chain fatty acids, which play protective roles in the pathogenesis of CRC [21], whereas the risk of CRC increases in patients with bacteremia from Bacteroides fragilis [22]. However, we could not find similar studies reporting the association between Enhydrobacter and CRC; hence, further studies are needed to elucidate whether this result is meaningful.
The number of observed OTUs reported in this study was not different from that reported in studies that analyzed the gut microbiome in feces, thereby affirming that the EVs secreted by gut microbes partially enter the blood circulation and are eventually detected in the urine [5]. The phylum Firmicutes accounted for the highest proportion of microbes in both control and CRC groups. This is consistent with the results of previous microbiome research using feces [23]. Interestingly, even in the control group, Proteobacteria accounted for a higher proportion than Bacteroidetes (17.1% vs. 16.4%). Considering that the proportion of Proteobacteria in normal feces is approximately 4% [24], this is a remarkable result. Contrary to most microbes in the colon, which are obligate anaerobes, members of Proteobacteria are facultative anaerobes. As Proteobacteria members can tolerate oxidative stress from enterocytes, they are more abundant in the colon mucosa than in feces compared with other phyla. Proteobacteria members can easily invade the blood. Representative gastrointestinal pathogens can cause bloodstream infection, such as Escherichia and Klebsiella, belonging to this phylum. Among the various organs in the human body, the colon is the most significant habitat for the microbiome. Therefore, we believe that EVs in the urine excreted from blood primarily reflect the microbiome from the colon mucosa; this is the basic premise of studies similar to ours [7,25]. In addition, we suggest that this abundant Proteobacteria in the urine originated from the colon mucosa. However, in the vascular system, there may be bacterial EVs from all human body sites. Given that Proteobacteria is also common in the oral cavity and skin [26], we cannot rule out the possibility that microbes of this phylum are from other human body sites.
There was no significant difference in beta-diversity between the early and late stages of CRC; we could not identify specific taxa that were enriched or depleted according to the stage of CRC. It is not clear whether gut microbiome composition differs according to the stage of CRC. One study reported that some genera were more abundant in the feces of patients with early-stage CRC than in the feces of patients with late-stage CRC [27]. However, another study demonstrated no such microbial changes [28]. Our previous study showed that microbial composition, evenness, and diversity were significantly different between the early and late stages of CRC in feces and fecal EVs [29]. It is challenging to explain why the results of microbial analyses using different types of samples are inconsistent with each other. However, we consider this phenomenon as evidence to support that urine EVs are not a simple alternative for feces and fecal EVs to evaluate gut microbiota in patients with CRC. Further studies are needed to explore the association between gut microbiota and early- and late-stage CRC.
A conventional adenoma-carcinoma sequence is the dominant pathway for carcinogenesis of distal CRC; in contrast, microsatellite instability and CpG island methylator phenotype contribute to the carcinogenesis of proximal CRC [30]. Therefore, it has been suggested that the gut microbiome may differ between proximal and distal CRC [31,32]. However, in the present study, there was no difference in alpha- and beta-diversity of the gut microbiome according to the location of CRC. As already mentioned, the composition of the gut microbiome derived from urine-EVs can differ from that of fecal samples; hence, it is difficult to directly compare the results of our study with those of previous studies. Therefore, more studies using EVs from the bodily fluids of patients with CRC are required.
To the best of our knowledge, this study is the first to analyze the gut microbiome in patients with CRC using EVs extracted from urine. However, this study had a few limitations. First, we set up healthy individuals with abdominal symptoms as the control group instead of healthy people. This is because it was not easy to recruit completely healthy people in the outpatient clinic of a tertiary hospital. In addition, some baseline characteristics differed between the CRC and control groups. To compensate for this, we adjusted these clinical factors to analyze the gut microbiome. Second, the proportion of late-stage CRC was relatively small in the total CRC group. Therefore, it was difficult to conclusively interpret the findings in this group.
In conclusion, a distinct composition of the gut microbiome is reflected in the urine-EVs of patients with CRC compared with that in healthy controls. Microbial signatures from EVs in the urine could serve as potential biomarkers for the early detection of CRC.
KEY MESSAGE
1. Gut microbiome composition is reflected in urine extracellular vesicles of patients with colorectal cancer.
2. Microbial signatures from extracellular vesicles in urine show potential as biomarkers for colorectal cancer diagnosis.
Acknowledgments
This research was supported by the Bio & Medical Technology Development Program of the National Research Foundation (NRF) funded by the Korean Government (MSIT) under grant NRF-2017M3A9F3047495, and a grant (no. 04-2012-004) from the Seoul National University Bundang Hospital Research Fund.
Notes
Conflict of interest
No potential conflict of interest relevant to this article was reported.