Alterations in lung and gut microbiota reduce diversity in patients with nontuberculous mycobacterial pulmonary disease
Article information

Abstract
Background/Aims
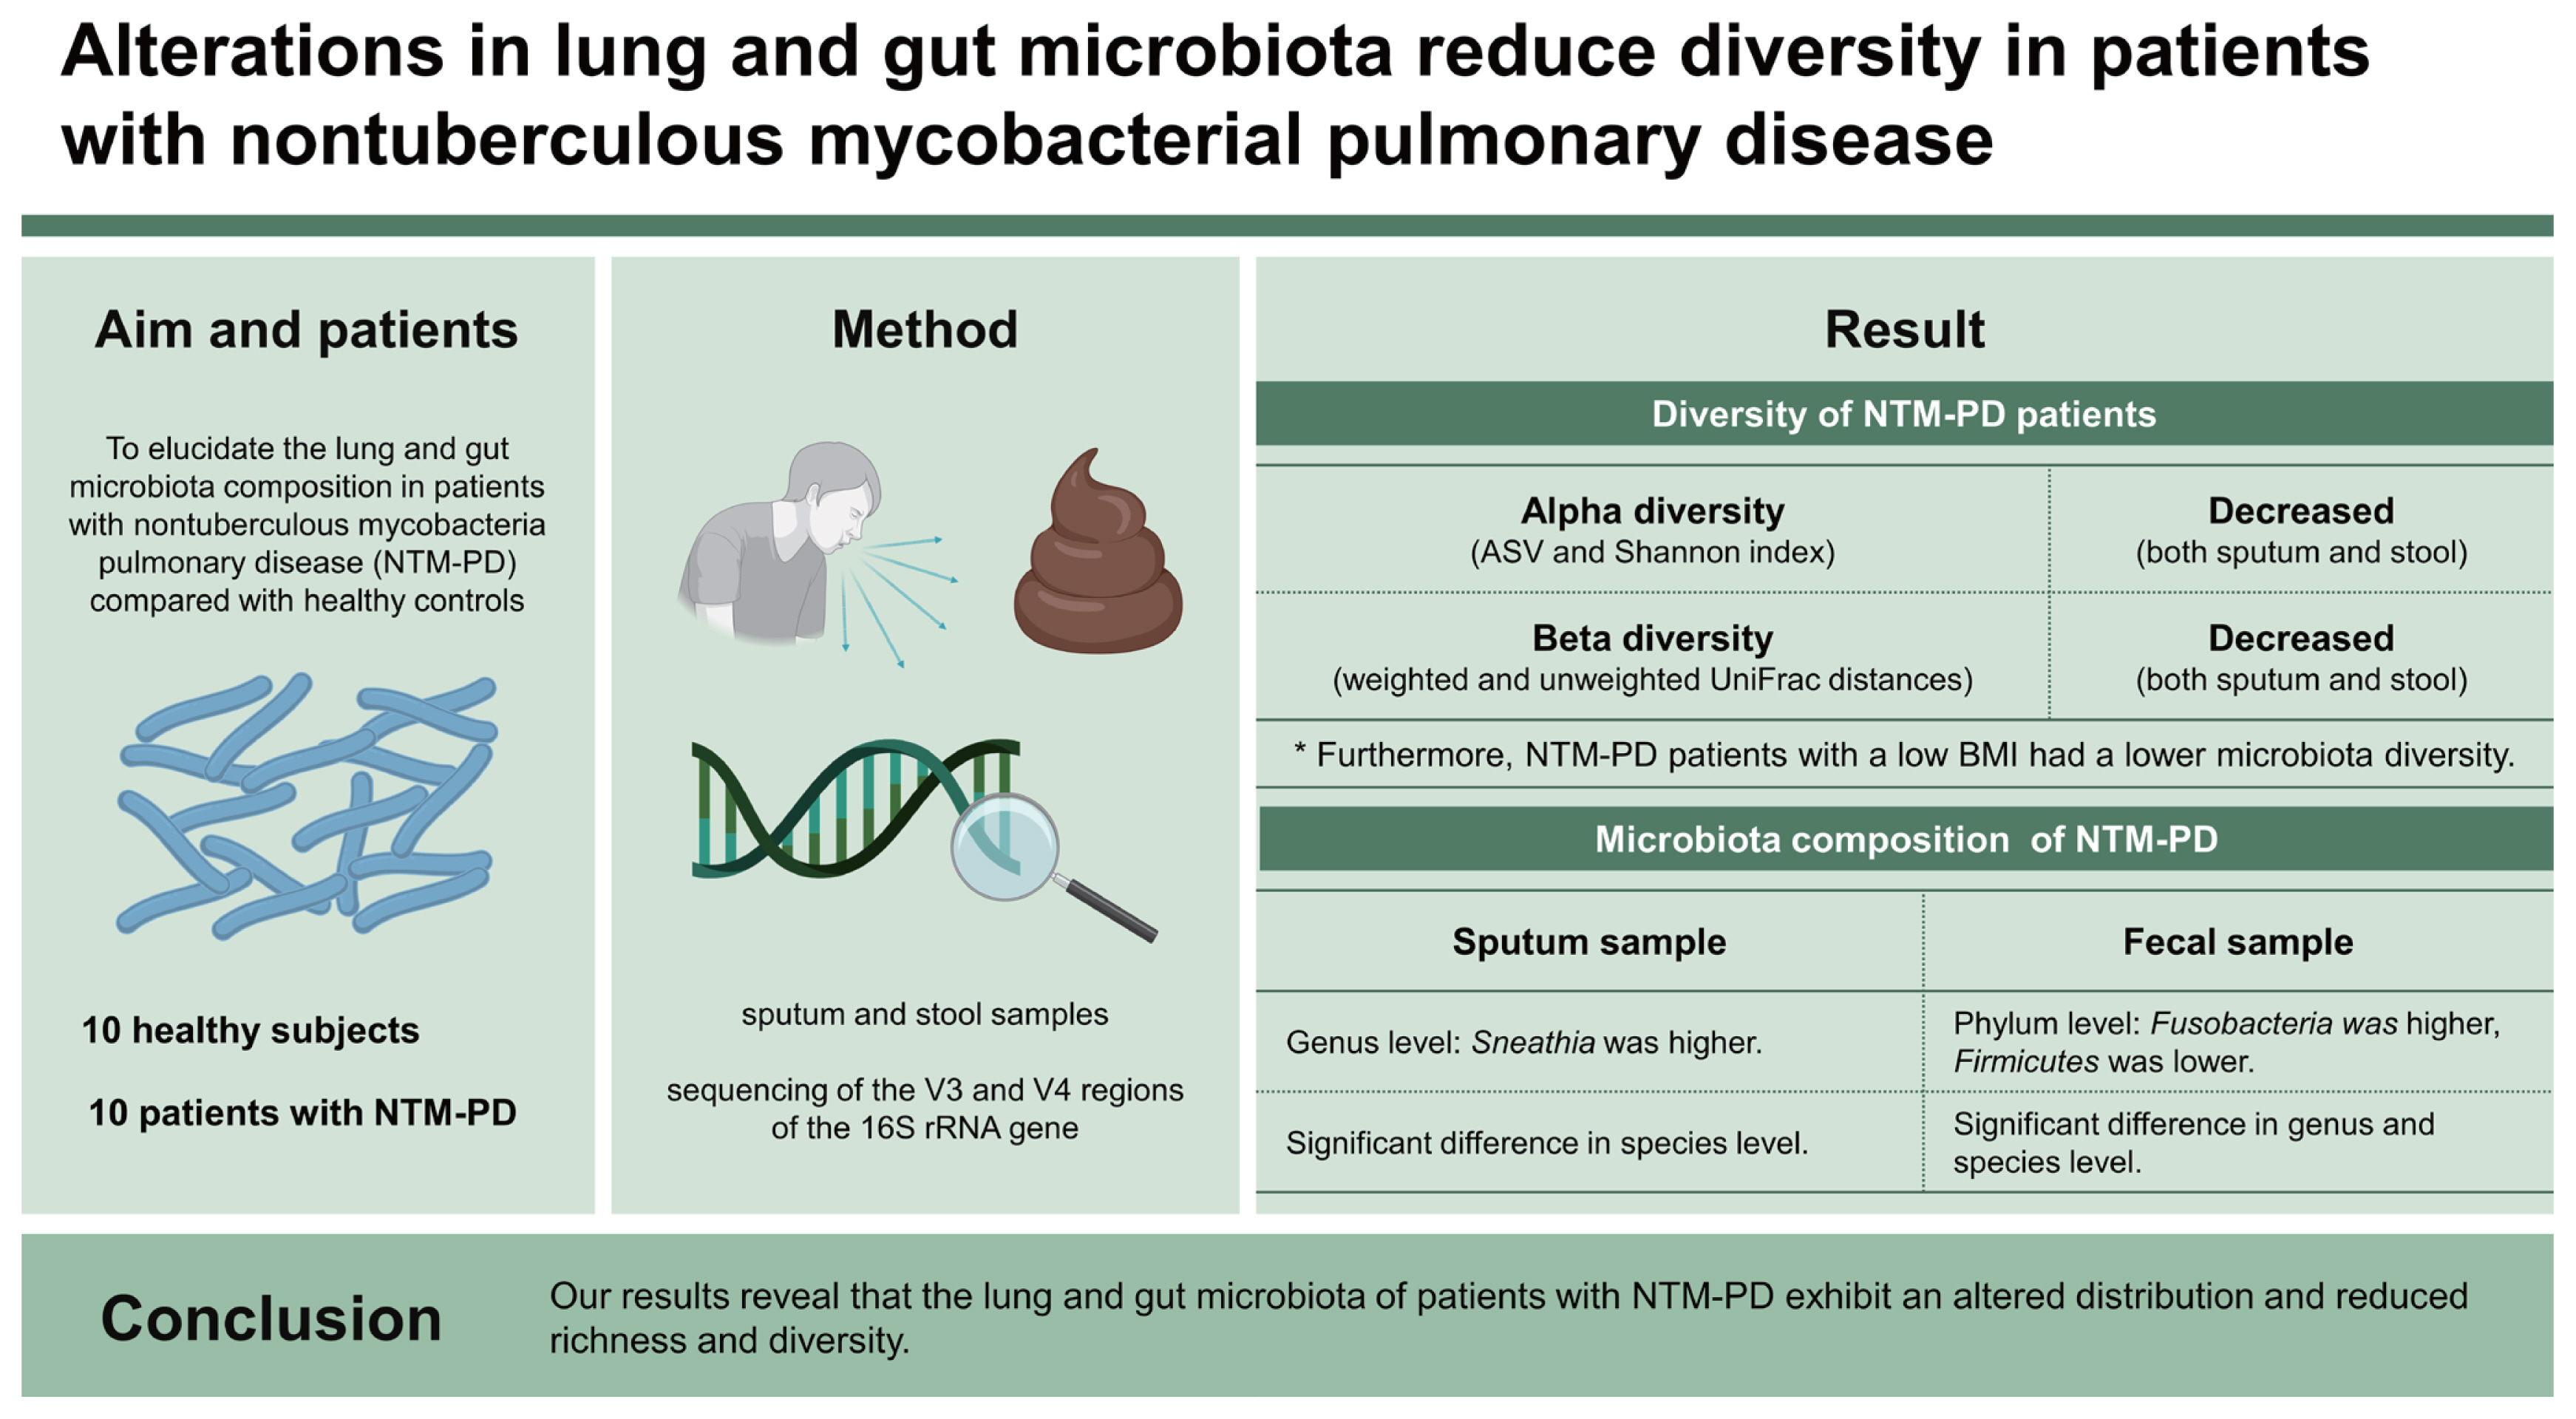
Although the incidence of nontuberculous mycobacteria pulmonary disease (NTM-PD), a chronic infectious disease, is increasing, lung and gut microbiota dysbiosis in NTM patients has rarely been studied and was therefore the focus of this study.
Methods
We analyzed the microbiota diversity in sputum and stool samples from 10 healthy subjects and 10 patients with NTM-PD through sequencing of the V3 and V4 regions of the 16S rRNA gene. In NTM-PD patients, we comparatively evaluated the microbiota diversity according to the body mass index (BMI), with BMI ≤ 18.5 kg/m2 defined as “underweight” and BMI > 18.5 kg/m2 as “others.”
Results
The sputum microbiota from NTM-PD patients tended to have lower index values of amplicon sequence variant richness, Shannon evenness, and beta diversity than those from the control group. Furthermore, NTM-PD patients with a low BMI had a lower microbiota diversity than patients with high BMI. Fecal samples from NTM-PD patients also significantly differed in alpha and beta diversity compared with the control group and exhibited a diversity pattern similar to that found in sputum samples.
Conclusions
Our results reveal that the lung and gut microbiota of patients with NTM-PD exhibit an altered distribution and reduced richness and diversity.
INTRODUCTION
Nontuberculous mycobacteria (NTM) are diverse microbial species that include commensals as well as pathogens and can cause pulmonary disease, often in the form of progressive lung disease. The incidence of NTM diseases is increasing for unknown reasons [1]. Despite the widespread exposure to environmental NTM, only a small number of exposed individuals acquire these diseases and even less require clinical treatment [2]. The development of NTM pulmonary disease (NTM-PD) is influenced by various host factors, including structural lung abnormalities, immune and genetic disorders predisposing the individual to disease, and connective tissue disease features [3,4]. However, the pathogenesis of NTM-PD is still unclear. For example, in some NTM-PD cases in postmenopausal women or women over 65 years old, no clear predisposing conditions were found.
Since the late 2000s, studies have compared the human microbiota in disease and health conditions to understand the underlying interactions and reveal potential clinical consequences. The human microbiota is an ecologically complex microbial community comprising bacteria, viruses, and fungi [5]. Recently, microbiota studies have been extended to multiple human organs, i.e., to investigate the role of the lung microbiota in respiratory diseases. Several studies focusing on the lung microbiota of patients with NTM-PD have suggested that a unique lung microbiota community exists in these patients [6–8]. Sulaiman et al. [6] suggested that certain components of the lower airway microbiota, including taxa commonly identified as oral commensals, may be associated with NTM-PD. Yamasaki et al. [8] suggested that anaerobic NTM may play an essential role in NTM-PD pathogenesis.
The concept of the “gut–lung axis” was introduced based on gut microbiota being associated with lung disorders and respiratory infections or vice versa [9–11]. For example, asthma, cystic fibrosis, and chronic obstructive pulmonary disease (COPD) are chronic lung diseases associated with alterations in the gut microbiota [12–14]. However, there are few published studies on the gut microbiota of patients with NTM-PD.
Studies have shown that interactions between estrogens and the gut microbiota may regulate weight gain and lipid deposition [15,16]. The body mass index (BMI) has been inversely related to the development of NTM-PD, and weight loss increases the risk of NTM-PD, suggesting that the association between the gut microbiota and BMI may be associated with the pathogenesis of NTM-PD [17]. Based on these previous findings, in this study, we aimed to elucidate the lung and gut microbiota composition in patients with NTM-PD compared with healthy controls, focusing on the relation of the gut microbiota composition with the BMI.
METHODS
Study population and sample collection
All participants were recruited at the Pulmonary Outpatient Department of Severance Hospital, Seoul, Republic of Korea between August 2020 and March 2021 after providing written informed consent. This study was approved by the Institutional Review Board of Severance Hospital, Seoul, Republic of Korea (Institutional Review Board No. 4-2020-0644) and conducted in accordance with the approved guidelines and regulations as well as the Declaration of Helsinki.
We collected sputum and fecal samples from 10 patients with NTM-PD and 10 healthy volunteers. Samples of the patients with NTM-PD were collected either before antibiotic therapy or at least one year after completion of the treatment, whereas samples of the healthy volunteers were collected at enrollment. Health-related quality of life (HRQoL) was evaluated using the COPD assessment test (CAT), which has been demonstrated to be a suitable indicator of HRQoL [18]. All patients with NTM-PD were diagnosed according to the 2007 American Thoracic Society/Infectious Diseases Society of America guidelines. Acid-fast bacilli smears were examined by fluorochrome staining using auramine–rhodamine, and acid-fast bacilli were cultured in 3% Ogawa medium and mycobacteria growth indicator tube medium (Becton Dickson, Franklin Lakes, NJ, USA). A reverse hybridization line probe assay based on the rpoB gene, conducted at Seoul Clinical Laboratories (Yongin, Korea), was used for NTM species identification.
DNA extraction and quantification
DNA was extracted from the sputum and stool samples using the DNeasy PowerSoil Kit (Qiagen, Hilden, Germany) according to the manufacturer’s instructions. The extracted DNA was quantified using Quant-iT PicoGreen (Invitrogen, Carlsbad, CA, USA).
Library construction and sequencing
Sequencing libraries were prepared according to the Illumina 16S Metagenomic Sequencing Library Preparation protocols (Illumina, San Diego, CA, USA) for amplifying the V3 and V4 regions of the 16S rRNA gene. The input genomic DNA (2 ng) was PCR-amplified using 5 × reaction buffer, 1 mM dNTP mix, 500 nM each universal forward and reverse primers, and Herculase II Fusion DNA polymerase (Agilent Technologies, Santa Clara, CA, USA). The cycling conditions for the first polymerase chain reaction (PCR) were as follows: 3 minutes at 95°C for polymerase activation, 25 cycles of 30 seconds at 95°C, 30 seconds at 55°C, and 30 seconds at 72°C, and a 5-minute final extension at 72°C. The following universal primers with Illumina adapter overhang sequences were used for the first amplification: V3-F: 5′-TCGTCGGCAGCGTCAGATGTGTATAAGAGACAGCCTACGGGNGGCWGCAG-3′, V4-R: 5′-GTCTCGTGGGCTCGGAGATGTGTATAAGAGACAGGACTACHVGGGTATCTAATCC-3′. The first PCR product was purified using AMPure magnetic beads (Agen-court Bioscience, Beverly, MA, USA), and 2 μL of the purified PCR product was index PCR-amplified for final library construction using Nextera XT Index Primers (Illumina). The cycling conditions for the second PCR were the same as those used for the first PCR, except that only 10 cycles were employed. The second PCR product was purified using AMPure magnetic beads, quantified using qPCR according to the qPCR quantification protocol guide (KAPA Library Quantification Kits for Illumina sequencing platforms), and qualified using TapeStation D1000 ScreenTape System (Agilent Technologies, Waldbronn, Germany). Paired-end (2 × 300 bp) sequencing was performed at Macrogen, using the MiSeq platform (Illumina).
Microbial diversity analysis
The MiSeq (Illumina) raw data were assigned to the samples based on the index sequences, and paired-end FASTQ files were created for each sample. Adapter and primer sequences were removed using Cutadapt v.3.2 [19]. The DADA2 package (v.1.18.0) in R (v.4.0.3; R Foundation for Statistical Computing, Vienna, Austria) was used to correct errors in the amplicon sequencing process [20]. For paired-end reads, the forward sequence (Read1) and reverse sequence (Read2) were cut to 250 bp and 200 bp, respectively, and sequences with an expected error of 2 or more were excluded. Then, an error model for each batch was established to remove noise for each sample. After assembling the paired-end sequences with corrected sequencing error(s) into a single sequence, using the Consensus method of DADA2, chimera sequences were removed and amplicon sequence variants (ASVs) were inferred. In addition, the data were normalized by subsampling based on the number of reads of a sample and the minimum number of reads among all samples using QIIME (v.1.9) for comparative analysis of the microbial community [21]. Each ASV sequence was searched against a reference database (NCBI 16S Microbial DB) using BLAST+ (v.2.9.0), and taxonomic information was assigned based on the highest similarity [22]. If the query coverage of the best hit that matched the DB was less than 85% or the identity of the matched area was less than 85%, taxonomy information was not assigned. MAFFT (v.7.475) was used for multiple alignments of the ASV sequences, and a phylogenetic tree was created using FastTreeMP (v.2.1.10) [23,24].
A comparative analysis of the various microbial communities was performed using QIIME with the above ASV abundance and taxonomic information. The Shannon index and inverse Simpson index were calculated to evaluate microbiota species diversity and uniformity in the samples, and alpha diversity information was confirmed based on rarefaction curves and Chao1 values. Beta diversity among sample groups was investigated based on weighted and unweighted UniFrac distances, and the relationships among study groups were visualized based on principal coordinate analysis (PCoA) and unweighted pair group method with arithmetic mean trees.
Linear discriminant analysis (LDA) effect size (LEfSe) analysis was performed to compare the microbial community composition (relative abundances) among groups, and microorganisms showing a significant difference are reported [25]. The degree of difference was expressed as an LDA score. For significant species with LDA ≥ 2, diversity information among samples in the comparison group was obtained based on unweighted UniFrac/Bray–Curtis distances. The relationships among samples were visualized through PCoA. Additionally, significant differences among groups were analyzed through analysis of similarities (ANOSIM). A heatmap was generated to visualize the hierarchical clustering of the samples.
Statistical analysis
Statistical analysis was performed to determine significant differences in the alpha diversity among groups. Wilcoxon rank sum test was used to compare two groups, whereas the Kruskal–Wallis test was used to compare three groups. Relative abundance values for each taxonomic rank (phylum, genus, species) were analyzed using analysis of covariance (ANCOVA) with post hoc tests to correct for clinical information (age, BMI, and so on). R (v.3.5.2; R Foundation for Statistical Computing) was used for statistical analysis. In each statistical analysis, the false discovery rate method was used in each to correct p values for multiple testing; p < 0.05 was considered significant.
RESULTS
Baseline characteristics
In total, 10 patients with NTM-PD and 10 healthy controls were enrolled in this study. The baseline characteristics are summarized in Table 1. All participants were female, and there was no difference in smoking status between the groups. Patients with NTM-PD were older and exhibited, lower BMI, higher symptom score (CAT score), and higher prevalence of bronchiectasis than the healthy controls. Four patients with NTM-PD (40.0%) had Mycobacterium avium infection, two (20.0%) had Mycobacterium abscessus infection, two (20.0%) had Mycobacterium intracellulare infection, one (10.0%) had Mycobacterium massiliense infection, and one (10.0%) had a mixed infection. Nine patients were naïve for NTM treatment at enrollment and one had a history of treatment at least one year before the enrollment. We classified the NTM-PD group into patients with a low BMI (PL group, n = 4, BMI ≤ 18.5 kg/m2) and those with a normal or high BMI (PO group, n = 6, BMI > 18.5 kg/m2) groups.
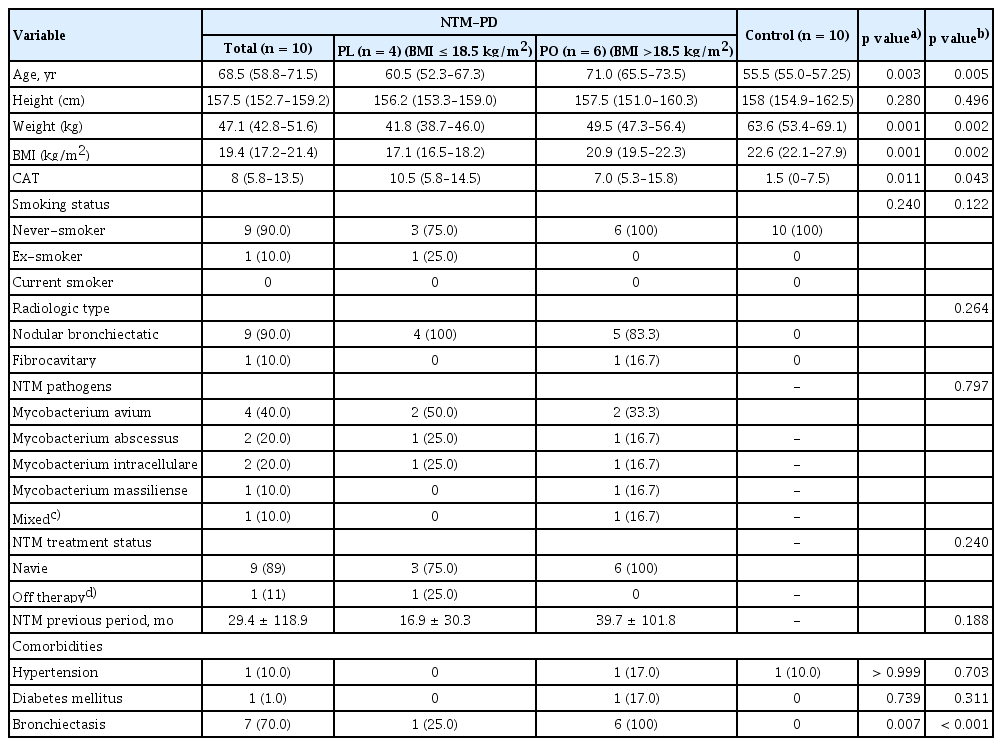
Demographic data and clinical characteristics of the study population
Microbial diversity of the NTM-PD microbiota
Both alpha and beta diversity were analyzed to determine the microbiota distribution pattern and richness in each group. We analyzed nine sputum samples and ten fecal samples from the patients with NTM-PD due to low RNA quality in one sputum sample. Figures 1 and 2 show the alpha and beta diversity in the sputum and fecal samples, respectively. Alpha diversity of each sample was analyzed based on the ASV and Shannon index. Species richness and evenness were lower, albeit not significantly, in sputum samples of the NTM-PD groups than in those of healthy controls (Fig. 1A). Similarly, we observed a considerable, albeit not significant, difference in alpha diversity in sputum samples among the three groups (PL, PO, healthy controls) (Fig. 1B). Beta diversity in the sputum samples differed significantly between the NTM-PD and healthy groups (Fig. 1C). The distribution of taxa in the sputum samples differed significantly among the healthy, PL, and PO groups (Fig. 1D).
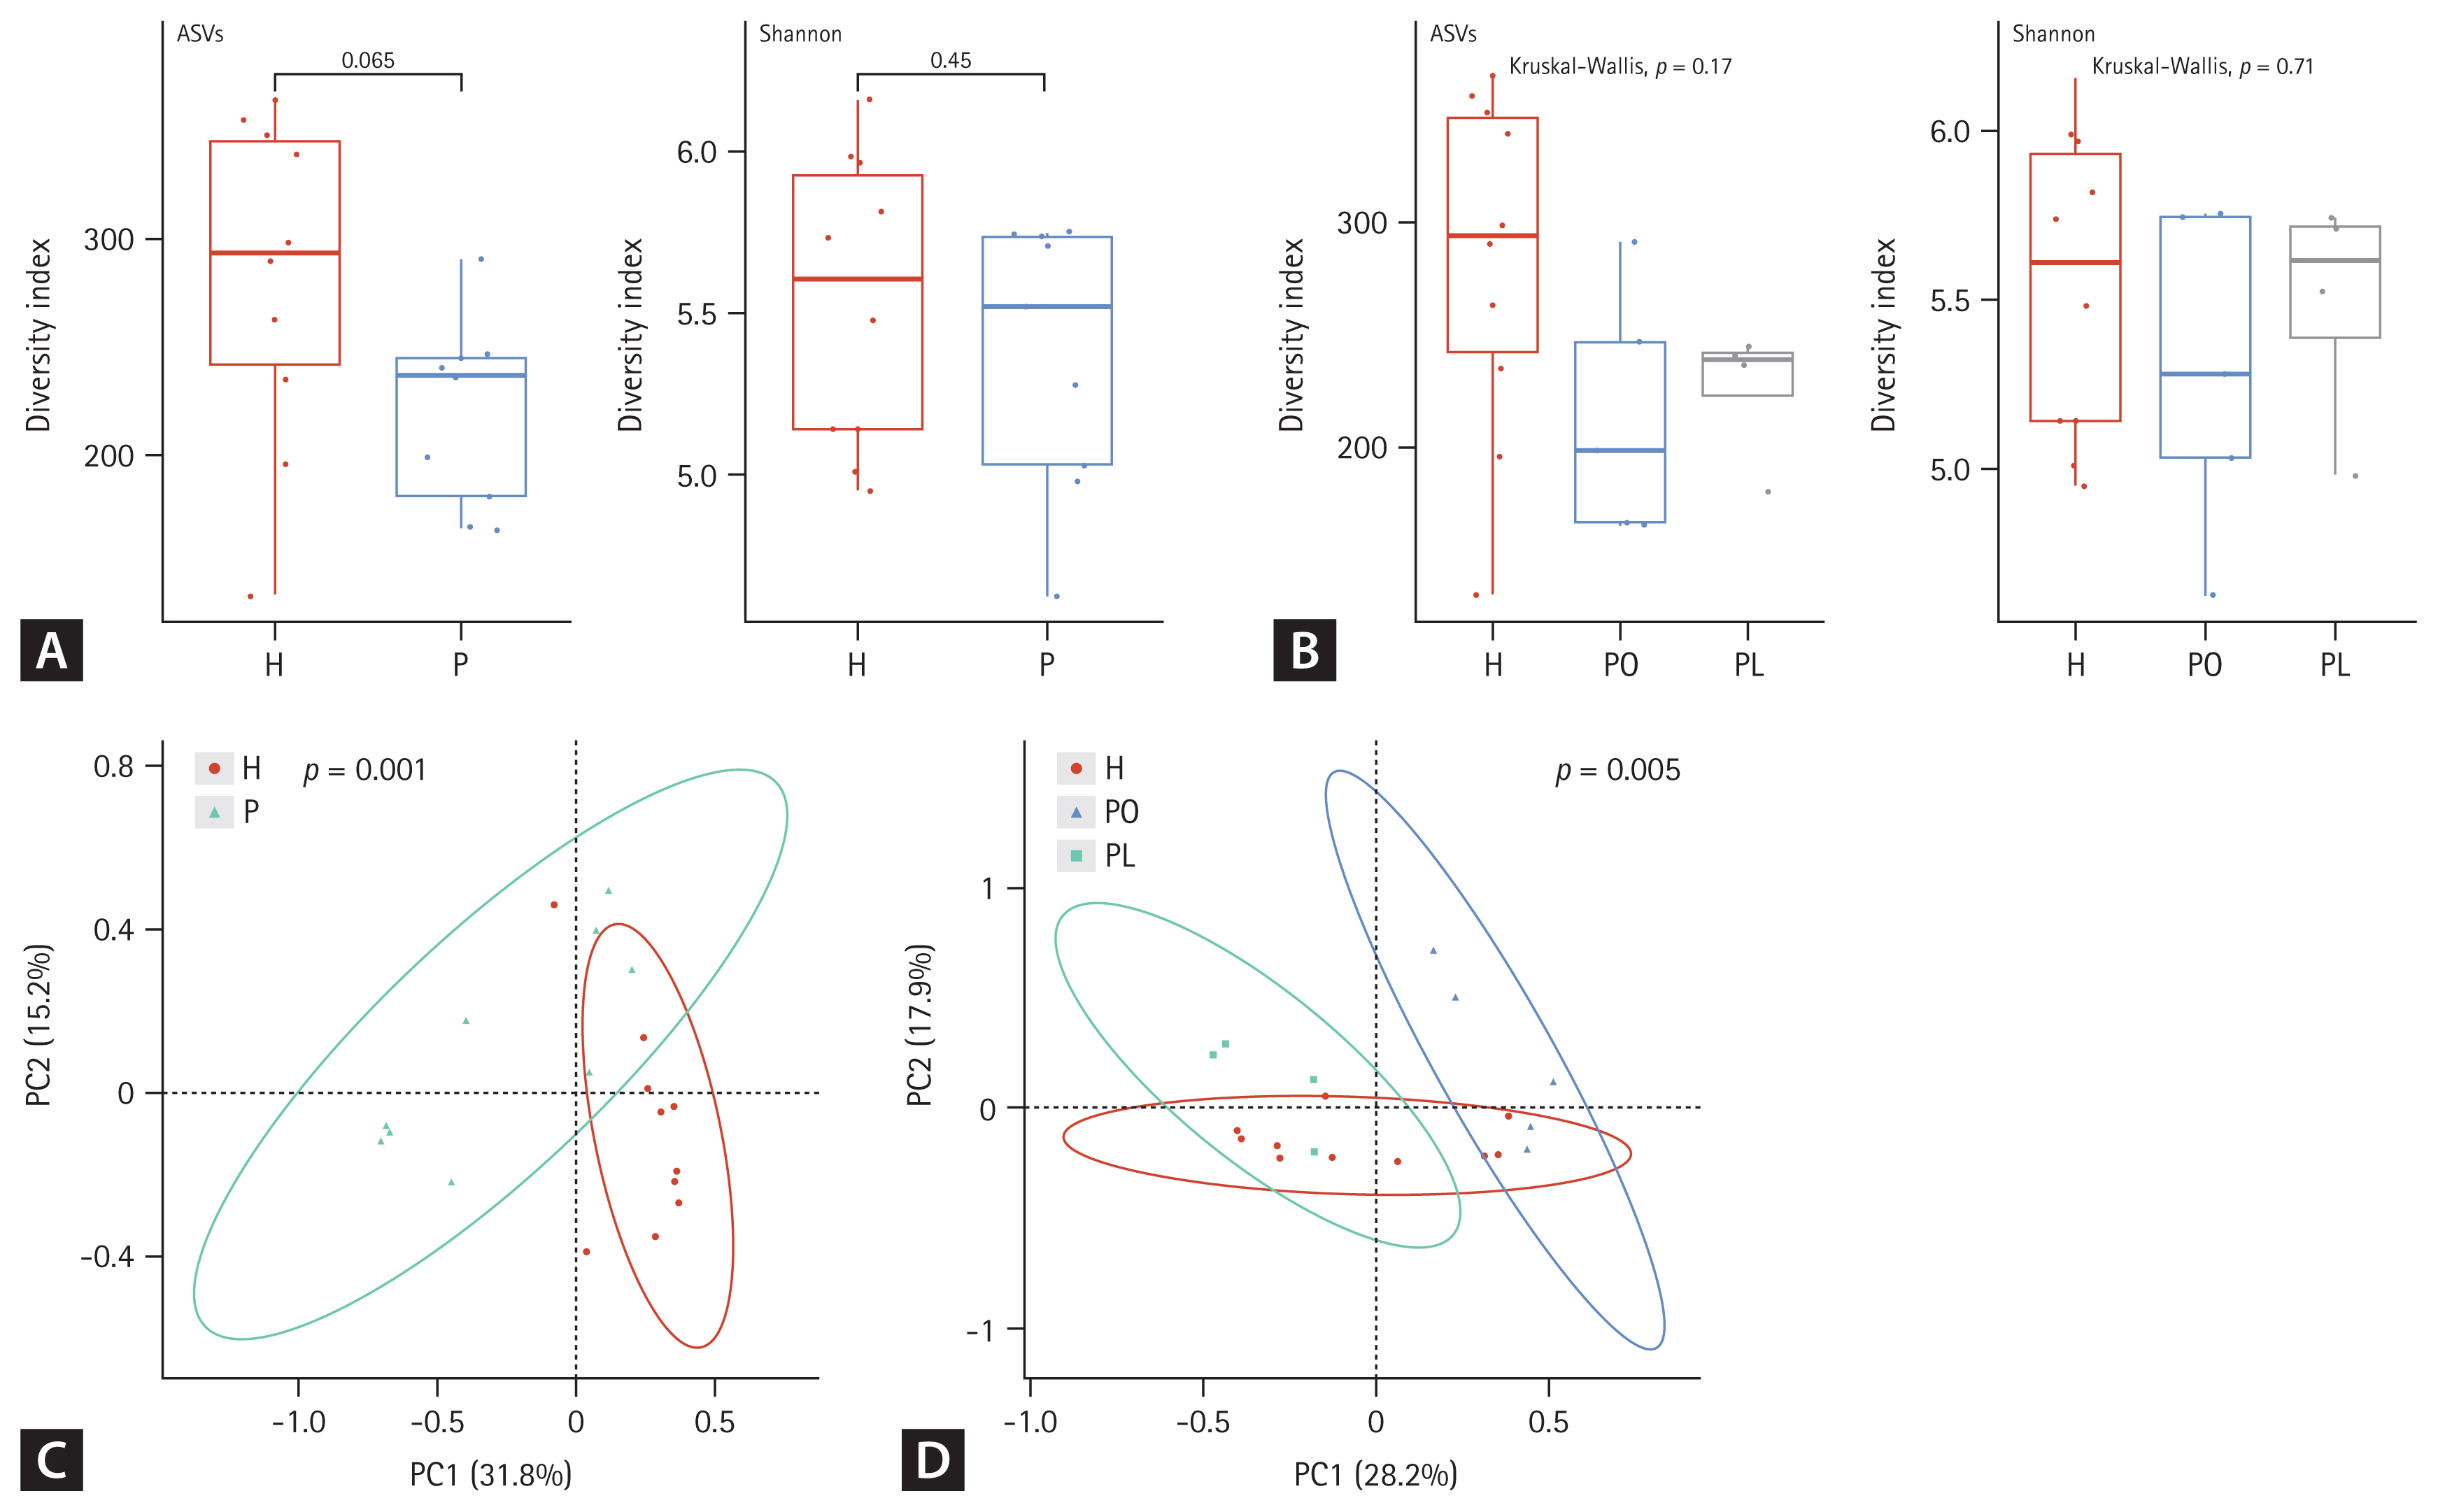
Alpha and beta diversity differences in the sputum microbiota among nontuberculous mycobacteria pulmonary disease (NTM-PD) patients and healthy controls. (A, B) The alpha diversity metrics used were amplicon sequence variant (ASV) richness and ASV distribution (evenness, Shannon index) within a sample. (C, D) The beta diversity of the three groups was analyzed using unweighted and weighted UniFrac (phylogenetic) distance matrixes. Each colored circle represents a sample from a group, as indicated. Differences were assessed using analysis of similarities (ANOSIM), and the results are shown in a principal coordinate analysis (PCoA) plot. H, healthy control group; P, NTM-PD patient group; PL, patients with NTM-PD with a low body mass index; PO, patients with NTM-PD with a normal or high body mass index.
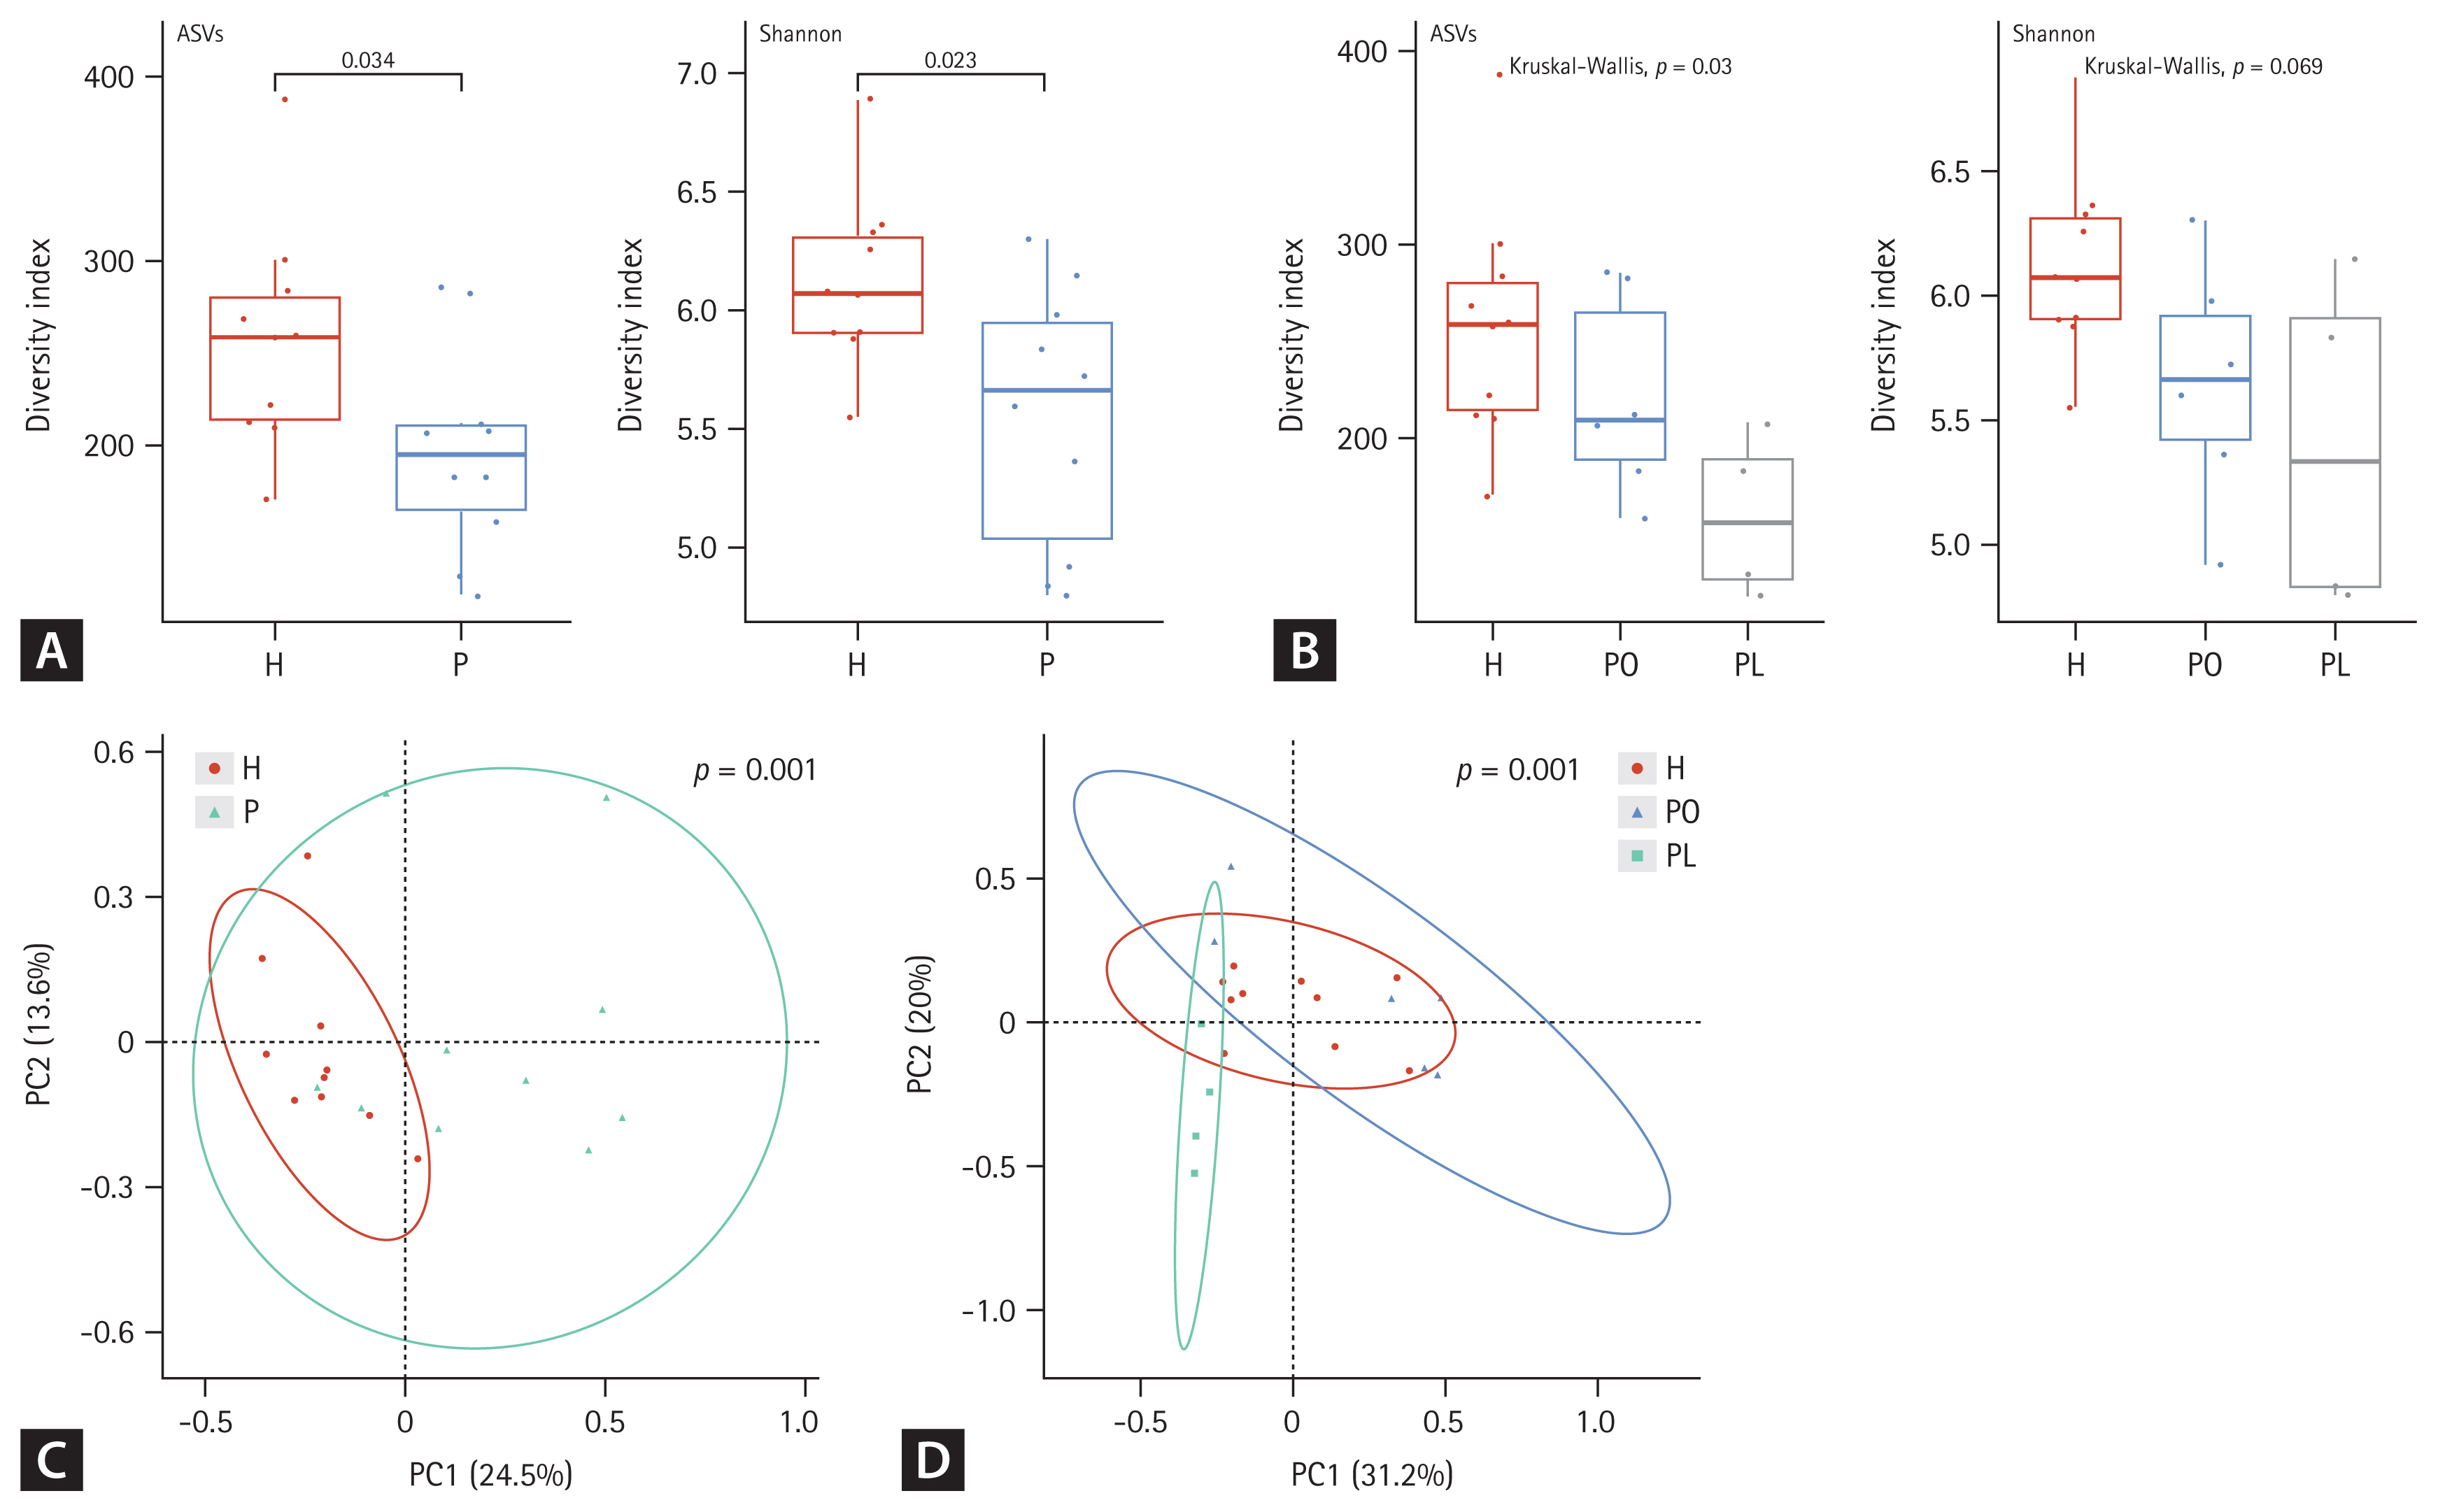
Alpha and beta diversity differences in fecal microbiota between patients with nontuberculous mycobacteria pulmonary disease (NTM-PD) and healthy controls. (A, B) The alpha diversity metrics used were amplicon sequence variant (ASV) richness and distribution (evenness, Shannon index) within a sample. (C, D) The beta diversity of the three groups was analyzed using both unweighted and weighted UniFrac (phylogenetic) distance matrixes. Each colored circle represents a sample from a group, as indicated. Differences were assessed using analysis of similarities (ANOSIM), and the results are shown in a principal coordinate analysis (PCoA) plot. H, healthy control group; P, NTM-PD patient group; PL, patients with NTM-PD with a low body mass index; PO, patients with NTM-PD with a normal or high body mass index.
In fecal samples, the alpha diversity was significantly lower in the NTM-PD groups than that in healthy controls (Fig. 2A). Species richness and evenness were considerably different among the healthy, PL, and PO groups (Fig. 2B). Beta diversity in fecal samples differed significantly between the NTM-PD and healthy groups (Fig. 2C). In addition, the distribution of taxa differed significantly among the healthy, PL, and PO groups in fecal samples (Fig. 2D). The richness of various bacterial species in the different groups is illustrated using LDA plots and heatmaps, as shown in Figures 3 and 4.

Linear discriminant analysis (LDA) effect size (LEfSe) analysis of microbial abundances in sputum (A, B) and fecal (C, D) samples. Taxa showing significant differences in a group were detected by LEfSe analysis based on an LDA score 3 2.0 and a < 0.05. The cladogram displays differentially abundant taxonomic clades with an LDA score ≥ 2.0 in each sample community. H, healthy control group; NTM-PD, nontuberculous mycobacteria pulmonary disease; P, NTM-PD patient group; PL, patients with NTM-PD with a low body mass index; PO, patients with NTM-PD with a normal or high body mass index.

Heatmaps and clustering of individual sputum (A, B) and fecal (C, D) microbiota at the species level. The heatmaps were generated based on species identified by linear discriminant analysis (LDA) effect size (LEfSe; LDA ≥ 2.0) using the Z-score for relative abundance. H, healthy control group; NTM-PD, nontuberculous mycobacteria pulmonary disease; P, NTM-PD patient group; PL, patients with NTM-PD with a low body mass index; PO, patients with NTM-PD with a normal or high body mass index.
Microbiota composition in sputum samples from the healthy, PL, and PO groups
At the genus level, the proportion of Sneathia was higher in patients with NTM-PD than that in healthy controls, regardless of adjustment for age and BMI (Supplementary Fig. 1A). At the species level, Prevotella fusca, Prevotella marshii, Prevotella nanceiensis, Capnocytophaga ochracea, Gemella morbillorum, Streptococcus constellatus, Sneathia sanguinegens, and Treponema bryantii were dominant in the NTM-PD groups compared with the healthy group (Supplementary Fig. 1B). In the PL group, the proportions of Actinotalea, Muribaculum, Flintibacter, Acetivibrio, Noviherbaspirillum, and Sulfurimonas were higher, whereas those of Acinetobacter were lower than those in the PO group (Supplementary Fig. 1C). When comparing the species distribution according to BMI in the NTM-PD group, there was a significantly higher proportion of Corynebacterium doosanense, Actinotalea ferrariae, Phocaeicola sartorii, Muribaculum intestinale, Granulicatella elegans, Flintibacter butyricus, Enterocloster aldenensis, Acetivibrio thermocellus, Lautropia dentalis, Noviherbaspirillum canariense, Neisseria mucosa, and Sulfurimonas autotrophica but a significant lower proportion of Rothia dentocariosa, Gemella morbillorum, Fusobacterium equinum, and Acinetobacter seifertii in the PL group than that in the PO group (Supplementary Fig. 1D).
LEfSe was performed to identify the specific taxa with significantly higher abundance in each group. As shown in Figure 3A, 45 taxa were screened based on an LDA threshold score of 2.0. Taxa with significantly higher abundance in the NTM-PD group mainly belonged to Veillonella rodentium and Hallella seregens. When comparing the healthy groups with the PL and PO groups, 18 taxa were screened, and the proportions of N. mucosa, family Burkholderiales, Haemophilus haemolyticus, L. dentalis, and V. rodentium were higher in the PL group than those in the PO group (Fig. 3B).
Microbiota composition in fecal samples from the healthy, PL, and PO groups
The composition of the fecal microbiota differed significantly among the healthy and NTM-PD groups at the phylum and genus levels. The relative abundance of the phylum Fusobacteria was higher, whereas that of Firmicutes was lower in patients with NTM-PD than in healthy controls, even after adjusting for age and BMI (Supplementary Fig. 2A).
The genera Slackia, Bacteroides, Barnesiella, Parabacteroides, Weissella, Lactonifactor, Lutispora, Anaerosporobacter, Sellimonas, Anaerotignum, Lachnoclostridium, Acutalibacter, Monoglobus, Amedibacillus, Longicatena, Propionispira, Selenomonas, Finegoldia, Fusobacterium, and Pseudescherichia were enriched, whereas Neglecta and Haemophilus were significantly decreased in the NTM-PD group regardless of adjustment for age and BMI (Supplementary Fig. 2B).
At the species level, the proportions of Bifidobacterium bifidum, Slackia isoflavoniconvertens, Bacteroides koreensis, B. thetaiotaomicron, Barnesiella intestinihominis, Prevotella bivia, Weissella confusa, Parabacteroides merdae, Hungatella hathewayi, Lactonifactor longoviformis, Anaerosporobacter mobilis, Lutispora thermophila, Anaerotignum faecicola, Anaerotignum lactatifermentans, Blautia argi, Clostridium hylemonae, Blautia schinkii, Clostridium symbiosum, Lacrimispora sphenoides, Clostridium scindens, Tyzzerella nexilis, Acutalibacter muris, Sellimonas intestinalis, Monoglobus pectinilyticus, Amedibacillus dolichus, Anaerotruncus colihominis, Clostridium cocleatum, Longicatena caecimuris, Propionispira paucivorans, Finegoldia magna, Fusobacterium varium, Selenomonas lacticifex, Pseudescherichia vulneris, and Haemophilus parainfluenzae were dominant, whereas Prevotella stercorea, Neglecta timonensis, Eubacterium coprostanoligenes, and Dorea formicigenerans were significantly lower in the NTM-PD groups than those in the healthy group (Supplementary Fig. 2C). The dominant genera in the PL group included Faecalimonas, Lachnoclostridium, and Streptobacillus, but after adjustment for age and BMI, only the proportions of Lachnoclostridium and Streptobacillus were higher and remained significant (Supplementary Fig. 2D).
The microbial composition in the stool samples among the healthy and NTM-PD groups was further analyzed using LEfSe (Fig. 3C, D). The phylum Bacteroidetes, class Bacteroidia, order Bacteroidales, Blautia caecimuris, C. symbiosum, Tyzzerella nexilis, Mediterraneibacter glycyrrhizinilyticus, Eisenbergiella, Erysipelatoclostridium ramosum, Enterocloster clostridioformis, and Clostridium innocuum were dominant in the NTM-PD groups compared with the healthy group. When comparing the species distribution according to BMI in the NTM-PD group, the proportion of Blautia wexlerae, Erysipelatoclostridium ramosum, Lachnoclostridium pacaense, Veillonella atypica, Bacteroides thetaiotaomicron, Enterocloster clostridioformis, Tyzzerella nexilis, and Blautia glucerasea in the PL group was higher than that in the PO group. Taken together, the results indicate that BMI affects the lung and gut microbiota composition.
DISCUSSION
The microbiota of patients with NTM-PD differs from those of healthy individuals and other disease states [6–8]. In the present study, sputum and fecal samples were collected to evaluate the lung and gut microbiota diversity between healthy controls and patients with NTM-PD and between patients with NTM-PD classified according to low versus normal or high BMI. The lower diversity observed in both sputum and fecal samples from the NTM-PD group indicates a homogenous microbial community composition in this group compared with the healthy group. Furthermore, our results revealed that microbial communities differ according to the BMI in NTM-PD patients.
In previous studies, the microbiota diversity in respiratory samples from patients with NTM-PD was significantly lower than that in samples from healthy subjects, which is consistent with our findings [6,7,26]. In addition, our study showed that the lung microbiota composition differs between patients with NTM-PD classified according to BMI. Anaerobes (e.g., Prevotella, Veillonella) were more abundant in the NTM-PD group than in the healthy group. In a previous study of respiratory microbiota in NTM-PD without a history of antimicrobial treatment, anaerobic species, primarily Prevotella, Fusobacterium, Propionibacterium, and Veillonella, were found in higher abundance. In another study of sputum microbiota in NTM-PD, Prevotella, Veillonella, and Corynebacterium were the most abundant microbes [6–8]. The higher prevalence of anaerobes may be attributed to mycobacteria inducing local tissue hypoxia, which aids further mycobacterial growth [8]. However, studies on lower airway microbiota in NTM-PD frequently identified Pseudomonas, Rhadococcus, and Actinomycetales. These bacteria are known to co-infect with NTM-PD [26,27]. Strikingly, the abundance of Haemophilus, Neisseria, and Burkholderiales was higher in patients with NTM-PD with a low BMI than that in patients with NTM-PD with a standard or high BMI, indicating that the BMI can be considered a factor influencing the microbial communities associated with and pathogenesis of NTM infection.
There are few published studies on the NTM-PD gut microbiota. Our study showed that fecal samples from patients with NTM-PD have lower diversity than those from healthy controls, with increased abundance of Bacteroides, Blautia, Clostridium spp., and Tyzzerella nexilis. More importantly, we found a difference in the gut microbiota composition in patients with NTM-PD classified according to BMI, with increased levels of Lachnoclostridium and Streptobacillus in the low BMI group, suggesting that being underweight may be a clinical factor contributing to gut microbiota dysbiosis.
According to previous studies, a change in BMI leads to profound gut microbiota variations. In patients with COPD, BMI is a clinical factor that contributes to gut microbiota dysbiosis and obesity and results in an increased Firmicutes/Bacteroidetes ratio in the gut [28–30]. Furthermore, several studies have shown a correlation between the increased abundance of Bacteroidetes in stools and weight loss [31,32]. In contrast, others have shown a relationship between Firmicutes abundance and the development of obesity [32]. Consistent with the previous findings, in our study, the proportion of Bacteroidetes was higher in the low BMI group than that in healthy controls. Being underweight is a well-known risk factor for patients with NTM-PD and has been suggested to be associated with the refractory disease through malnutrition and compromised immunity [33]. Further, our study supports the possibility of virulence mechanisms of NTM involving communication among various microbes in patients with NTM-PD.
Gut microbiota variations are correlated with increased or depleted production of short-chain fatty acids, which may increase the expression of tight junction proteins in the colonic epithelia to heighten intestinal barrier resistance, reduce mucosal permeability, and inhibit inflammatory cytokines [34]. Wang et al. [35] suggested that the dietary intake of fermentable fibers can positively impact individuals with chronic diseases owing to their capacity to promote the growth of healthy gut microbiota and increase short-chain fatty-acid production by commensal bacteria. Based on these previous findings, it is plausible that gut-based interventions that repair microbiota dysbiosis—as can be evaluated by monitoring the BMI—positively impact the management of NTM-PD.
Most patients with NTM-PD are postmenopausal and elderly women, which may imply that sex hormones are implicated in developing NTM-PD. In a cross-sectional study, Uwamino et al. [36] reported that low serum estradiol levels are related to M. avium complex lung disease in postmenopausal women and suggested that controlling systemic hormones could be an approach to preventing and treating M. avium complex infection. Philley et al. [7] suggested a functional link between estrogen and microbiota alterations, where estrogen-like compounds can be metabolized to their active form by specific microbiota to promote the growth and proliferation of certain microbes. In addition, estrogen can regulate adipocyte-derived hormones or adipokines. Furthermore, estrogen reportedly reduces lipopolysaccharide-induced inflammation by modulating inflammatory pathways and decreasing the abundance of pathogenic bacteria [37]. A group of related microbes, including Bacteroides, Faecalibacterium, Alistipes, Fusobacterium, Prevotella, Staphylococcus, and Streptococcus, can increase the intestinal reabsorption of estrogen [37]. Flores et al. [38] suggested that the gut microbial community likely affects the risk for estrogen-related conditions in the elderly and that intestinal microbial richness and functions influence systemic estrogen levels via enterohepatic circulation and are associated with fecal Clostridia taxa. All of the above and our findings suggest that the BMI of patients with NTM-PD may be correlated with microbiota dysbiosis within the lungs and gut, and estradiol levels are likely related to proinflammatory mediators that contribute to mycobacterial infection [6,36]. However, many studies are being conducted to determine whether probiotics have beneficial roles in patients with respiratory disorders, such as asthma, COPD, cystic fibrosis, and lung cancer [12–14]. Recently, the administration of L-arginine in mice with NTM infection led to the activation of the protective immune response by increasing B. pseudolongum in the intestinal microbiota [39].
Thus, these findings based on the interactions among host genetics and microbiota can be used to design personalized precision approaches for the prevention and treatment of NTM-PD. This study had a few limitations. First, patients in the PL group had different underlying diseases, such as bronchiectasis, from those in the other groups, which may have influenced the lung microbiota community; however, this was not considered in the current study. Second, we did not consider the effects of diet and other lifestyle factors, which may have influenced the gut microbiota composition. Third, this study involved patients recruited at a single center, and the sample size was small. To confirm the validity of the present finding, multi-center studies with larger numbers of patients should be performed.
In conclusion, this study mainly focused on differential microorganisms in the lung and gut microbiota communities in patients with NTM-PD and their potential correlation with NTM-PD pathogenesis. Our study provided evidence that NTM infection and BMI, as a clinical factor, are associated with lung microbiota diversity and gut dysbiosis may contribute to the pathogenesis of NTM infection.
KEY MESSAGE
1. The lung and gut microbiota in patients with NTM-PD has an altered species distribution and has low richness and diversity.
2. BMI is associated with lung microbiota diversity and gut dysbiosis in patients with NTM-PD.
Acknowledgments
We thank Microgen Co. for providing the technology necessary for metagenomic sequencing.
Notes
CRedit authorship contributions
Ji Yeon Choi: conceptualization, data curation, visualization, writing - original draft; Bora Shim: conceptualization, data curation, methodology, project administration; Youngmok Park: conceptualization, data curation, methodology, writing - review & editing; Young Ae Kang: conceptualization, data curation, formal analysis, funding acquisition, methodology, project administration, visualization, writing - original draft, writing - review & editing
Conflicts of interest
The authors disclose no conflicts.
Funding
This research was supported by a grant of the Korea Health Technology R&D Project through the Korea Health Industry Development Institue (KHIDI), funded by the Ministry of Health & Welfare, Republic of Korea (grant number HC21C0015).
Availability of data and materials
Sequencing data for sputum and stool samples have been deposited in NCBI under SRA accession number PRJNA816207 [https://www.ncbi.nlm.nih.gov/sra/PRJNA816207].
All datasets analyzed during this study are available from the corresponding author upon request.