Hepatic hemangioma: proportion and predictor of surgical treatment with emphasis on its growth rate
Article information

Abstract
Background/Aims
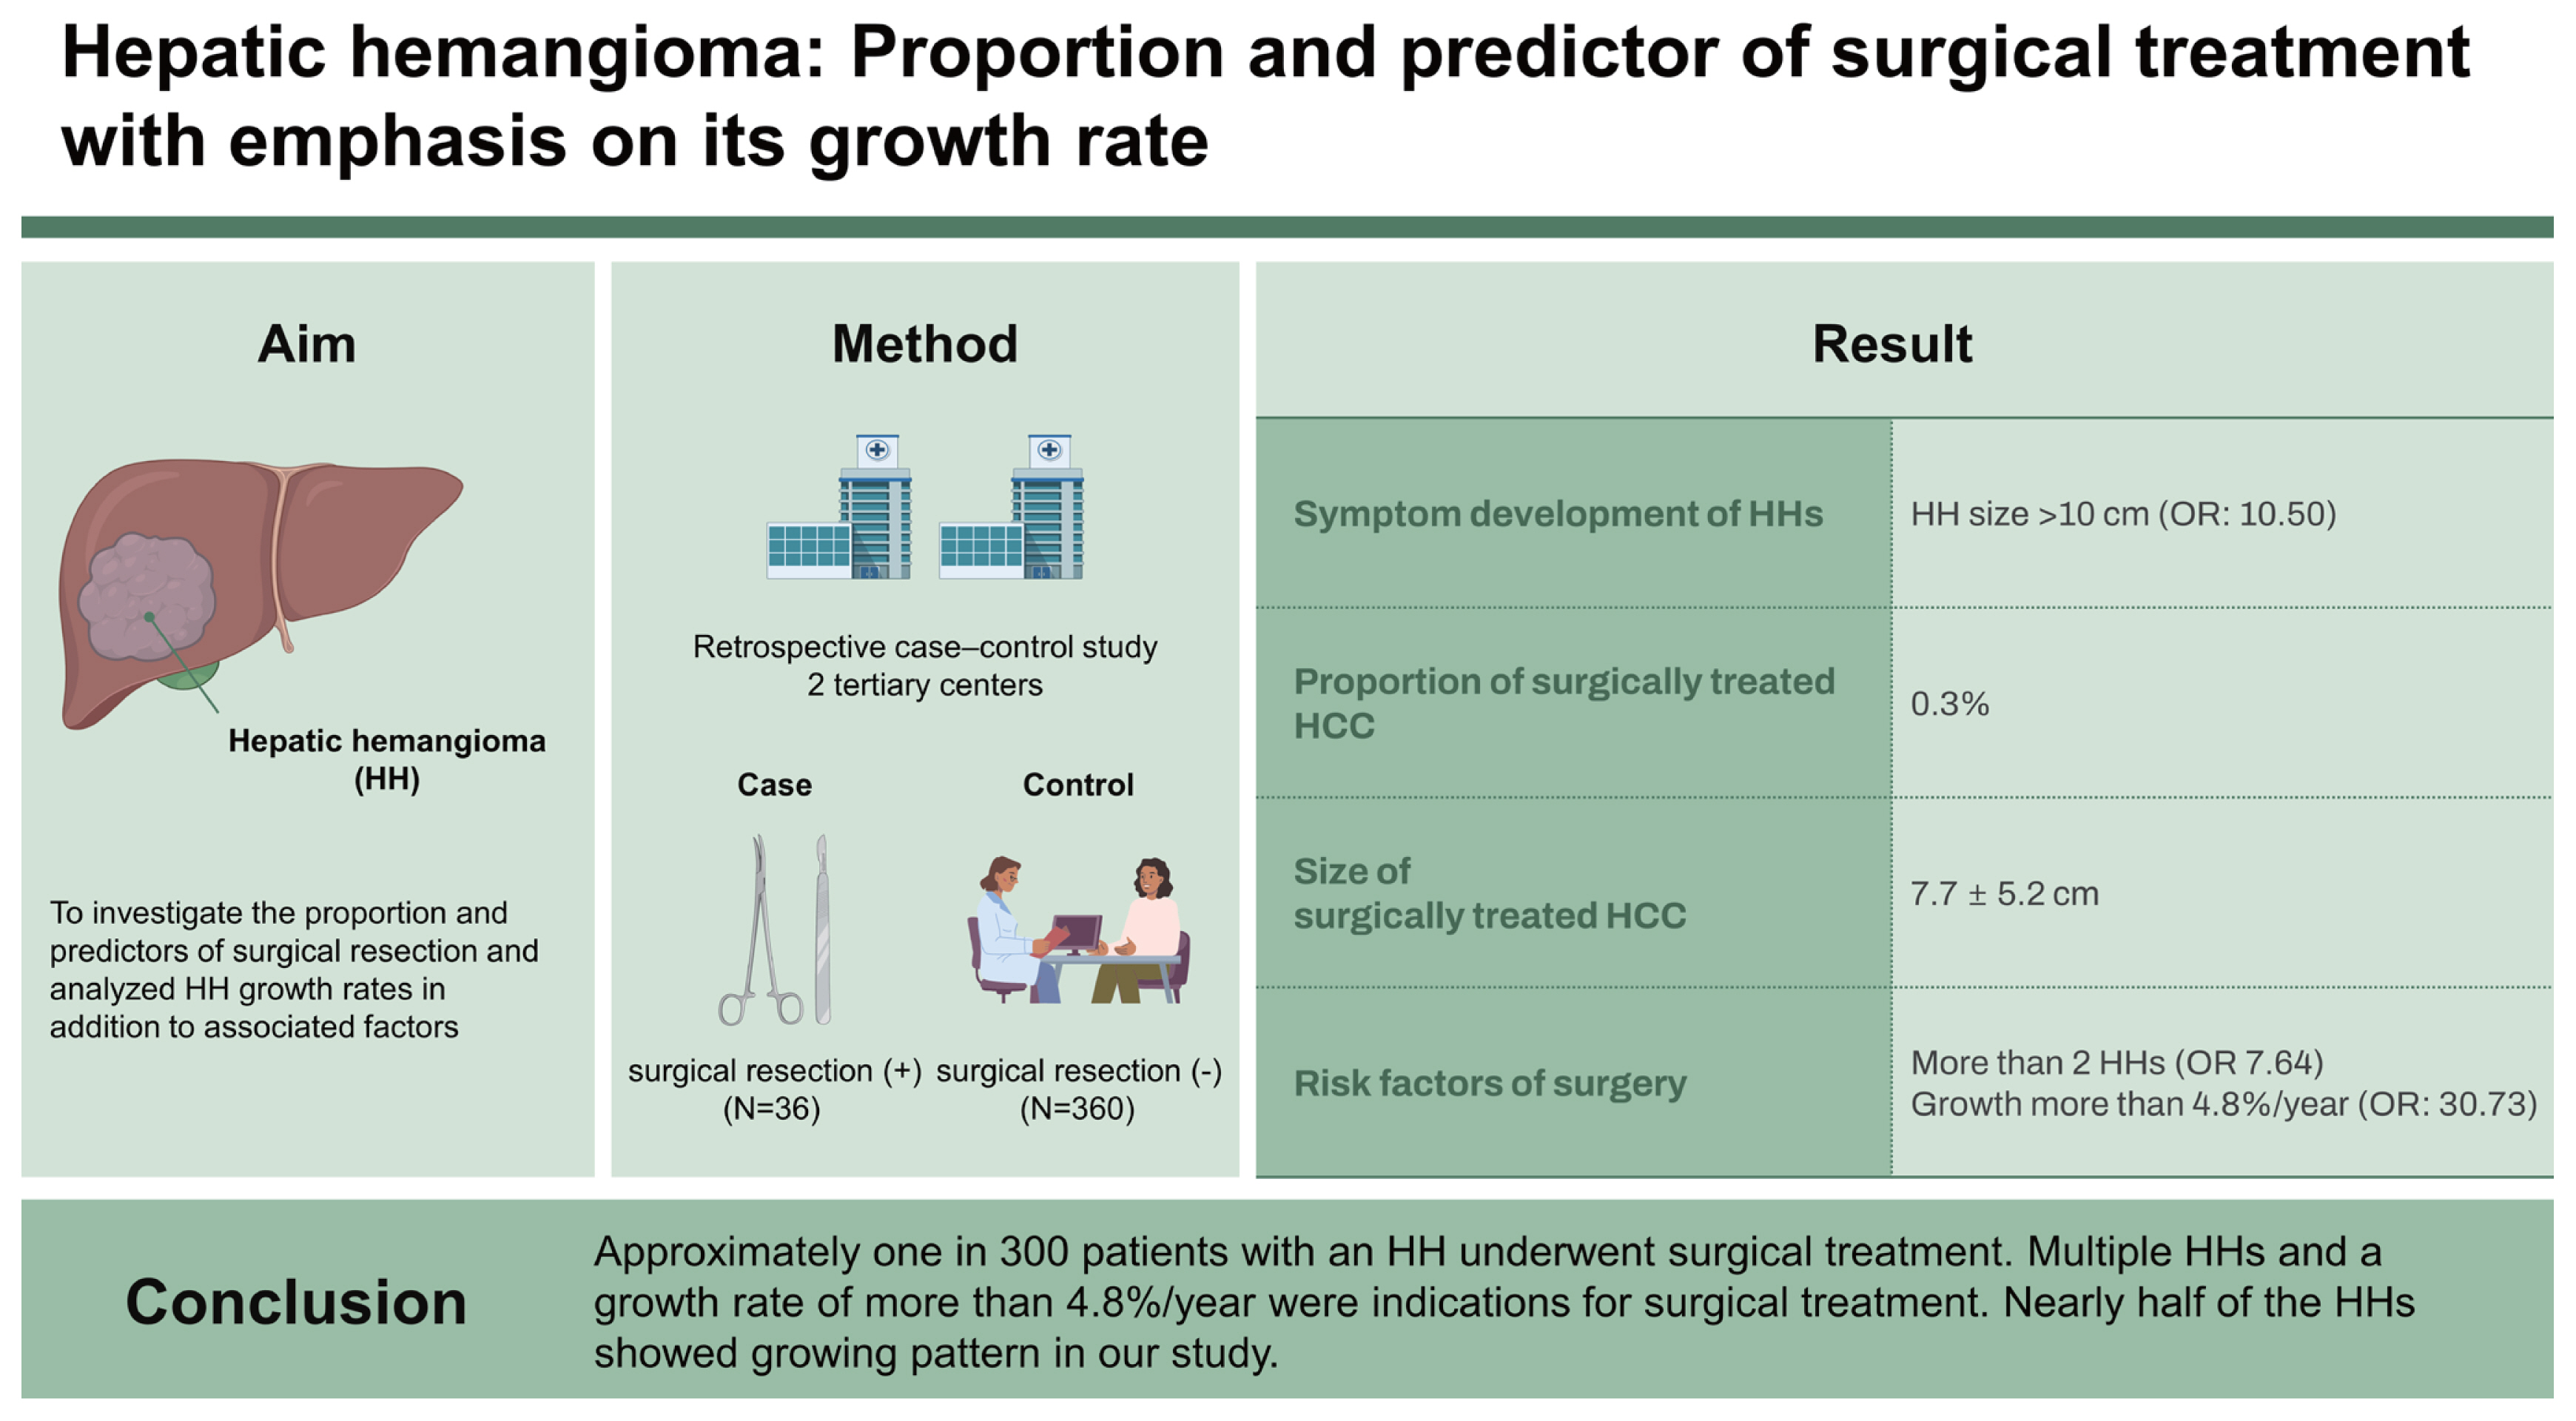
There are limited studies on the management of hepatic hemangiomas (HHs). We investigated the proportion and predictors of surgical resection and analyzed HH growth rates in addition to associated factors.
Methods
A retrospective case-control study of patients treated in 2 centers was conducted. Thirty-six patients who underwent surgical resection were assigned to the case group. Patients who did not undergo surgical treatment were randomly selected at a 1:10 ratio and assigned to the control group (n = 360). Baseline characteristics, clinical course and surgical outcomes were analyzed.
Results
The proportion of surgically treated HH patients was 0.3% (36 per 11,049). The longest diameter at diagnosis (mean ± standard deviation) was 7.7 ± 5.2 cm in the case group and 2.4 ± 1.8 cm in the control group (p < 0.001). In the multivariate analysis, the presence of more than 2 HHs (odds ratio [OR] 7.64, 95% confidence interval [CI] 1.40–41.72) and a growth rate of more than 4.8%/year (OR 30.73, 95% CI 4.86–194.51) were independently associated with surgical treatment. Symptom development during follow-up was related to HH size > 10 cm (OR 10.50, 95% CI 1.06–103.77, p = 0.04). The subgroup analysis showed substantial growth in 41.3% with an overall mean annual growth rate of 0.14 cm.
Conclusions
Approximately one in 300 patients with an HH underwent surgical treatment. Multiple HHs and a growth rate of more than 4.8%/year were indications for surgical treatment. Nearly half of the HHs showed growing pattern in our study.
INTRODUCTION
The widespread use of abdominal ultrasonography (USG), computed tomography (CT) and magnetic resonance imaging (MRI) in clinical practice has led to the detection of many focal hepatic lesions. Among them, hepatic hemangioma (HH) is the most common hepatic lesion, with a prevalence of 0.4–20% [1]. HH is usually discovered incidentally on USG during health check-ups, leading to further imaging studies, such as CT or MRI, to confirm the diagnosis and exclude the possibility of malignant tumors [2].
After diagnosis, many physicians recommend follow-up imaging after 6–12 months because they are concerned about unexpected growth or the low possibility of hemangioendothelioma or hemangiosarcoma, which cannot be completely excluded by CT or MRI. However, it has been stated in international guidelines that imaging follow-up is not required for typical hemangiomas [3]. Currently, the management of HH remains controversial. The possibility of malignancy causes anxiety in patients, and the medical costs and time required for studies are major burdens associated with this incidentaloma [4].
Although almost all cases of HH follow an indolent clinical course without symptoms [5–7], there are a few cases of HH that present with acute symptoms or rapid growth, in which surgical or nonsurgical intervention is needed. However, there are few data on the proportion of patients needing surgical treatment and the surgical indications. In addition, the pathogenesis and biomarkers for growing or aggressive HH are unknown. Although some studies have shown that as many as 17–40% of HHs grow over time [8–11], studies on HHs that require surgical treatment or their growth pattern are limited. Such studies may provide important evidence for the management of HHs, such as follow-up indications or schedules.
We aimed to analyze the proportion of patients for whom surgical treatment is required and to investigate the growth rate of HH and its related factors using a case-control design in two tertiary hospitals.
METHODS
Patient selection
Using a clinical database warehouse, data on patients diagnosed with HH (International Classification of Diseases, 10th revision [ICD-10] code D18.03) from January 2006 to May 2022 were retrieved from two tertiary hospitals. Among them, patients with pathologically confirmed HH after resection were defined as the case group. Patients incidentally diagnosed with HH during hepatectomy for other malignancies, such as hepatocellular carcinoma, cholangiocarcinoma, or metastatic liver cancer, were excluded. The proportion and clinical characteristics of surgically resected HH patients were investigated in the case group.
Controls were randomly sampled at a 1:10 ratio from HH patients without a history of hepatic surgery. In a case-control study, it is known that when a relatively large number of controls are available, unmatched controls might provide a steadier estimate than the matched analysis. Since a significantly larger size of controls than cases was expected in our study, we performed unmatched random sampling for the control group [12].
Patients who underwent at least two follow-up radiologic studies within the study period became a subgroup for estimating the annual HH growth rate. The flow chart of the overall patient selection is depicted in Figure 1, and that at each hospital is shown in Supplementary Figure 1.

Flow chart indicating the patient enrollment for the two study aims. CDW, clinical database warehouse.
This study was approved by the Institutional Review Boards (IRB No.: B-2207-767-101) of Seoul National University Bundang Hospital (SNUBH). The requirement for written informed consent was waived due to the retrospective nature of the data analysis.
Data collection
Medical records were reviewed retrospectively for data regarding baseline demographics and clinical characteristics: age, sex, date of diagnosis and end of follow-up, symptom development, comorbidities, and laboratory findings. Baseline data were collected at the initial visit to the hospital. Imaging studies, including USG, CT, and MRI, were reviewed to obtain the characteristics of HH, such as size, lobar distribution, number of lesions, and depth of intrahepatic location. Size was defined as the longest diameter (LD) of the HH, and when multiple hemangiomas were identified in each patient, the LD of the largest hemangioma was measured. Change in size was described as both the absolute difference (the final size at the end of follow-up minus the initial size at the initial imaging study) and the relative growth compared with the initial size (expressed as a percentage) during the follow-up period. Growth rates were assessed by dividing the change in size by the follow-up period per year. Growth rates were then categorized as “substantial growth (≥ 5% in size compared to the initial diameter of HH)”, “stable”, and “substantial shrinkage (> 5% decrease compared to the initial size of the largest lesion)”. This categorization was also adopted in another study, as this arbitrary cutoff is meant to reduce the detection of small changes that may be attributed to measurement variability [9]. Since most hemangiomas are naturally indolent, 5% as the cutoff is reasonable. All data on tumor size, location, and distribution were obtained via formal readings provided by board-certified radiologists and with confirmation by a hepatology fellow (YCS).
Statistical analysis
All continuous variables are expressed as the mean ± standard deviation and were analyzed using Student’s t-test or the Mann–Whitney test. Categorical variables are summarized as percentages and were calculated using the chi-square test or Fisher’s exact test.
Logistic regression analysis was performed in the subgroup to search for independent factors associated with surgical resection and symptom development of HH. Variables with a p value < 0.1 in univariable analysis were subjected to multivariable analysis. Firth’s logistic regression was used to assess certain variables with outcomes at a very rare frequency.
The correlation between the LD of the largest HH at initial diagnosis and the HH growth rate was analyzed by Spearman’s rank correlation test because both variables were nonnormally distributed. A p value less than 0.05 was considered statistically significant in all analyses. All statistical analyses were conducted using the statistical software SPSS for Windows (Version 25.0; IBM Corporation, Armonk, NY, USA). The results of the data analysis were reviewed and certified by the independent statistical expert team at the Medical Research Collaborating Center at SNUBH.
RESULTS
Proportion, surgical details and outcomes of resected HH
The overall proportion of surgically treated HH patients was 36 per 11,049 (0.3%) in two hospitals (mean age: 46.5 yr; 61.1% female). The proportion of resected HHs at SNUBH was higher (31 per 5,965, 0.5%) than that at SNUH (5 per 5,084, 0.1%) because the enrollment period was shorter at SNUH, where liver surgery for cancer or transplantation was performed more frequently than at SNUBH. The reasons for surgery were growing HHs in 18 patients (48.6%), presence of symptoms in 16 patients (43.2%), and an unclear diagnosis of HH on radiologic studies in 2 patients (5.4%). Almost all symptomatic patients presented with compressive symptoms such as abdominal pain or dyspnea. None were identified as having a ruptured hemangioma.
A summary of the surgical details and outcomes is shown in Table 1. In all cases with multiple hemangiomas, only the largest HH producing symptoms were resected. Hemihepatectomy (38.9%) and sectionectomy (36.1%) were mostly performed, followed by segmentectomy (11.1%) and tumorectomy (8.3%), respectively. Surgical resection was performed mostly by laparoscopy (94.4%), and only two cases required open surgery (5.6%). There was one case of a 50-year-old female, as we had previously reported, who had diffuse hemangiomatosis occupying almost the entire liver, along with mild anemia (hemoglobin: 9.3 g/dL), mild thrombocytopenia (123,000/mm3), and a slightly prolonged prothrombin time (15.9 s), suspected to indicate mild Kasabach-Merritt syndrome. This patient received living-donor liver transplantation after transarterial embolization (TAE) and was cured [13].

Indication and summary of surgical details of case group
On postoperative pathologic analysis, 35 patients (97.2%) were identified as having a cavernous hemangioma. There were no cases of capillary hemangioma since the study involved only adults (> 18 yr). One patient was diagnosed with a sclerosed hemangioma. No malignant features or atypical vascular lesions were found in any of the cases.
Overall, surgical resection for HH was safely performed with little estimated blood loss, a relatively short operation time (mean: 201.5 min), and no postoperative complications.
Clinical characteristics of surgically treated HH
Thirty-six surgically treated HH patients comprised the case group, and 360 HH patients without surgical resection comprised the control group. Compared to the controls, cases were more likely to be multiple (≥ 2 in number), larger (7.7 ± 5.2 cm in the case group and 2.4 ± 1.8 cm in the control group) HHs located in the left lobe or subcapsular area with exophytic growth. In addition, the case group was more likely to have symptomatic HH and lower hemoglobin levels. Otherwise, there were no significant differences in terms of clinical characteristics, including age, sex, comorbidities, and laboratory results, between the case and control groups. These comparative characteristics are shown in Table 2. Detailed data on the baseline characteristics of the patients in each hospital are summarized in Supplementary Table 1 and Supplementary Table 2.
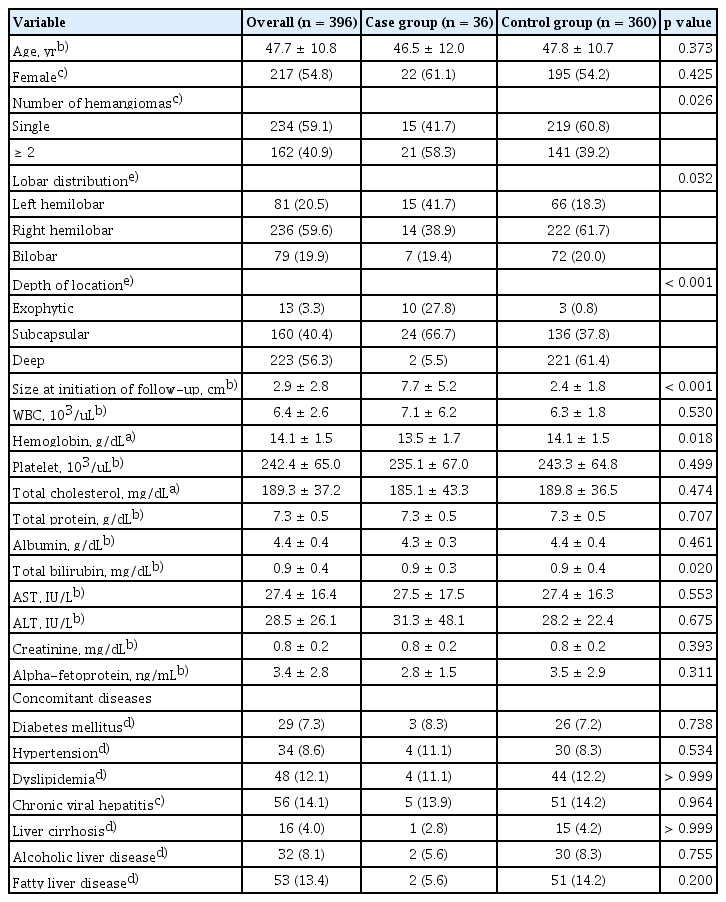
Comparison of clinical characteristics between hemangioma patients with and without surgery
Annual growth rate of HH
There were 20 patients in the case group and 203 patients in the control group who had at least 2 follow-up imaging studies during the study period, and their clinical characteristics and growth rates are summarized in Table 3. The annual mean growth of all subjects was 0.14 cm, with a growth rate of 4.8%. Among the 223 patients, 92 (41.3%) showed substantial growth (≥ 5% in size compared to initial HH diameter), 118 patients (52.9%) had a stable size, and 13 patients (5.8%) showed substantial HH shrinkage (> 5% decrease compared to initial size of largest lesion), while none of the 21 surgically treated patients showed substantial HH shrinkage during the follow-up (Fig. 2A). Furthermore, growth patterns according to the initial size in three categories (< 5, 5–10, ≥ 10 cm) are shown in Figure 2B-D. Patients with an initial HH diameter of ≥ 10 cm showed the highest proportion of substantial growth (83%), with 0.7 cm/year growth during the mean follow-up period of 5.5 years and substantial shrinkage in one patient (17%) with −0.2 cm/year growth during 7 years of follow-up.
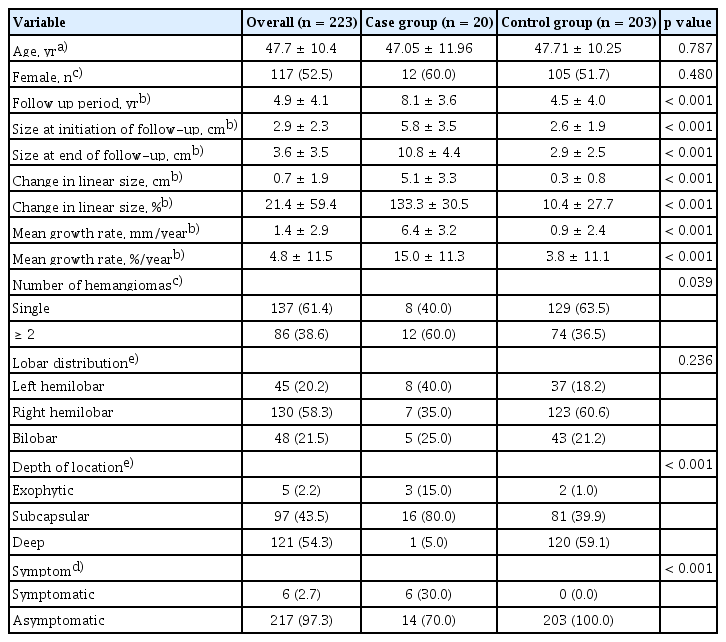
Baseline characteristics and hemangioma growth patterns of patients with follow-up imaging studies

Pie chart indicating the growth patterns overall and according to the initial size categories of subgroups. (A) Growth pattern in the overall subgroup (n = 223). (B) Growth pattern in hemangiomas measuring < 5 cm (n = 187). (C) Growth pattern in hemangiomas measuring ≥ 5 cm but < 10 cm (n = 30). (D) Growth pattern in hemangiomas measuring ≥ 10 cm (n = 6). Substantial growth was defined as growth of ≥ 5% compared to the initial longest diameter. Substantial shrinkage was defined as shrinkage of ≥ 5% compared to the initial longest diameter. Stable hemangioma size was defined as ranging between substantial growth and shrinkage.
Interval changes in size during follow-up were 5.1 ± 3.3 cm in the case group and 0.3 ± 0.8 cm in the control group, on average (p < 0.001). The relative changes in the percentage of linear size were 133.3% vs. 10.4% in the case and control groups, respectively (p < 0.001). The yearly mean growth rate was 6.4 mm/year vs. 0.9 mm/year, and the growth percentage was 15.0%/year vs. 3.8%/year in the case and control groups, respectively (p < 0.001). The median (interquartile range) values for growth rates were 0 cm/year (0–0.17) and 0%/year (0–5.8) in the overall group, 0.59 cm/year (0.42–0.81) and 12.63%/year (6.89–16.92) in the case group, and 0 cm/year (0–0.08) and 0%/year (0–4.31) in the control group. Laboratory and comorbidity profiles were not significantly different between the two groups. In addition, there was no significant difference in the growth rate of HH between males and females (Supplementary Fig. 2).
The correlation analysis between the initial LD of HH and annual growth rate showed a weak positive correlation (Spearman’s rank correlation coefficient [rho] 0.29, p < 0.001) (Fig. 3). This result suggested that initially large HHs tended to show rapid growth but are not necessarily meant to grow rapidly in the majority.

Relationship between size at diagnosis or initiation of follow-up and hemangioma growth rate. The correlation analysis between the initial longest diameter of the HH and the annual growth rate showed a weak positive correlation (Spearman’s rank correlation coefficient [rho]: 0.29, p < 0.001). This result suggested that initially large HHs tend to show rapid growth but do not necessarily show rapid growth in all cases. HH, hepatic hemangioma.
Factors related to surgery
To identify the factors associated with the surgical treatment of HH, logistic regression was performed in subgroups (Table 4). In the univariable analysis, multiple HHs, left lobar location, subcapsular or exophytic distribution, initial size ≥ 5 cm, and mean annual growth rate over 0.14 cm/year or 4.8%/year were associated with a higher risk for surgery. In the multivariable logistic regression, independent factors for surgical treatment were multiple HHs (odds ratio [OR] 7.64, 95% confidence interval [CI] 1.40–41.72, p = 0.019) and a mean annual growth rate over 4.8%/year (OR 30.73, 95% CI 4.86–194.51, p < 0.001). In addition, initial size, symptom presentation, and depth of location showed marginal significance with a wide range of 95% CIs of high ORs.

Univariable and multivariable logistic regression for surgical resection
Because symptomatic HH is an important indication for surgery, logistic regression was conducted for symptom development (Table 5). Factors associated with symptom development in the univariable analysis were an initial size larger than 10 cm (OR 92.50, 95% CI 11.08–772.10, p < 0.001), subcapsular or exophytic distribution (OR 16.37, 95% CI 0.91–294.17, p = 0.058), and faster growth rates in both absolute (OR 43.12, 95% CI 2.39–778.65, p = 0.011) and relative (OR 33.08, 95% CI 1.84–596.15, p = 0.018) measures. In the multivariable analysis, only HHs larger than 10 cm at diagnosis showed a statistically significant association with symptom exhibition (OR 10.50, 95% CI 1.06–103.77, p = 0.044).
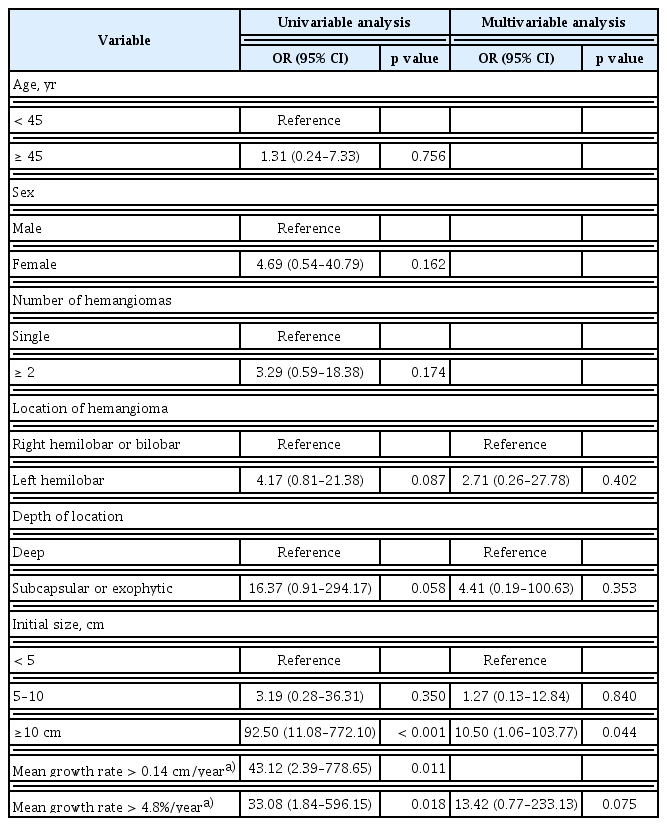
Univariable and multivariable logistic regression for odds of symptom development
DISCUSSION
This study shows that 0.3% of HHs were surgically treated due to progressive growth or symptom development. The predictors for surgery were multiple HHs and a mean growth rate > 4.8%/year, while left lobar location, depth of location, initial size > 10 cm, and symptom presentation showed marginal significance. The mean annual growth of all HHs was 0.14 cm, with a growth rate of 4.8%/year. Overall, 41.3% of HH patients showed substantial growth (≥ 5% in diameter); 52.9%, a stable size; and 5.8%, a substantial shrinkage (< 5% in diameter). The proportion of substantial growth was largest in the HH group, which initially measured ≥ 10 cm, followed by the 5–10 cm group and the < 5 cm group.
There are several previous studies on the characteristics and outcomes of surgically treated HH, but there are scarce data on the proportion of surgically treated HHs. Our results show that although 0.3% of HH patients underwent surgical treatment, the proportion ranged from 0.1% to 0.5%. This difference between the 2 hospitals may be related to the different enrollment periods and referral statuses. SNUBH was established in 2003 as a secondary hospital and later became a tertiary hospital. However, SNUH was established as a national representative hospital in 1945 with a heavy clinical burden of serious liver disease, such as liver cancer and liver transplantation. Therefore, HH patients were mostly re-referred after diagnostic confirmation at SNUH, which might have resulted in a lower proportion than that at SNUBH. Due to this gap in the proportion of surgery, we considered conducting a center effect analysis, but the outcome was too rare at SNUH, with only 3 patients capable of growth rate assessment. Presently, more HHs with a small size are being detected; thus, the proportion of surgically treated HHs might decrease compared to the findings in our study and occur in older patients during longer follow-ups in the future.
The reasons for surgery were rapid growth (48.6%) and symptom development (43.2%). Other indications were uncertainty of malignancy in two cases. Giant hemangiomas are commonly defined as hemangiomas larger than 4–5 cm. In our study, hemangiomas in the case group measured 11.5 ± 5.2 cm, with the smallest being 4.5 cm. Consequently, all cases corresponded to giant hemangiomas. Individual cases were assigned to an abdominal radiologist with more than 10 years of experience (YJL) and confirmed. In a retrospective 6-center study in the USA including 241 resected HH patients, the reasons for surgery were symptoms (85%) and increasing size (11%). The 30-day mortality was 0.8%, and the rate of Clavien-Dindo grade 3 or higher complications was 5.7%. This result could be related to the relatively larger size of resected HHs and the higher proportion of major hepatectomy [14]. A large-scale retrospective Chinese study of giant HHs > 10 cm showed that extremely giant HHs > 20 cm are more frequently accompanied by thrombocytopenia, prolonged prothrombin time, leukopenia, and anemia with Kasabach-Merritt syndrome. Additionally, the surgical procedure is difficult and risky compared to that for an HH size of 10–20 cm [15]. Therefore, the optimal timing of surgery should be determined in consideration of the patient’s symptoms and the size, growth pattern, and location of the HH.
Compared to nonsurgical cases, multiple HHs and those with a larger initial size, subcapsular/exophytic distribution, and lower hemoglobin level were more likely surgically treated. The independent predictors for surgery were multiple HHs and a faster mean yearly growth rate, whereas an initial size > 10 cm, presence of symptoms and subcapsular/exophytic location, and left lobar location showed marginal significance, probably due to the small sample size of the case group. Likewise, the independent predictor for symptom development was an initial size > 10 cm. The superficial intrahepatic location and rapid growth rate also had high ORs but did not show significance due to the small sample size of symptomatic HHs. Patients with an HH in a left lobar location or those with subcapsular/exophytic HHs were more likely to develop symptoms or to have lesions anatomically feasible for surgeons. After resection of problematic HHs, most of the patients with multiple lesions were not followed up for the remaining HHs. Interestingly, there have been several case reports on liver transplantation as a treatment for giant HH [13,16].
In this study, the mean annual linear growth rate of the HHs was 0.14 cm/year overall in 230 patients, while it was 0.03 cm/year in a USA multicenter study including 123 patients without the mention of surgery [9]. This discrepancy may be related to the sample selection criteria because our subjects included surgically treated patient cases and controls, while the USA study included 163 hemangiomas identified in 123 patients, regardless of surgery. Moreover, in the case of multiple HHs, we measured the largest HH, which might have resulted in a higher growth rate. The annual growth rate of surgically resected HHs was 0.64 cm/year, almost 7-fold faster than that of the nonsurgical group (0.09 cm/year). This change translates into relative annual growth rates of 15.8% and 3.7% in surgery cases and nonsurgical controls, respectively.
HH generally exhibits a benign and indolent clinical course [5–7]; however, 17–61% of HHs have been reported to show growth during follow-up [8,10,11]. Jing et al. [17] reported that 61.0, 24, and 9% of HH patients showed increased, stable and decreased size (without clear criteria of size change), respectively, within a median of 48 months. In our study, 41.3% exhibited substantial growth (> 5% from the initial diameter), 52.9% exhibited stable size, and 5.8% exhibited decrease in size during a mean follow-up of 4.9 years. Moreover, the growth pattern was different according to the initial size of the HH. Compared to an HH measuring less than 5 cm, the growing fraction of those ranging from 5–10 cm nearly doubled. The fraction of substantial growth was highest (83%) in HHs ≥ 10 cm. Hasan et al. [9] insisted that a larger initial size predicts a faster growth rate, and we have shown a compatible correlation between the initial size and growth rate of HHs.
In the past, HH growth was suggested to be associated with female sex hormones [18,19], but later, Kim et al. [20] showed pathologically that HH does not express estrogen and progesterone receptors. Moreover, Jing et al. [17] showed that the growth pattern of HHs did not differ between males and females. These findings are supported by our results, in which female sex was not associated with a higher risk for surgical resection, with mean growth rates (cm/year) of males and females being 0.10 and 0.17 (p = 0.073), respectively. When expressed as a percentage (%/year), the growth rate was 4.74 in males and 4.85 in females.
HH in adults is mostly the cavernous type and is not considered a true tumor but a slow-flow venous malformation in contrast to infantile hemangioma or congenital hemangioma because HHs are histologically composed of malformed vessels without glucose transporter-1 expression and mitosis [22,23]. Somatic alterations in genes involved in the PIK3CA/Akt/mTOR pathway, such as TEK and PIK3CA, are known to exist in venous malformations [24–26]. Although alterations in GJA4, KRAS, and BRAF have been reported in HH cases [21,27], detailed molecular studies of HHs are lacking to our knowledge. Therefore, further studies on the pathogenesis of and biomarkers for aggressive HHs are needed.
Although the outcome of TAE for giant HHs is controversial due to increased risks of ischemia, infection, intracavitary bleeding, and biliary damage along with vascular recanalization, a recent meta-analysis on the effectiveness showed a pooled diameter reduction of −4.37 cm with a high rate of symptom alleviation and safety [28]. Moreover, an Italian study showed that preoperative embolization and subsequent liver resection for giant HHs > 10 cm resulted in a significant reduction in intraoperative blood loss and operative time [29].
Our study had some limitations. First, due to the retrospective design, data on the presence of symptoms or surgical details were limited. Second, the change in size was measured only in linear dimensions, not in volumetric measures, and in the case of multiple HHs, only the largest hemangioma was measured for subgroup analysis. Additionally, since many of the patients were evaluated with few imaging studies and then re-referred to local clinics or hospitals, growth rates were estimated on the assumption that the size of hemangiomas changes uniformly regardless of the length of follow-up, which was suggested by Hasan et al. [9] regarding hemangioma growth rates. Additionally, the imaging modality was heterogeneous, since most of the patients were followed with USG after definite diagnosis with CT or MRI unless they had other hepatic comorbidities, such as cirrhosis. This factor might have led to a rather inaccurate estimated growth rate of HHs. Third, patients with inoperable HHs due to central localization and inadequate normal hepatic volumes might have been classified as the control group, providing the potential for selection bias. Finally, although data were obtained over a relatively long period (16 yr) in the two centers, the number of surgical cases was small. However, this study shows the proportion of surgically treated HHs, predictors of surgery, and long-term growth pattern of HHs, which provides useful information for the management of patients with HHs.
In conclusion, approximately 1 in 300 typical HH patients in our study were surgically treated due to progressive growth or symptom development. The predictors for surgery were multiple HHs and a mean growth rate > 4.8%/year. Overall, substantial growth was observed in 41.3% of HH patients, a stable size in 52.9%, and substantial shrinkage in 5.8%, with a mean annual HH growth of 0.14 cm (4.8%/year).
KEY MESSAGE
1. In this retrospective case-control study, we found that approximately one in 300 patients with a HH were surgically treated due to progressive growth or symptom development.
2. The predictors for surgery were multiple lesions and a mean growth rate > 4.8%/year.
3. Overall, substantial growth was observed in 41.3% of HH patients; a stable size, in 52.9%; and substantial shrinkage, in 5.8%, with a mean annual growth of HH of 0.14 cm (4.8%/year).
Acknowledgments
We would like to express our gratitude to all investigators who participated in this study and to the Medical Research Collaborating Center at SNUBH, which reviewed and certified the statistical analysis used in this study.
Notes
CRedit authorship contributions
Young Cheol Shin: conceptualization, data curation, formal analysis, methodology, project administration, visualization, writing - original draft, writing - review & editing; Eun Ju Cho: conceptualization, data curation, methodology, project administration, visualization, writing - original draft, writing - review & editing; Hee Young Na: conceptualization, data curation, methodology, project administration, writing - review & editing; Jai Young Cho: conceptualization, methodology, project administration, writing - review & editing; Ho-Seong Han: conceptualization, methodology, project administration, writing - review & editing; Yoon Jin Lee: conceptualization, data curation, methodology, project administration, writing - review & editing; Haeryoung Kim: conceptualization, data curation, methodology, project administration, writing - review & editing; Sangmi Jang: conceptualization, data curation, methodology, project administration, writing - review & editing; Gwang Hyeon Choi: conceptualization, data curation, formal analysis, methodology, project administration, writing - review & editing; Eun Sun Jang: conceptualization, methodology, project administration, writing - review & editing; Jin-Wook Kim: conceptualization, methodology, project administration, writing - review & editing; Sook-Hyang Jeong: conceptualization, methodology, investigation, data curation, formal analysis, validation, writing - original draft, writing - review & editing, visualization, supervision, project administration
Conflicts of interest
The authors disclose no conflicts.
Funding
None
Data availability statement
The data that support the findings of this study are available from the corresponding author upon reasonable request.