


INTRODUCTION
Stent-edge and reference segment changes are composed of the evolution of plaque and/or vessel area changes, which can be visualized with intravascular ultrasound (IVUS) before and after stenting [1-7]. Serial IVUS examination of the plaque is very important because it can offer a relatively exact mechanism of plaque evolution.
Recent trials have demonstrated that lipidlowering therapy with statins improves clinical outcomes [8,9] and reduces the progression of atherosclerosis [10]. The beneficial effects of statins, beyond their lipid-lowering actions, mostly rely on their anti-inflammatory properties [11]. Simvastatin has also been shown to inhibit smooth muscle cell proliferations [12].
To the best of our knowledge, few data are available regarding the effects of statins on plaque regression and vascular remodeling in peri-stent reference segments. In the present study, we assessed the effects of a usual dose of simvastatin on plaque regression and vascular remodeling in peri-stent reference segments after the use of a bare-metal stent (BMS) using serial IVUS observations. Our hypothesis was that a usual dose of simvastatin would not affect plaque regression and vascular remodeling in peri-stent reference segments after BMS implantation.
METHODS
Study population
From January 2004 through December 2005, 196 patients who were treated with BMS implantation under the guidance of IVUS at Chonnam National University Hospital, Gwangju, Korea, were analyzed retrospectively. The patients were divided into two groups: the simvastatin group (n = 132) and the non-statin group (n = 64). For the simvastatin group, a 20 mg/day schedule of simvastatin was introduced from just after stent implantation through the follow-up period without discontinuation.
Among 392 peri-stent reference segments, 12 segments proximal to the stent edge were excluded because of their ostial location. Therefore, 380 peri-stent reference segments were available for analysis, which consisted of 184 segments proximal to the stent edges and 196 segments distal to the stent edges.
Cases of stent thrombosis, ostial stenting, far distal stenting with < 2.5 mm of reference diameter, and inadequate IVUS quality were excluded from the analysis. The protocol was approved by the institutional review board of Chonnam National University Hospital. Hospital records of patients were reviewed to obtain clinical and demographic variables.
Laboratory analysis
In all patients, serum was collected before stent implantation for measuring lipid profiles and high-sensitivity C-reactive protein. All laboratory values were measured after an overnight fast. The serum levels of total cholesterol, low-density lipoprotein-cholesterol, high-density lipoprotein-cholesterol, and triglycerides were measured using standard enzymatic methods. High-sensitivity cardiac C-reactive protein reagent (Beckman Coulter, Fullerton, CA, USA) was used for the quantitative determination of C-reactive protein in serum samples on a fully automated IMMAGE® Immunochemistry System (Beckman Coulter). The IMMAGE® Immunochemistry System utilizes proven rate nephelometry methodologies to provide specific, reproducible, quantitative protein results. Serum lipid profiles and high-sensitivity C-reactive protein were measured at baseline and at follow-up.
Stent implantation procedure
Patients received BMS implantation for de novo lesions in native coronary arteries having a reference diameter between 2.5 and 4.0 mm. Stent implantation was performed as previously described [13]. If residual stenosis occurred after stent implantation, adjunctive balloon angioplasty using a balloon with the same size as, or a larger size than, the stent was performed.
Quantitative coronary angiography (QCA)
Angiograms were analyzed with a validated QCA system (Phillips H5000 or Allura DCI program; Philips Medical Systems, Best, The Netherlands). Using the outer diameter of a contrast-filled catheter as the calibration standard, the minimal lumen diameter and reference diameter were measured in diastolic frames from orthogonal projections.
In-stent restenosis
Patients were examined for in-stent restenosis during the follow-up period. Angiographic restenosis was defined as ≥ 50% stenosis in the stented segment, including peri-stent reference segments within 5 mm from each stent edge at follow-up, or at least a 50% loss of the original gain in the minimal luminal diameter.
IVUS imaging protocol
IVUS examinations were performed at post-stenting and at follow-up after intra-coronary administration of 300 µg nitroglycerin using a commercially available IVUS system (Boston Scientific Corporation/SCIMed, Minneapolis, MN, USA). This system allows for digital storage of pullback sequences. The IVUS catheter was advanced distally to > 5 mm from the distal stent edges, and imaging was performed using retrograde pullback at an automatic pullback speed of 0.5 mm/sec proximally to > 5 mm from the proximal stent edges.
IVUS analysis
We performed IVUS analysis for the entire 5-mm proximal and distal stent edge segments. Both proximal and distal vessel segments were divided into 1-mm subsegments and analyzed. Using planimetry software (TapeMeasure; INDEC Systems Inc., Mountain View, CA, USA), volumetric analysis for each subsegments was performed. External elastic membrane (EEM) and lumen areas were measured, and plaque plus media (P&M) area (EEM-lumen area) and plaque burden (P&M area divided by EEM area) were calculated from each cross-sectional slice and were expressed as mean values (summation of each measured values at 1-mm subsegments divided by 5). Area changes (Δ values) for each measurement were calculated as follow-up minus post-stenting values.
Statistical analysis
The SPSS version 15.0 (SPSS Inc., Chicago, IL, USA) was used for all analyses. Continuous variables were presented as the mean value ± 1 SD and compared using paired or unpaired Student t tests or a nonparametric Wilcoxon test if the normality assumption was violated. Discrete variables were presented as percentages and relative frequencies; comparisons were conducted using a chi-square test or Fisher's exact test as appropriate. A p value < 0.05 was considered statistically significant.
RESULTS
Baseline characteristics and changes in serum lipid profiles and high-sensitivity C-reactive protein
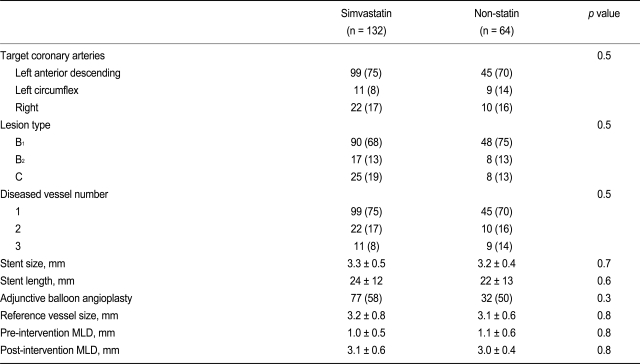
No significant differences in patient demographic variables and medications, except for statin use, were observed (Table 1). At follow-up, total cholesterol, low-density lipoprotein-cholesterol, and triglyceride levels had significantly decreased, and high-density lipoprotein-cholesterol level had significantly increased, in the simvastatin group as compared to the non-statin group. High-sensitivity C-reactive protein levels were also significantly lower in the simvastatin group as compared to the non-statin group during follow-up (Table 2).
QCA results and restenosis
No significant difference in baseline coronary angiographic findings and procedural results was observed between the simvastatin group and the non-statin group (Table 3). At follow-up, binary in-stent restenosis was present in 16% of the simvastatin group (21/132) and 20% of the non-statin group (13/64), and repeat revascularization was performed in 14% of patients in the simvastatin group (18/132) and 17% in the non-statin group (11/64). However, these differences were not significant (p = 0.3, p = 0.4, respectively).
IVUS results
IVUS follow-up was performed at a mean of 9.4 months after stenting (range, 5 to 19 months). No stent edge dissection was noted at post-stenting. Post-stenting peri-stent reference segment minimum lumen sites were 3.1 ± 2.1 mm from their respective proximal stent edges and 2.9 ± 1.9 mm from their respective distal stent edges. Overall, within these sites, P&M area increased (proximal edge, +0.5 ± 0.3 mm2, p < 0.001; distal edge, +0.6 ± 0.4 mm2, p < 0.001), and lumen area (proximal edge, -1.1 ± 0.5 mm2, p < 0.001; distal edge, -1.0 ± 0.4 mm2, p < 0.001) and EEM area (proximal edge, -0.6 ± 0.3 mm2, p < 0.001; distal edge, -0.4 ± 0.3 mm2, p = 0.001) decreased from post-stenting to follow-up.
Using volumetric analysis, overall, mean P&M area increased (Δ = +0.5 ± 0.5 mm2, p < 0.001 at the proximal edge and Δ = +0.6 ± 0.4 mm2, p < 0.001 at the distal edge), and mean EEM (Δ = -0.4 ± 0.3 mm2, p < 0.001 at the proximal edge and Δ = -0.3 ± 0.3 mm2, p < 0.001 at the distal edge) and mean lumen area (Δ = -0.9 ± 0.5 mm2, p < 0.001 at the proximal edge and Δ = -0.9 ± 0.4 mm2, p < 0.001 at the distal edge) decreased from post-stenting to follow-up.
For the proximal edge, mean P&M area significantly increased, and mean lumen area and mean EEM area significantly decreased at follow-up in both the simvastatin and non-statin groups. However, no significant differences were observed in changes in mean P&M (simvastatin, +0.3 ± 0.2 mm2 vs. non-statin, +0.7 ± 0.4 mm2; p = 0.10), mean EEM (simvastatin, -0.4 ± 0.4 mm2 vs. non-statin, -0.4 ± 0.3 mm2; p = 1.0), and mean lumen (simvastatin, -0.7 ± 0.4 mm2 vs. non-statin, -1.1 ± 0.6 mm2; p = 0.11) areas from post-stenting to follow-up between the simvastatin and non-statin groups at the proximal edge. For the distal edge, mean P&M area significantly increased, and mean lumen area and mean EEM area significantly decreased at follow-up in both the simvastatin and non-statin groups. However, no significant differences were observed in changes in mean P&M (simvastatin, +0.4 ± 0.2 mm2 vs. non-statin, +0.7 ± 0.3 mm2; p = 0.18), mean EEM (simvastatin, -0.3 ± 0.3 mm2 vs. non-statin, -0.3 ± 0.2 mm2; p = 1.0), and mean lumen (simvastatin, -0.7 ± 0.4 mm2 vs. non-statin, -1.0 ± 0.6 mm2; p = 0.19) areas from post-stenting to follow-up between the simvastatin and non-simvastatin groups at the distal edge (Table 4, Fig. 1).
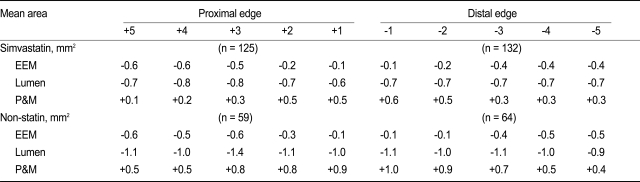
Although lumen loss within the first 3 mm from each stent edge was primarily due to an increase in P&M area rather than a change in EEM area, and lumen loss beyond 3 mm from each stent edge was due to a combination of increased P&M area and decreased EEM area, no significant differences were observed in changes in P&M, EEM, and lumen area at every 1-mm subsegment between the simvastatin and non-statin groups (Table 5).
In-stent restenosis occurred in 34 patients, including 14 stent edge in-stent restenosis (6 proximal edges and 8 distal edges). More significant lumen losses accompanied by a greater increase in P&M area and a greater decrease in EEM area occurred in the in-stent restenosis group as compared to the no in-stent restenosis group from post-stenting to follow-up: 1) P&M area (in-stent restenosis group, +1.4 ± 0.9 mm2 vs. no in-stent restenosis group, +0.6 ± 0.4 mm2; p < 0.001); 2) EEM area (in-stent restenosis group, -0.9 ± 0.5 mm2 vs. no in-stent restenosis group, -0.3 ± 0.3 mm2; p = 0.001); 3) lumen area (in-stent restenosis group, -2.3 ± 1.4 mm2 vs. no in-stent restenosis group, -0.9 ± 0.5 mm2; p < 0.001) No significant differences were observed in changes in P&M, EEM, and lumen areas according to the presence/absence of the use of post-stenting adjunctive balloon angioplasty.
DISCUSSION
The results of this study demonstrate that usual dose-simvastatin therapy does not affect disease progression (plaque increase and lumen loss) and vascular remodeling in peri-stent reference segments in patients undergoing BMS implantation.
Several IVUS studies have demonstrated the effects of statins on plaque regression and vessel remodeling. Suzuki et al. [14] reported that plaque area decreased by 12% in patients who received a statin as compared to 13% increase in plaque area in those who did not receive a statin. Additionally, vessel area was not enlarged in patients treated with a statin, but did show positive remodeling in those who had plaque progression without a statin. Jensen et al. [15] reported a significant reduction (4.6%) in the lesion EEM area and in the lesion plaque area (5.9%), but no change in reference measurements after 12 months of simvastatin treatment. As a result, the remodeling index was reduced by simvastatin from 1.01 ± 0.12 to 0.95 ± 0.09. Petronio et al. [16] reported that therapy with 20 mg/day of simvastatin did not prevent intimal hyperplasia or in-stent restenosis, but it promoted atherosclerotic regression both at stented and nonstented sites in patients with normocholesterolemia who underwent coronary stenting. However, the main objectives of previous studies [14-16] have not been to assess the effects of statins on plaque regression and vascular remodeling in peri-stent reference segments in patients who underwent BMS implantation. In the present study, we sought to assess the effects of a usual dose of simvastatin (20 mg/day) on plaque regression and vascular remodeling at peri-stent reference segments; however, therapy with 20 mg/day of simvastatin did not regress plaque at either the proximal or distal edges from post-stenting to follow-up, and did not prevent in-stent restenosis at a mean of 9.4 months of follow-up after stenting.
The response of adjacent reference segments not covered by the stent is of major interest. Several studies have demonstrated lumen loss adjacent to the stent edge after BMS implantation. Hoffmann et al. [2] performed serial IVUS analysis at the most normal-looking cross section within a 10-mm segment proximal or distal to the stent, another midway between this slice, and the proximal or distal edge of the stent. In this study, the more distant reference segments showed a greater degree of remodeling (decrease in EEM area) than of tissue growth, whereas anatomic sections sampled at a point closer to the edge of the stent showed a similar amount of remodeling and a greater degree of cellular proliferation (increase in P&M area) as compared to the more distant reference segments. Mudra et al. [3] reported no relevant progression of the disease adjacent to the stent, despite a considerable plaque burden within the reference segments. Weissman et al. [4] analyzed reference segments 10 mm proximal and distal to the stent at index and follow-up. In this study, lumen loss in the adjacent reference segments, which was most pronounced within the first 2 mm of the stent edge, and lumen loss within 2 mm of the stent edge were due primarily to intimal proliferation. In contrast, beyond 2 mm, negative remodeling contributed more to lumen loss. In the present study, lumen loss within the first 3 mm from each stent edge was primarily due to an increase in P&M area rather than a change in EEM area. Lumen loss beyond 3 mm from each stent edge was due to a combination of increased P&M area and decreased EEM area.
The present study has some limitations. First, the present study is retrospective and therefore subject to limitations inherent to this type of clinical investigation. Second, this single-center study included only a small number of patients. Third, we did not assess changes in EEM, lumen, and plaque areas that were more distant from the stent edges, i.e., segments that were not affected by the stent or balloon. Fourth, we did not compare the effects of low-dose statin with moderate or high-dose statin therapy on plaque regression and vascular remodeling. Therefore, further prospective, randomized, large-scale studies are needed.
In conclusion, a usual dose of simvastatin does not inhibit plaque progression and lumen loss and does not affect vascular remodeling in peri-stent reference segments in patients undergoing BMS implantation.


 PDF Links
 PubReader
 ePub Link
 Full text via DOI
 Download Citation
 Print
Print


