


INTRODUCTION
Accumulating clinical studies have shown that approximately half of the clinically presenting cases of heart failure (HF) have HF with normal or preserved left ventricular (LV) ejection fraction (EF) [1]. Various diagnostic criteria have been proposed by various papers: (1) clinical presentation of HF symptoms; (2) normal or preserved LVEF; and (3) LV diastolic dysfunction demonstrated by Doppler echocardiography or cardiac catheterization. The above three points are now considered standard diagnostic criteria [2]. We have already reported that vascular function [3,4], blood electrolytes [5,6], Heavy, Hypertensive, atrial Fibrillation, Pulmonary hypertension, Elder, Filling pressure (H2FPEF) scores [7], nutrition indexes [8], and diastolic late mitral annular velocity determined by echocardiography [9] are potent prognostic factors for patients who have HF with preserved EF (HFpEF). Hypertension causes the majority of HFpEF cases. The pathological conditions that can accompany HFpEF are diverse, and it has many comorbidities, including not only cardiovascular but also non-cardiovascular diseases, and this fact contributes to the high rates of hospitalization and death in HFpEF patients [10].
In the past year, the Heart Failure Association (HFA) of the European Society of Cardiology proposed a new diagnostic algorithm for HFpEF, incorporating the HFA-PEFF diagnostic algorithm [11]. This algorithm is composed of four steps. In the second step, the HFA-PEFF score is calculated for each patient (Supplementary Table 1). If the HFA-PEFF score is ≥ 5, HFpEF is diagnosed, and if the score is ≤ 1, HFpEF can be excluded. If the HFA-PEFF score is 2 to 4, representing an intermediate probability of HFpEF, functional testing is recommended in the third step. This stepwise diagnostic approach from initial clinical assessment to more specialized tests is expected to be useful [11]. The HFA-PEFF score is well validated as a tool for the diagnosis of HFpEF [12]. These concepts were comprehensively reviewed in a recent article [13].
Recently, Sotomi et al. [14] investigated the prognosis in 408 HFpEF patients and reported the association between HFA-PEFF scores and future HF-related events. Thus, we investigated the value of HFA-PEFF scores in predicting subsequent cardiovascular events in HFpEF patients at our institutions. The aim of the study is to assess this scoring system for overall CVD event prediction and not merely for HF outcomes.
METHODS
This study was a prospective, single-center observational study.
Ethics statement
All procedures were conducted in accordance with the Declaration of Helsinki and its amendments. The study protocol was approved by the Institutional Review Board of Kumamoto University (approval number, Senshin 2,225). This study is registered in the University Hospital Medical Information Network (UMIN) Clinical Trials Registry (UMIN000036884). There is no written consent because we obtained the consent of the participants by using “the opt-out material.” Opt-out materials are available at the following address: https://kumadai-junnai.com/wp-content/uploads/houkatsu.pdf.
Study design and patients
We prospectively investigated 948 consecutive patients with HF who were hospitalized in Kumamoto University Hospital between January 2007 and September 2013. We recorded each patient’s medical history and relevant clinical characteristics. We excluded 443 patients for the following reasons: severe valvular disease (n = 118), chronic renal failure requiring hemodialysis (n = 65), systemic inflammatory disease (n = 5), acute renal failure with dehydration (n = 1), and not meeting the diagnostic criteria for HFpEF as subsequently described (including HF with a reduced LVEF [HFrEF], n = 251). We subsequently calculated the HFA-PEFF score of each of these HFpEF patients, and the subjects were subdivided into low-score (0–1), intermediate-score (2–4), and high-score (5–6) groups according to the original concepts of HFA-PEFF scoring as described below. We excluded patients with insufficient data (n = 3), and we also excluded the low-score group (n = 3) because this group had a low probability of having HFpEF. Finally, the remaining 502 patients were enrolled in this study and followed for up to 1,500 days to track the occurrence of composite cardiovascular events and HF-related events. A flow chart of the study is shown in Fig. 1.
Definition of HFpEF
HFpEF was clinically defined according to the European Society of Cardiology task force, as follows: (1) symptoms or signs of HF; (2) normal or mildly reduced LVEF (LVEF > 50% and LV end-diastolic volume index < 97 mL/m2); (3) evidence of abnormal LV relaxation, filling, diastolic distensibility, and diastolic stiffness.
We excluded HFpEF patients who had shown even a transient reduction in EF. Hence, HFpEF patients whose LVEF was < 50% and was improved by optimal medical therapy were not included in the present study. In our study, we stratified patients by the ratio of early transmitral flow velocity to early diastolic mitral annular velocity (E/e′), classified as either a ≥ 15 ratio or a ratio between 8 and 15; we also stratified patients by plasma brain-type natriuretic peptide (BNP) levels, with a cutoff of 100 pg/mL. Physicians further confirmed that the patients had HF by determining their New York Heart Association (NYHA) functional class [15], which was assessed by the standard questionnaire while the patients were in stable condition after optimal therapy.
Calculation of the HFA-PEFF score
The calculation of the HFA-PEFF score has been described previously [11]. In brief, the score has functional, morphological, and biomarker domains. Within each domain, a major criterion is worth 2 points, and a minor criterion is worth 1 point (Supplementary Table 1).
A total score ≥ 5 points is considered to be diagnostic of HFpEF, while a score of ≤ 1 point is considered to make a diagnosis of HFpEF very unlikely and to mandate investigations for alternative causes. Patients with an intermediate score (2–4 points) need further evaluation [11]. We subsequently calculated the HFA-PEFF scores of these HFpEF patients, and the subjects were subdivided into low- (0–1), intermediate- (2–4), and high-score (5–6) groups.
Echocardiographic examinations
The patients underwent echocardiography while they were in stable condition after admission; the examinations were performed by experienced cardiac sonographers who had no knowledge of the study data. The methods have been described in detail previously [9].
Biomarker measurement
Early-morning fasting blood samples were obtained while the patients were in stable condition. The patients’ BNP levels were analyzed using a commercially available assay (Abbott Japan, Matsudo, Japan) in the hospital clinical laboratory on admission. The estimated glomerular filtration rate (eGFR) was calculated using the Japanese Society of Nephrology formula [19].
Follow-up and outcomes
Patients were followed up prospectively at our outpatient clinics or by a primary care physician every month until July 2017 or until the occurrence of a cardiovascular event, including the following: cardiovascular death, hospitalization for HF decompensation, nonfatal myocardial infarction (MI), unstable angina pectoris, coronary revascularization for a new diagnosis of angina or in-stent restenosis after percutaneous coronary intervention, and nonfatal ischemic stroke. Cardiovascular death was defined as death within 30 days of a documented cardiovascular event, sudden death without apparent non-cardiovascular causes, MI, death from HF, or death from stroke. Hospitalization for HF decompensation was defined as having occurred if the patient was admitted for at least an overnight stay in the hospital because of HF with typical symptoms and had objective signs of worsening HF requiring intravenous drug administration. MI was diagnosed by an increase or decrease in cardiac biomarkers (plasma creatine kinase-MB or cardiac troponin) above the 99th percentile of the upper limit of the normal range together with evidence of myocardial ischemia and at least 1 of the following symptoms: electrocardiographic changes (new ST-T changes, left bundle branch block, or pathological Q wave), imaging evidence of new viable myocardial loss, or a new regional wall motion abnormality [20]. Unstable angina pectoris was diagnosed according to new or accelerating symptoms of myocardial ischemia accompanied by new ischemic ST-T-wave changes. Ischemic stroke was diagnosed according to a documented focal neurological deficit with radiological evidence of brain infarction, excluding intracranial hemorrhage. The primary and secondary endpoints were composite cardiovascular event (cardiovascular death, hospitalization for HF decompensation, and nonfatal stroke) occurrence and HF-related event (hospitalization for HF decompensation) occurrence, respectively, at 1,500 days. Cardiovascular events were ascertained by reviewing medical records and were confirmed by direct contact with the patients, their families, and physicians or by an annual telephone interview with each patient. An Events Committee comprising at least three independent physicians reviewed all events to avoid intraobserver biases.
Statistical analysis
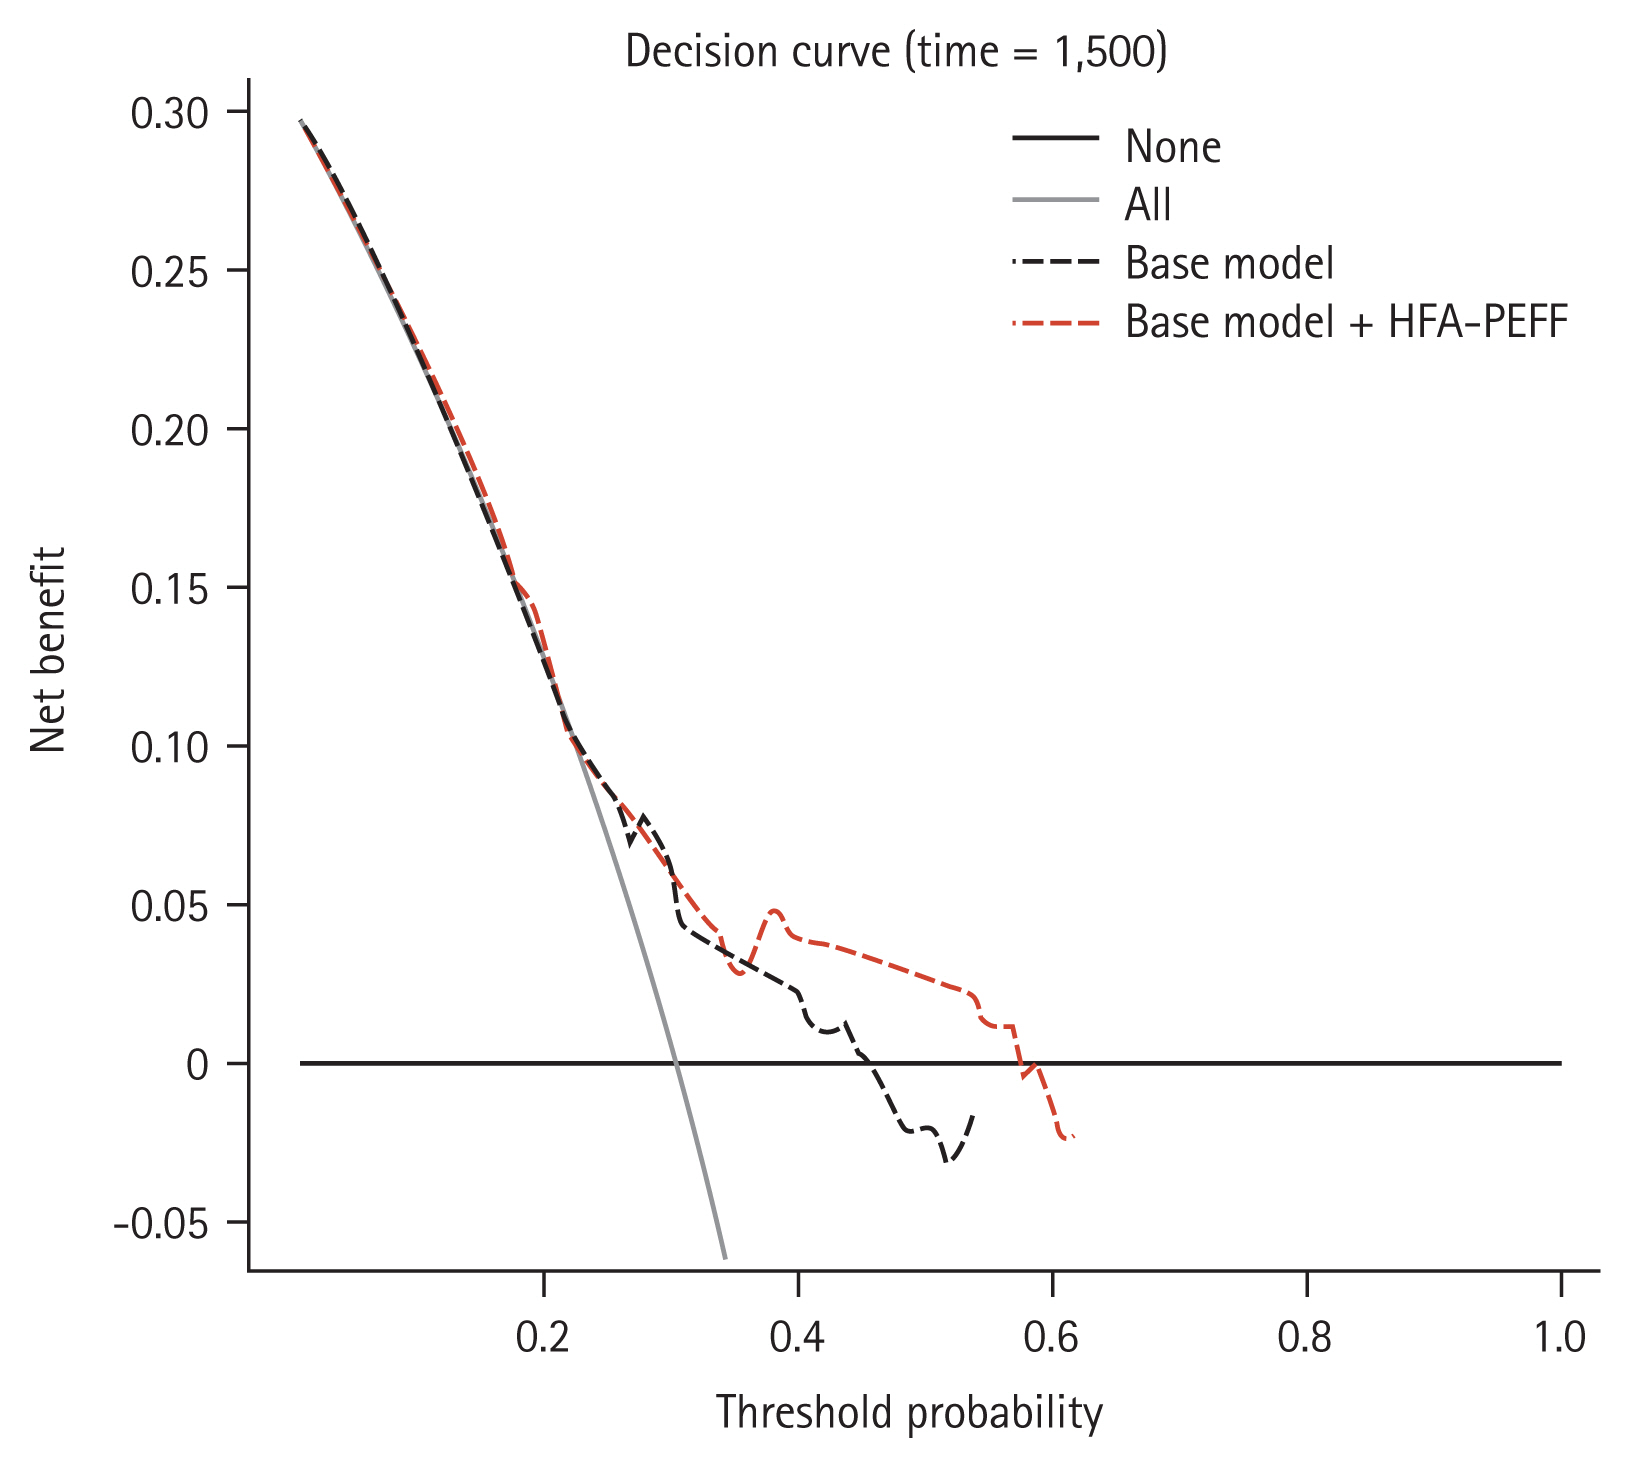
Continuous variables are expressed as the mean ± standard deviation for normally distributed variables according to the Shapiro-Wilk test. Variables with a nonnormal distribution are expressed as the median value with the interquartile range. Categorical variables are presented as frequencies and percentages. Intergroup differences in categorical variables were determined using Fisher’s exact test. Differences in continuous variables were analyzed by the unpaired t test or the Mann-Whitney U test, as appropriate. Missing data were excluded from the analyses. A Kaplan-Meier curve was used to determine the cumulative incidence of composite cardiovascular events and HF-related events. The log-rank test was used to compare the incidence of these events between the two groups. The Cox proportional hazards model was used to estimate the hazard ratios (HRs) for HF-related events by univariate and multivariate analyses. We selected variables that were statistically significant in the univariate analyses (p < 0.05) and excluded variables that would cause internal correlations. The factors of plasma BNP level, E/e′ ratio, maximum velocity of tricuspid regurgitation (TRVmax) and LVMI were components of the HFA-PEFF score, and we expected that plasma BNP level, E/e′, tricuspid regurgitation pressure gradient, pulmonary artery pressure, and LVMI would cause internal correlations with the HFA-PEFF score variable. Furthermore, the estimates of Harrell’s C-statistics in the Cox proportional hazards regression models were compared after the addition of high HFA-PEFF score to conventional factors identified in the subanalysis of the Irbesartan in Patients with Heart Failure and Preserved Ejection Fraction (I-PRESERVE) trial [21,22]. The factors are age, previous hospitalization for HF, diabetes mellitus (DM), and BNP level; however, we excluded BNP level because plasma BNP is a component of the HFA-PEFF score. Therefore, we defined age, previous hospitalization for HF and DM as the 3 prognostic factors (PF3). We also assessed the incremental effects of adding a high HFA-PEFF score to the PF3 to predict HF-related events using the net reclassification improvement (NRI). The categorical NRI has been described previously [23,24]. Decision curve analysis (DCA) was used to quantify the clinical usefulness of the prediction models [25]. A p < 0.05 was considered statistically significant. Harrell’s C-statistic, NRI, and integrated discrimination improvement (IDI) were calculated by the R package PredictABEL (R Foundation for Statistical Computing, Vienna, Austria). The DCA analysis was performed using the R package ggplot2. The software SPSS version 26.0 (IBM Japan, Tokyo, Japan) was used for other statistical analyses.
RESULTS
Clinical characteristics of enrolled patients with HFpEF
A total of 502 patients with HFpEF were enrolled in this study. The numbers of patients (percentage) with intermediate and high scores were 311 (62.0%) and 191 (38.0%), respectively. The baseline characteristics of the HFpEF patients are shown in Table 1. Overall, the patients had a mean age of 71.6 ± 9.5 years, and 55% were male. The prevalence rates of DM and ischemic heart disease (IHD) were reduced in the high-score group. Plasma BNP levels, left atrial diameter, LVMI, and E/e′ were significantly increased in the high-score group. Hemoglobin and eGFR levels were significantly reduced in the high-score group. While the rate of diuretic prescription was significantly increased in the high-score group, the other drugs, including angiotensin-converting enzyme inhibitors, angiotensin II receptor blockers, calcium channel blockers, beta blockers and statins, were prescribed at similar rates in both groups.
Cardiovascular events at follow-up
Overall, 236 cardiovascular events were recorded during the follow-up period (median, 1,157 days). Table 2 shows the details of cardiovascular events during follow-up. We found a significantly higher rate of hospitalization for HF decompensation events in the high-score group than in the intermediate score group (p < 0.001). We also found a significantly higher rate of coronary revascularization in the high-score group than in the intermediate-score group (p = 0.001); however, other events did not differ in frequency between the two groups.
Kaplan-Meier curves
We performed a Kaplan-Meier analysis and observed that there were significant differences in the rates of composite cardiovascular events and HF events between the two groups (p = 0.003 and p < 0.001, respectively) (Fig. 2).
Cox proportional hazards analyses
Table 3 shows the results of univariate and multivariate Cox proportional hazards analyses for HF-related events. Univariate Cox proportional hazards analysis identified previous hospitalization for HF (HR, 2.30; 95% confidence interval [CI], 1.51 to 3.50; p < 0.001), NYHA III or IV (HR, 2.83; 95% CI, 1.89 to 4.23; p < 0.001), presence of hypertension (HR, 0.57; 95% CI, 0.38 to 0.85; p = 0.007), presence of IHD (HR, 0.56; 95% CI, 0.38 to 0.82; p = 0.003), presence of atrial fibrillation (AF; HR, 1.76; 95% CI, 1.20 to 2.59; p = 0.004), hemoglobin level (HR, 0.85; 95% CI, 0.76 to 0.94; p = 0.001), high HFA-PEFF score (HR, 2.18; 95% CI, 1.49 to 3.19; p < 0.001), TRVmax > 2.8 m/sec, and high BNP level as significant factors associated with HF-related events. In a multivariate Cox proportional hazard analysis that included PF3 by forced-entry logistic regression (Model 1), previous hospitalization for HF (HR, 2.02; 95% CI, 1.32 to 3.10; p = 0.001) and a high HFA-PEFF score (HR, 1.98; 95% CI, 1.35 to 2.92; p = 0.001) were independently and significantly associated with HF-related events. Multivariate Cox proportional hazards analysis using the abovementioned significant factors from the univariate analysis (Model 2) identified NYHA III or IV (HR, 1.70; 95% CI, 1.07 to 2.70; p = 0.026), hemoglobin levels (HR, 0.87; 95% CI, 0.79 to 0.97; p = 0.011) and a high HFA-PEFF score (HR, 1.66; 95% CI, 1.11 to 2.50; p = 0.014) as independent predictors of HF-related events in patients with HFpEF.
Receiver operating characteristic analysis for HF-related events and HFA-PEFF score
Receiver operating characteristic (ROC) curves were constructed to assess the ability of the HFA-PEFF score to predict HF-related events (Fig. 3). The area under the curve of the HFA-PEFF score for the detection of HF-related events was 0.633 (95% CI, 0.574 to 0.692; p < 0.001). When a cutoff value of 4.5 was applied to HFA-PEFF scores, the sensitivity and specificity were 57.8% and 67.4%, respectively, for the detection of HF-related events.
Harrell’s C-statistic for regression models, continuous NRI and IDI
The value of Harrell’s C-statistic for PF3 was 0.598 (95% CI, 0.539 to 0.657); after an HFA-PEFF score ≥ 5 was added as a factor, the value was 0.630 (95% CI, 0.571 to 0.689; p = 0.021). We reclassified the risk of HF-related events after adding an HFA-PEFF score ≥ 5 to PF3; the continuous NRI was 27.3% (p = 0.007), and the IDI was 4.1% (p < 0.001) (Table 4).
Kaplan-Meier curves in subgroup analyses
The HFA-PEFF score differs depending on whether the patient has sinus rhythm (SR) or AF. Thus, we divided the Kaplan-Meier analysis by separately assessing the prognostic relevance of this score in patients with AF and in patients with SR (Supplementary Fig. 1). The Kaplan-Meier analyses showed that, among patients with SR, the high-score group had a higher risk of composite cardiovascular events than the AF group (p = 0.015) (Supplementary Fig. 1A). Additionally, these analyses showed that there was no significant difference in composite cardiovascular events between the AF patients in the intermediate and high groups (p = 0.064) (Supplementary Fig. 1B). Additionally, they showed that the high-score group had a higher risk of HF-related events than the intermediate-score group whether the patients had SR or AF (SR, p = 0.001, Supplementary Fig. 1C; AF, p = 0.008, Supplementary Fig. 1D).
Additional Cox proportional hazards analyses in the short term
Supplementary Table 2 shows the results of univariate and multivariate Cox proportional hazards analyses for HF-related events at 365, 730, and 1,095 days. Multivariate Cox proportional hazard analyses revealed that a high HFA-PEFF score was an independent and significant predictor of HF-related events at 1,095 days but not at 365 or 730 days.
DISCUSSION
The main undertaking in this study was to classify the prognosis of HFpEF patients by HFA-PEFF score, and the main findings of this study were as follows. (1) The Kaplan-Meier curve revealed that the higher the HFA-PEFF score was, the higher the incidence of composite cardiovascular disease events and HF-related events. (2) Multivariate Cox proportional hazards analysis revealed that the HFA-PEFF score was an independent and significant predictor of clinical outcomes in HFpEF patients. (3) The cutoff HFA-PEFF score for HF-related events was 4.5. (4) The NRI and IDI were significant when an HFA-PEFF score ≥ 5 was added to the PF3. (5) DCA revealed that combining the HFA-PEFF score with conventional prognostic factors improved the prediction of HF-related event risk.
Observational studies report that HFpEF accounts for nearly half of all cases of HF. The percentage of HP patients in Japan with an LVEF of 50% or more was 50.6% in the Chronic Heart Failure Analysis and Registry in the Tohoku District (CHART)-1 study [26] and 68.7% in the subsequent CHART-2 study [27]. Regarding the prognosis of HFpEF, there was no significant difference in all-cause mortality or in the rate of rehospitalization due to exacerbation of HFrEF in the Japanese Cardiac Registry of Heart Failure in Cardiology (JCARE-CARD) study [28]. A meta-analysis showed that the prognosis of HFpEF is somewhat better than that of HFrEF [29], and similar analysis results were reported in the CHART-2 study [30]. However, the abovementioned meta-analysis [29] showed that the difference in prognosis between HFpEF and HFrEF decreases as age increases. In any case, it should be noted that there is a high proportion of patients with HFpEF in the world, the prognosis is similar to or worse than that of HFrEF, and HFpEF will increase in the super-aging society of the future.
Regarding the patient baseline characteristics (Table 1), it is unclear why women made up a majority of patients with high HFA-PEFF scores; however, we speculate that the reason may be as follows: HFpEF causes diastolic dysfunction as a result of HF risk factors such as obesity, hypertension, diabetes, and AF that cause increased inflammation and oxidative stress, resulting in vascular endothelial damage, myocardial hypertrophy, and myocardial fibrosis [31]. Since the progression of LV diastolic disorder is remarkable in women over 60 years of age [32], elderly women are considered to be at high risk for HFpEF onset. The reason why the risk of IHD decreases as the HFA-PEFF score increases is thought to be that patients with high HFA-PEFF scores are likely to be in a state of HF or have a history of HF (which the HFA-PEFF scale was originally designed to assess), as shown by the administration of vasodilators or statins (Table 1). Therefore, the onset of IHD might be suppressed. Other components of the results are considered to be proportional to the severity of HF.
In the Cox proportional hazards analyses (Table 3), the presence of hypertension and the hemoglobin level were positive and negative independent predictors, respectively, and were considered to be influenced by age. The calculation methods for the HFA-PEFF score are concise; however, the final score does not reflect which factors influenced the endpoint or to what extent because it is calculated through linear equations with various coefficients. In the univariate analyses, the hypertension and IHD were protective against HF-related events (HR, 0.57 for hypertension and 0.56 for IHD). The reason is not clear, but we speculate the following explanation. Accumulating clinical studies have demonstrated that hypotensive agents (angiotensin receptor blockers [33], mineralocorticoid receptor antagonists [34], and diuretics [35]) and dyslipidemia drugs such as statins [36,37] are effective for the prevention and treatment of HF. The effects of these drugs are thought to suppress HF events.
The H2FPEF score is a composite score to diagnose symptomatic euvolemic patients with HFpEF using a weighted score based on six variables that range from 0 to 9 [38]. The H2FPEF score demonstrated predictive value for future HF-related events both in HFpEF patients and in non-HF patients with cardiovascular risk factors [39–41]. We have already reported that the H2FPEF score is a useful marker for the prediction of cardiovascular and HF-related events in HFpEF patients in the same cohort [7]. Selvaraj et al. [42] reported the usefulness of the H2FPEF score and HFA-PEFF score for clinical outcomes in HFpEF patients. They analyzed a community-based epidemiological study, the Atherosclerosis Risk In Communities (ARIC) study. However, the subjects of the ARIC study were patients without other common cardiopulmonary causes of dyspnea. In addition, the subjects were 67 to 90 years old. Therefore, the participants in the ARIC study must be considered a limited cohort. In contrast, the subjects in the present study were all Asian and ranged in age from 32 to 90 years old. In other words, the cohort in the present study reflects the general population.
Considering that HFA-PEFF scoring was originally developed to improve the accuracy of HFpEF diagnosis, it is distinctly possible that the phase of HF differs between the intermediate- and high-score groups. The high-score group had a significantly larger proportion of NYHA III to IV and a higher BNP level than the intermediate-score group; thus, the phase of HF appears to be different, and patients in the high-score group are considered to have a worse prognosis because their HF is more severe. Moreover, a high HFA-PEFF score was an independent and significant predictor of HF-related events at 1,095 days but not at 365 or 730 days (Supplementary Table 2). These results suggest that HFpEF patients should be followed up for at least 3 years. When we compared the incremental prognostic performance of the HFA-PEFF score versus the available individual standard parameters, high TRVmax and high BNP level were significantly associated with HF-related events as well as high HFA-PEFF scores in univariate Cox proportional hazards analyses (Table 3). However, since the NRI and IDI were significant when an HFA-PEFF score ≥ 5 was added to PF3 (Table 4), we believe that a high HFA-PEFF score has incremental prognostic value.
This study is an innovative study to investigate the association of a new marker, the HFA-PEFF score, with future HF-related events in HFpEF patients. Each component of the HFA-PEFF score is simple, and the assessment is not only easy in clinical practice but also well validated and inexpensive, which indicates that the score can be widely applied. If this score further predicts subsequent cardiovascular events in HFpEF patients, it will also represent a useful clinical indicator for general clinicians as well as cardiologists. Although the HFA-PEFF score is highly likely to have clinical value, large-scale clinical studies are required to confirm its value. Therefore, additional detailed, prospective, multicenter studies are warranted to verify the precision and usefulness of this measure.
The present study has some limitations. First, it was a single-center study with a relatively small sample size. Therefore, a larger, multiracial, multicenter study is required for confirmation. Second, we could not compare the prognostic performance of the HFA-PEFF score and the 2016 American Society of Echocardiography/European Association of Cardiovascular Imaging (ASE/EACVI) score [43] in determining the risk of HF-related hospitalization or mortality due to the lack of left atrium (LA) volume index data. The 2016 ASE/EACVI algorithm enables echocardiographic estimation of LA pressure and grading of diastolic dysfunction based largely on mitral inflow pattern. Third, in the present study, it was difficult to analyze the outcomes by cause of death due to the lack of detailed data on the causes of death. Finally, it is unclear which factors contribute—and to what extent they contribute—to a poor HF prognosis. Thus, further pathophysiological and molecular physiological studies, including animal experiments, are warranted. Additional detailed, large-scale clinical studies may be required to verify our results.
In conclusion, the HFA-PEFF score, which can be easily and accurately calculated, may be useful for predicting 1,500-day composite cardiovascular events as well as HF-related events in HFpEF patients. Although there are many factors that affect the prognosis of HFpEF patients and there is still a need for large-sample multicenter studies to confirm the prognostic value of the HFA-PEFF score for these patients, our results might provide substantial insights into the prognosis of patients with HFpEF.
KEY MESSAGE
1. The higher the Heart Failure Association (HFA)-PEFF score was, the higher the incidence of composite cardiovascular disease events and heart failure (HF)-related events.
2. The HFA-PEFF score was an independent and significant predictor of clinical outcomes in HF with preserved ejection fraction (HFpEF) patients.
3. The cutoff HFA-PEFF score for HF-related events was 4.5.
4. Therefore, the HFA-PEFF scores may be useful for predicting HF-related events in HFpEF patients.


 PDF Links
 PubReader
 ePub Link
 Full text via DOI
 Download Citation
 Supplement 1
 Print
Print


