


INTRODUCTION
Since the first reported severe acute respiratory syndrome coronavirus 2 (SARS-CoV-2) infection in Wuhan, China in December 2019, the number of people infected with coronavirus disease 2019 (COVID-19) has exceeded 200 million worldwide [1]. Although the number of COVID-19 survivors is increasing despite an increase in confirmed COVID-19 cases, survivors are still in a fragile state even after hospital discharge, which can place additional burdens on healthcare systems around the world. According to Donnelly et al. [2], 19.9% of patients discharged after hospitalization for COVID-19 were readmitted, and 9.1% died within 60 days. Furthermore, readmission and mortality rates at 140 days post-COVID-19 were 29% and 12%, respectively [3]. Therefore, the long-term health effects associated with COVID-19 must be evaluated.
Long COVID syndrome refers to new or ongoing symptoms 4 weeks or more after the onset of acute COVID-19 that persist for 12 weeks or more [4,5]. Because COVID-19 affects multiple organ systems, the long-term effects of COVID-19 can involve symptoms such as fatigue, headaches, and hair loss [6,7]. In a cohort study of 273,618 COVID-19 survivors, post-COVID-19 syndrome affected 36.6% of patients for between 3 and 6 months. Common symptoms included abnormal respiration (7.9%) and fatigue (5.9%) [8].
Recently, 1-year follow-up studies have been conducted for clinical characteristics and pulmonary sequelae after initial SARS-CoV-2 infection [9–11], which showed that muscle fatigue was common (39%) and that 43% of COVID-19 survivors experienced symptoms of depression. Additionally, diffusion impairment on spirometry and abnormal computed tomography (CT) findings were observed in 14.3% and 25.4% of subjects, respectively.
There is, therefore, a need for multidisciplinary care for COVID-19 survivors [6], as the long-term sequelae of COVID-19 may place a significant burden on the healthcare system [12]. Although there are growing concerns regarding the long-term health outcomes for COVID-19 survivors, these consequences remain largely unknown. Therefore, we aimed to identify changes in COVID-19-related symptoms and pulmonary sequelae using spirometry, chest CT and neutralizing antibody measurements in COVID-19 patients after discharge.
METHODS
Study design and patients
This study primarily involved patients who were hospitalized for COVID-19 between February 2020 and February 2021. Among this population, those who had at least one outpatient follow-up visit after recovery from COVID-19 were included in this study. At the outpatient visit, residual symptom investigations, chest CT scans, pulmonary function tests (PFT), and neutralizing antibody tests were performed, and each was compared with the results of testing at the time of COVID-19 (except for PFT). The study period was from January 11 to March 9, 2021. This study is generally a cross-sectional study. However, some data were collected retrospectively, especially from patients who had already had follow-up outpatient visits before the study period. The study subjects were recruited from seven university hospitals in Korea (four in Seoul, one in Cheonan, one in Gwangju, and one in Daegu). Written informed consent was obtained from all study participants, and the Institutional Review Board of Chung-Ang University Hospital approved the study protocol (IRB No. 2010-014-437).
Retrospective data collection and definitions
Clinical data during hospitalization were obtained from electronic medical records including demographic information (age and sex), clinical characteristics (comorbidities, symptoms, and symptom onset time), and treatment regimen (corticosteroids, remdesivir, kaletra, antibiotics, anticoagulation, and vasopressor). Based on the World Health Organization’s clinical progression scale [13], COVID-19 severity was defined as follows: Scale 3 (hospitalized patients not requiring supplemental oxygen); Scale 4 (hospitalized patients requiring supplemental oxygen by mask or nasal prongs); Scale 5 (hospitalized patients requiring high-flow nasal cannula or non-invasive ventilation); and Scale 6 (hospitalized patients requiring intubation and mechanical ventilation). For our study, the low- and high-severity groups contained patients with severity scales of 3–4 and 5–6, respectively.
Investigation of residual symptoms
Patients who had follow-up outpatient visits during the study period filled out a questionnaire. The questionnaire was divided into three categories: COVID-19 symptoms, miscellaneous symptoms, and socioeconomic problems. The detailed questions are described in Appendix 1. If a patient who already had a follow-up outpatient visit before the study period, residual symptoms were investigated based on the medical records of the outpatient visits.
Chest CT scan
Patients who had follow-up outpatient visits during the study period underwent a high-resolution CT (HRCT) of the lungs. Any HRCT images taken before the study period at each hospital were sent to and scored by a radiologist at Chung-Ang University Hospital. For the CT score, each of the five lung lobes was scored from 0 to 5 based on the extent of involvement, as follows: 0 (no involvement), 1 (< 5% involvement), 2 (5%–25% involvement), 3 (26%–49% involvement), 4 (50%–75% involvement), and 5 (> 75% involvement). The total CT score consisted of the sum of each lobar score (ranging from 0 to 25) [14]. We classified patients with CT scores of 0–3 into the low-CT score group and those with CT scores of 4–10 into the high-CT score group.
Pulmonary function test
Patients who had follow-up outpatient visits during the study period underwent PFT. No PFTs were performed before the study period because they could not be safely performed during the acute infectious period due to problems of transmission through the measuring equipment. Spirometry was performed according to the guidelines set out by the American Thoracic Society/European Respiratory Society [15]. We measured forced expiratory volume in 1 second (FEV1), forced vital capacity (FVC), and diffusing capacity for carbon monoxide (DLCO). Spirometry results were expressed as a percentage of the measured to the predicted values.
SARS-CoV-2 antibody test
Blood samples were obtained to measure the SARS-CoV-2 antibody titers for patients who had follow-up outpatient visits during the study period. Anti-receptor binding domain (RBD) antibodies against the RBD of the SARS-CoV-2 spike protein were detected using an enzyme-linked immunosorbent assay (ELISA). We used a microneutralization assay to measure neutralizing antibodies against SARS-CoV-2, with the neutralizing antibodies titrated on Vero cells and observed a cytopathogenic effect after 72 hours. A detailed description of the test method is presented in the cited study [16]. Because some patients had serum samples stored from another study before the study period, any stored samples were tested with those collected during the study period.
Statistical analysis
Categorical variables were presented as numbers (percentages) and continuous variables were presented as medians (interquartile ranges [IQRs]). Either the Pearson’s chi-square test or Fisher’s exact test was used for categorical data, while the Mann-Whitney U test was used to compare continuous variables. A one-sample Wilcoxon test was used to check whether the CT score decreased with time after symptom onset. The null hypothesis was defined as a median ratio of the preceding CT score to the subsequent CT score being greater than 1, with a median ratio of less than 1 being defined as the alternative hypothesis. If the p value is < 0.05, the null hypothesis can be rejected, meaning that the CT score decreases with time. The correlation between CT scores with pulmonary functions was evaluated by Spearman’s correlation analysis. All statistical analyses were performed using GraphPad version 9.2.0 (GraphPad Software, La Jolla, CA, USA), with p values of less than 0.05 considered statistically significant.
RESULTS
Baseline characteristics
Between February 2020 and February 2021, 1,665 patients were hospitalized at the study hospitals, of whom 1,586 were discharged, and 79 died (in-hospital mortality rate of 4.7%). Of the 1,586 patients, investigations of residual symptoms, chest CT scans, PFTs, and neutralizing antibody tests were performed in 84 (5.3%), 35 (2.2%), 31 (2.0%), and 27 (1.7%) cases, respectively. Supplementary Tables 1 and 2 and Supplementary Figs. 1 and 2 show the study process, test date, and the number of tests. The baseline characteristics of the 84 participants were as follows: median age 64 years (IQR, 55 to 70) with 59.5% (n = 50) male; 48.8% (n = 41) used corticosteroids; 32.1% (n = 27) did not requiring supplemental oxygen, 35.7 (n = 30) required supplemental oxygen, 20.2% (n = 17) required high-flow nasal cannula, and 11.9 (n = 10) required mechanical ventilation.
Residual symptoms after COVID-19
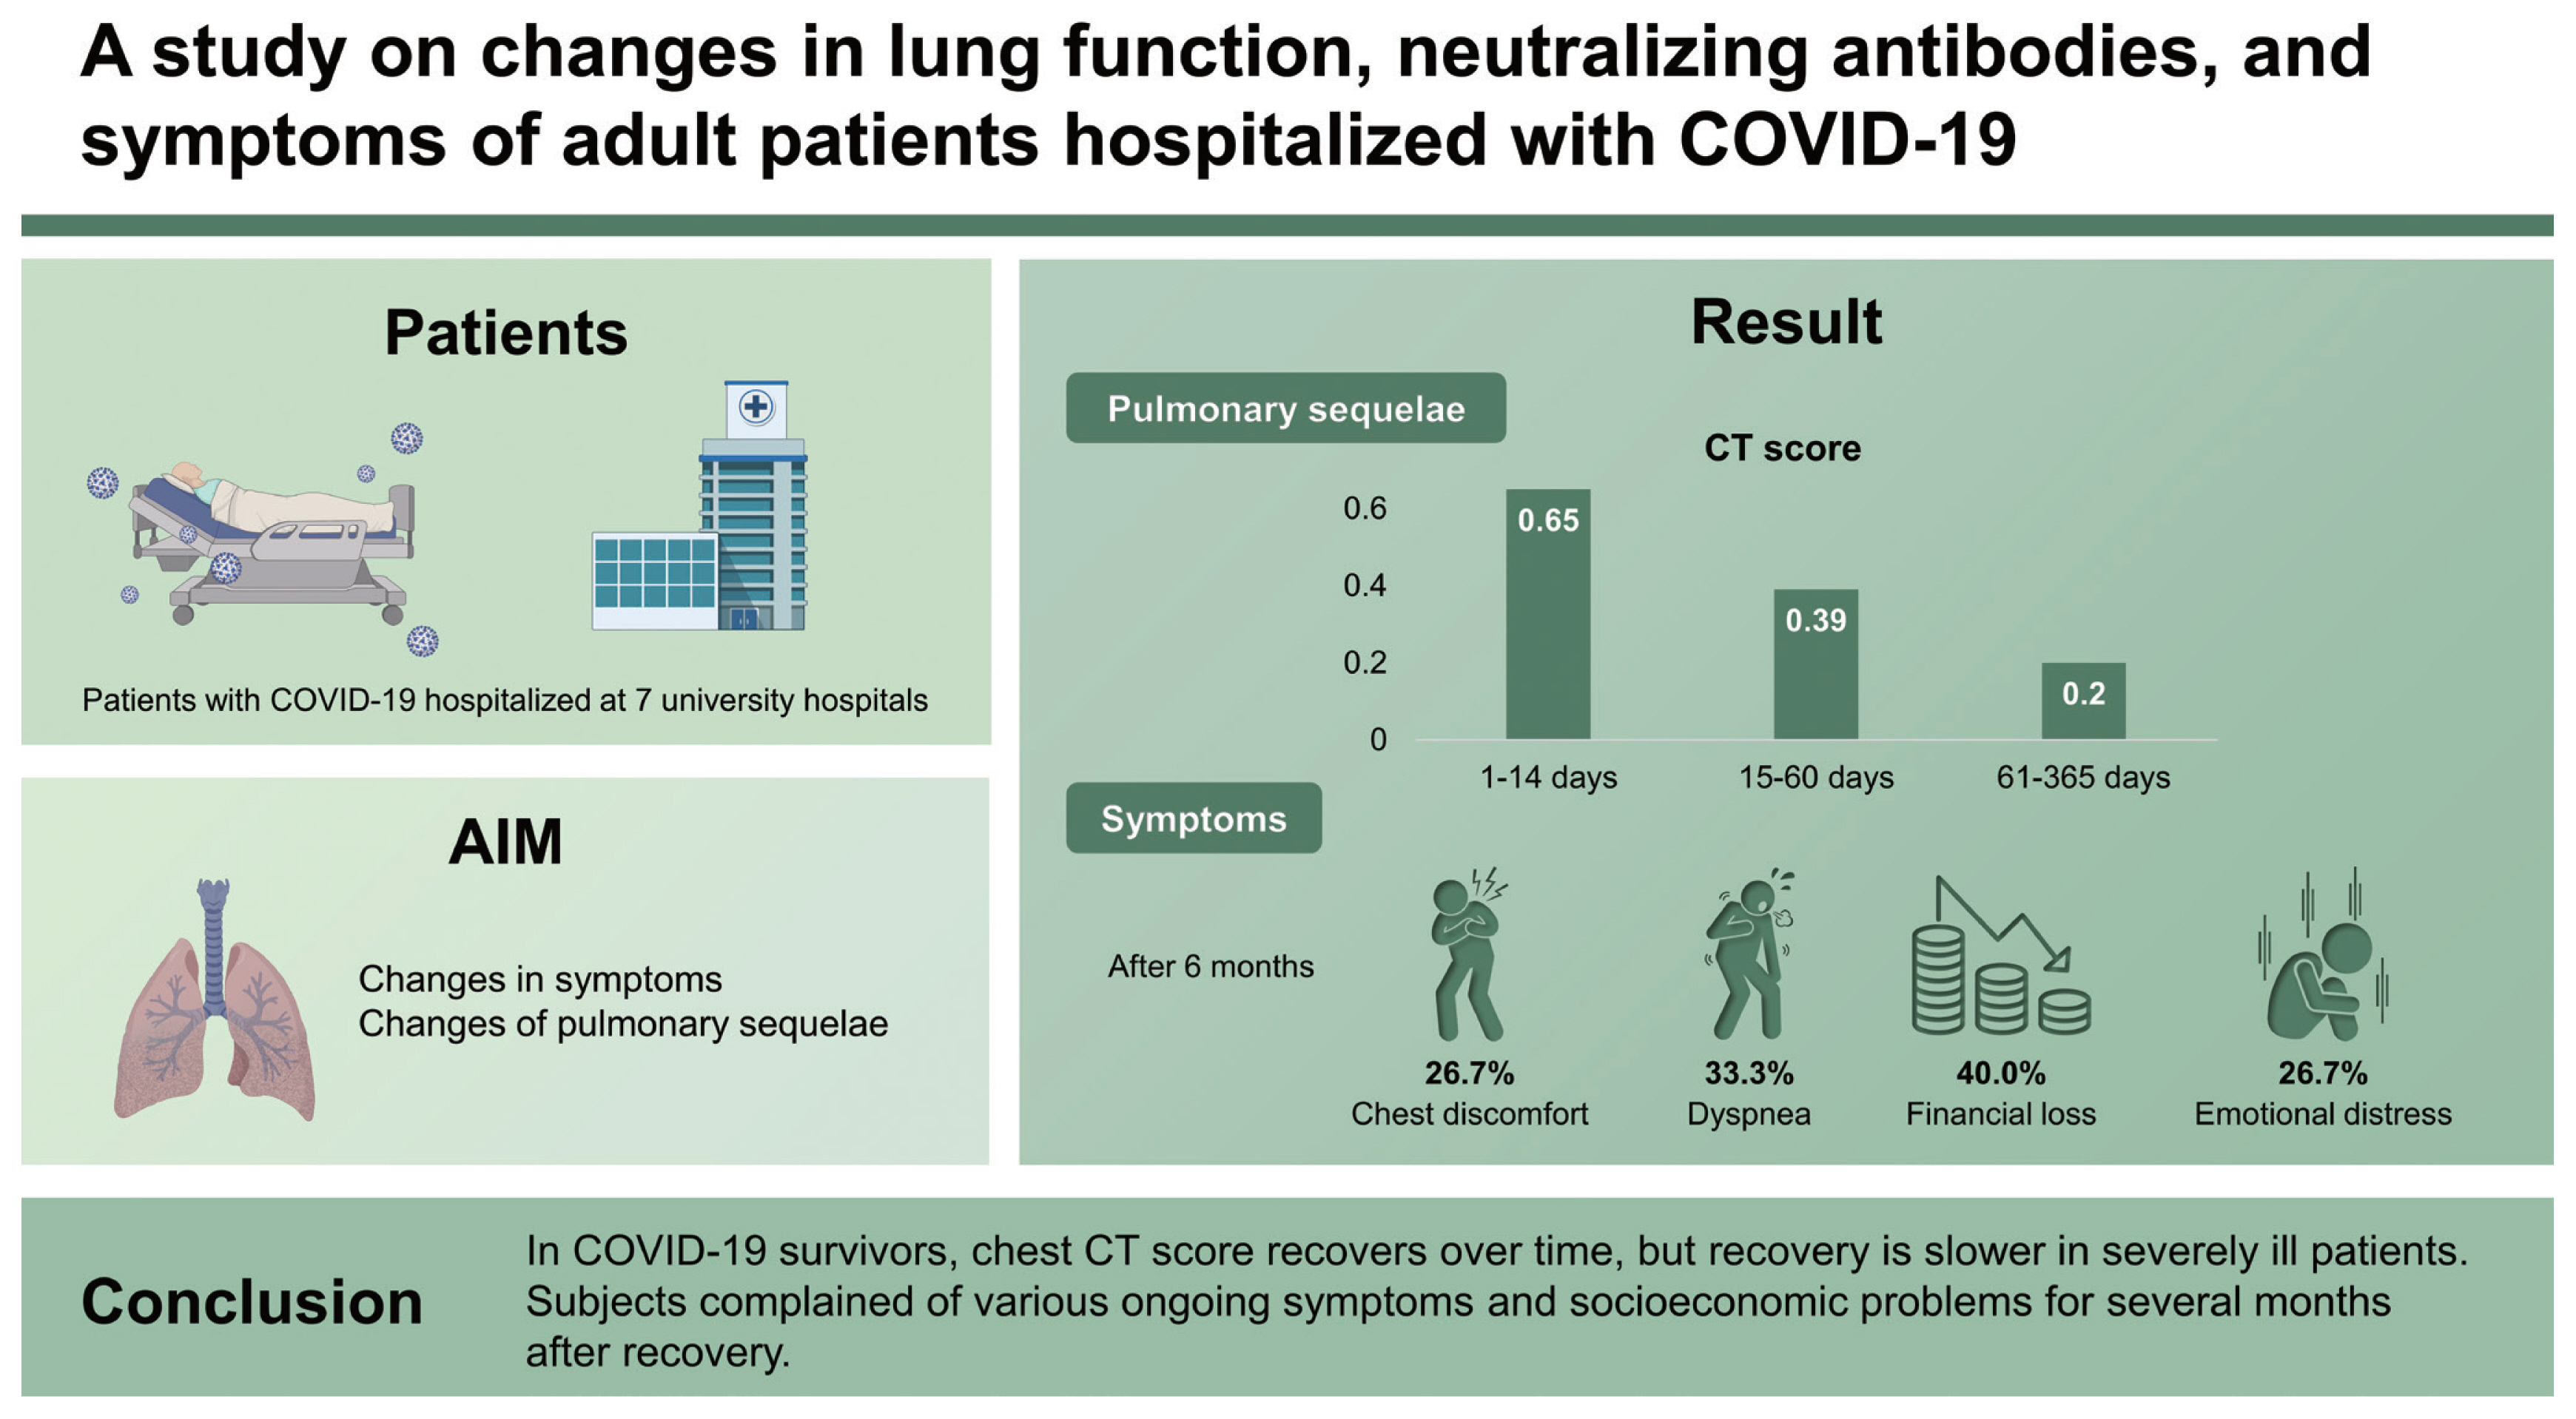
An investigation of residual symptoms after COVID-19 is presented in Table 1. Of the 84 patients who participated in the investigation, 72 were investigated once and 12 were studied twice. In the periods of 20–90, 91–180, and 181–360 days after the onset of symptoms, 45, 36, and 15 patients were investigated, respectively. Acute symptoms such as cough, sputum, myalgia, fatigue, nausea or vomiting, and diarrhea are rarely observed after 6 months. However, lung-related symptoms such as chest discomfort and dyspnea were observed in 20% to 30% of cases, even after 6 months. Dermatologic symptoms such as rash, urticaria, and hair loss were observed in 10% to 30% of subjects after 6 months. The proportion of participants who complained of socioeconomic problems did not decrease over time. Even after 6 months, 40.0% (6/15) and 26.7% (4/15) of patients experienced financial loss and emotional distress, respectively.
Changes in chest CT score
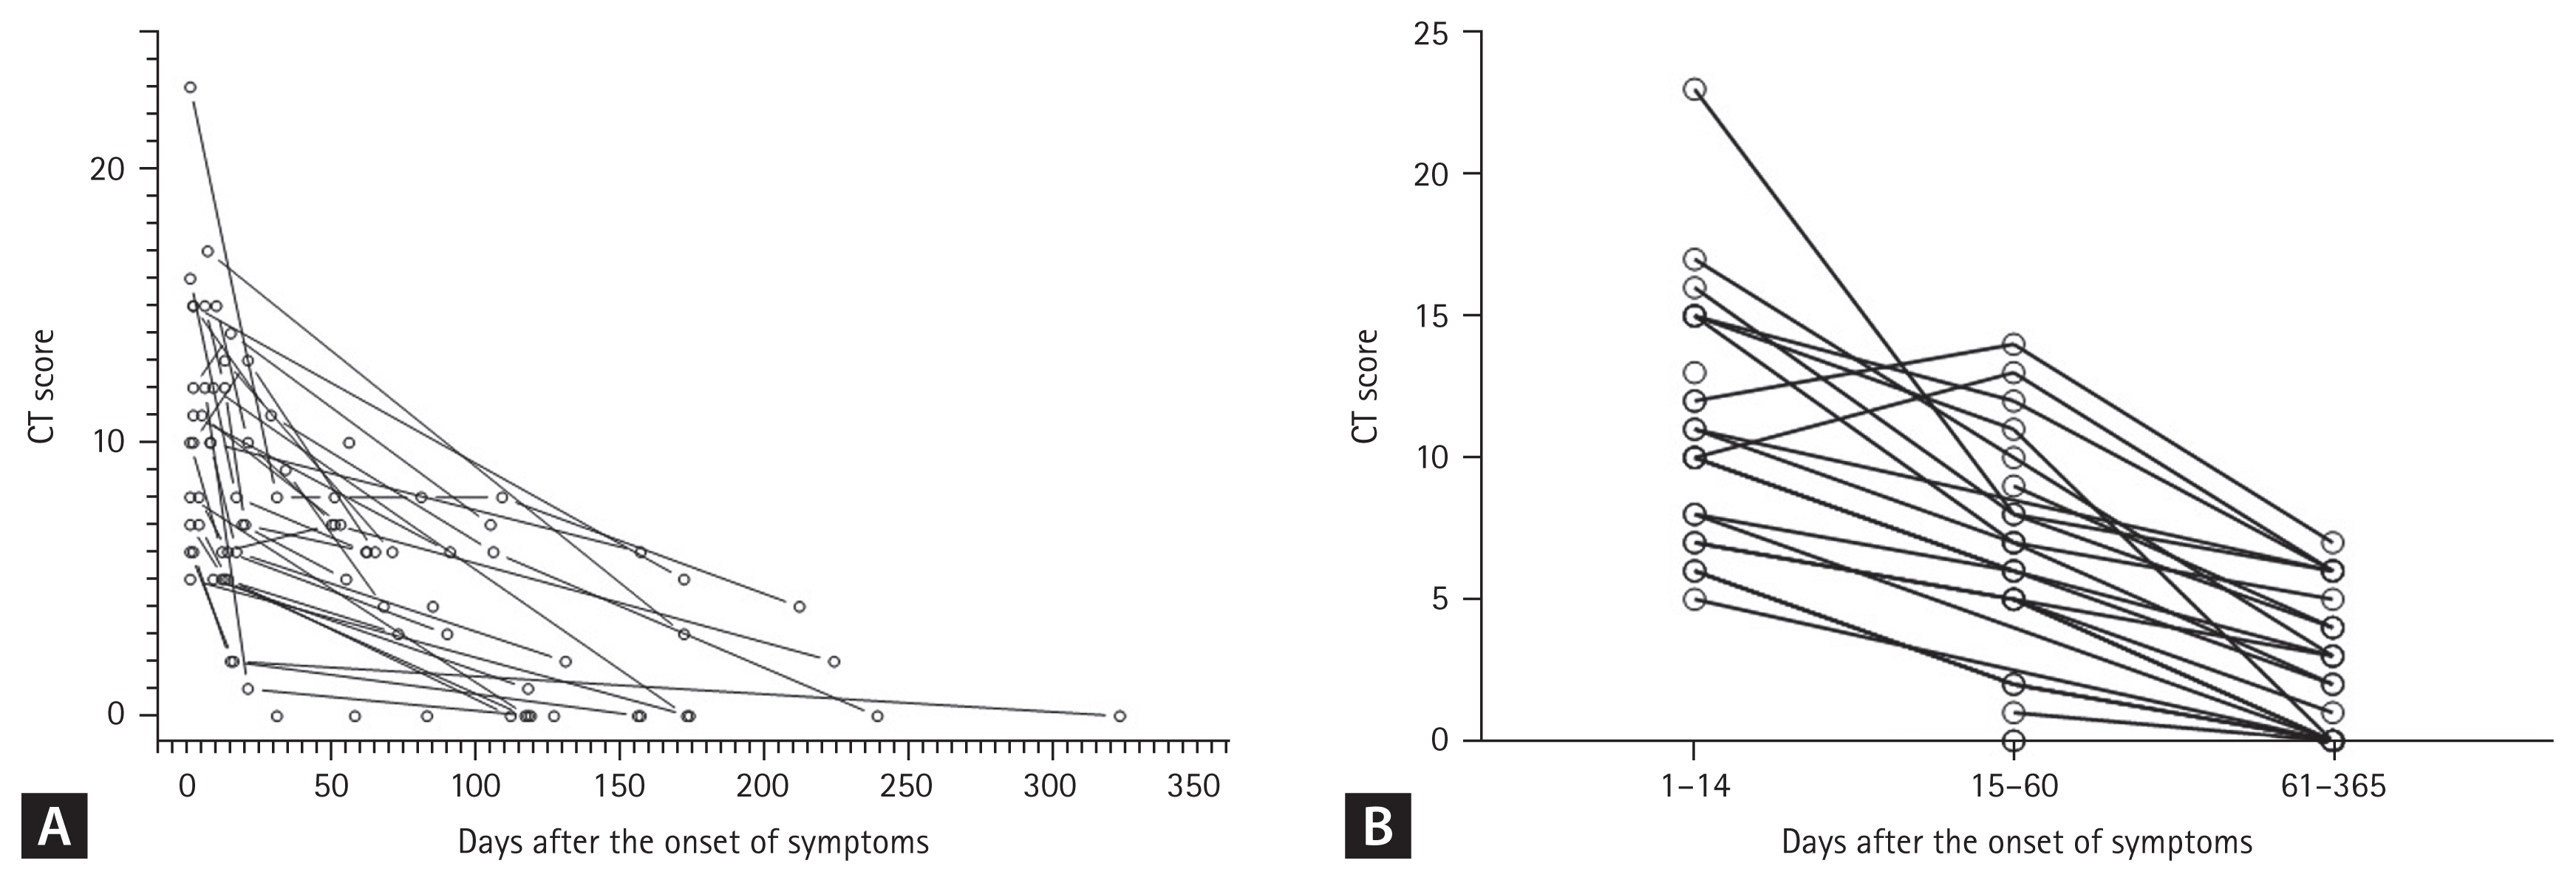
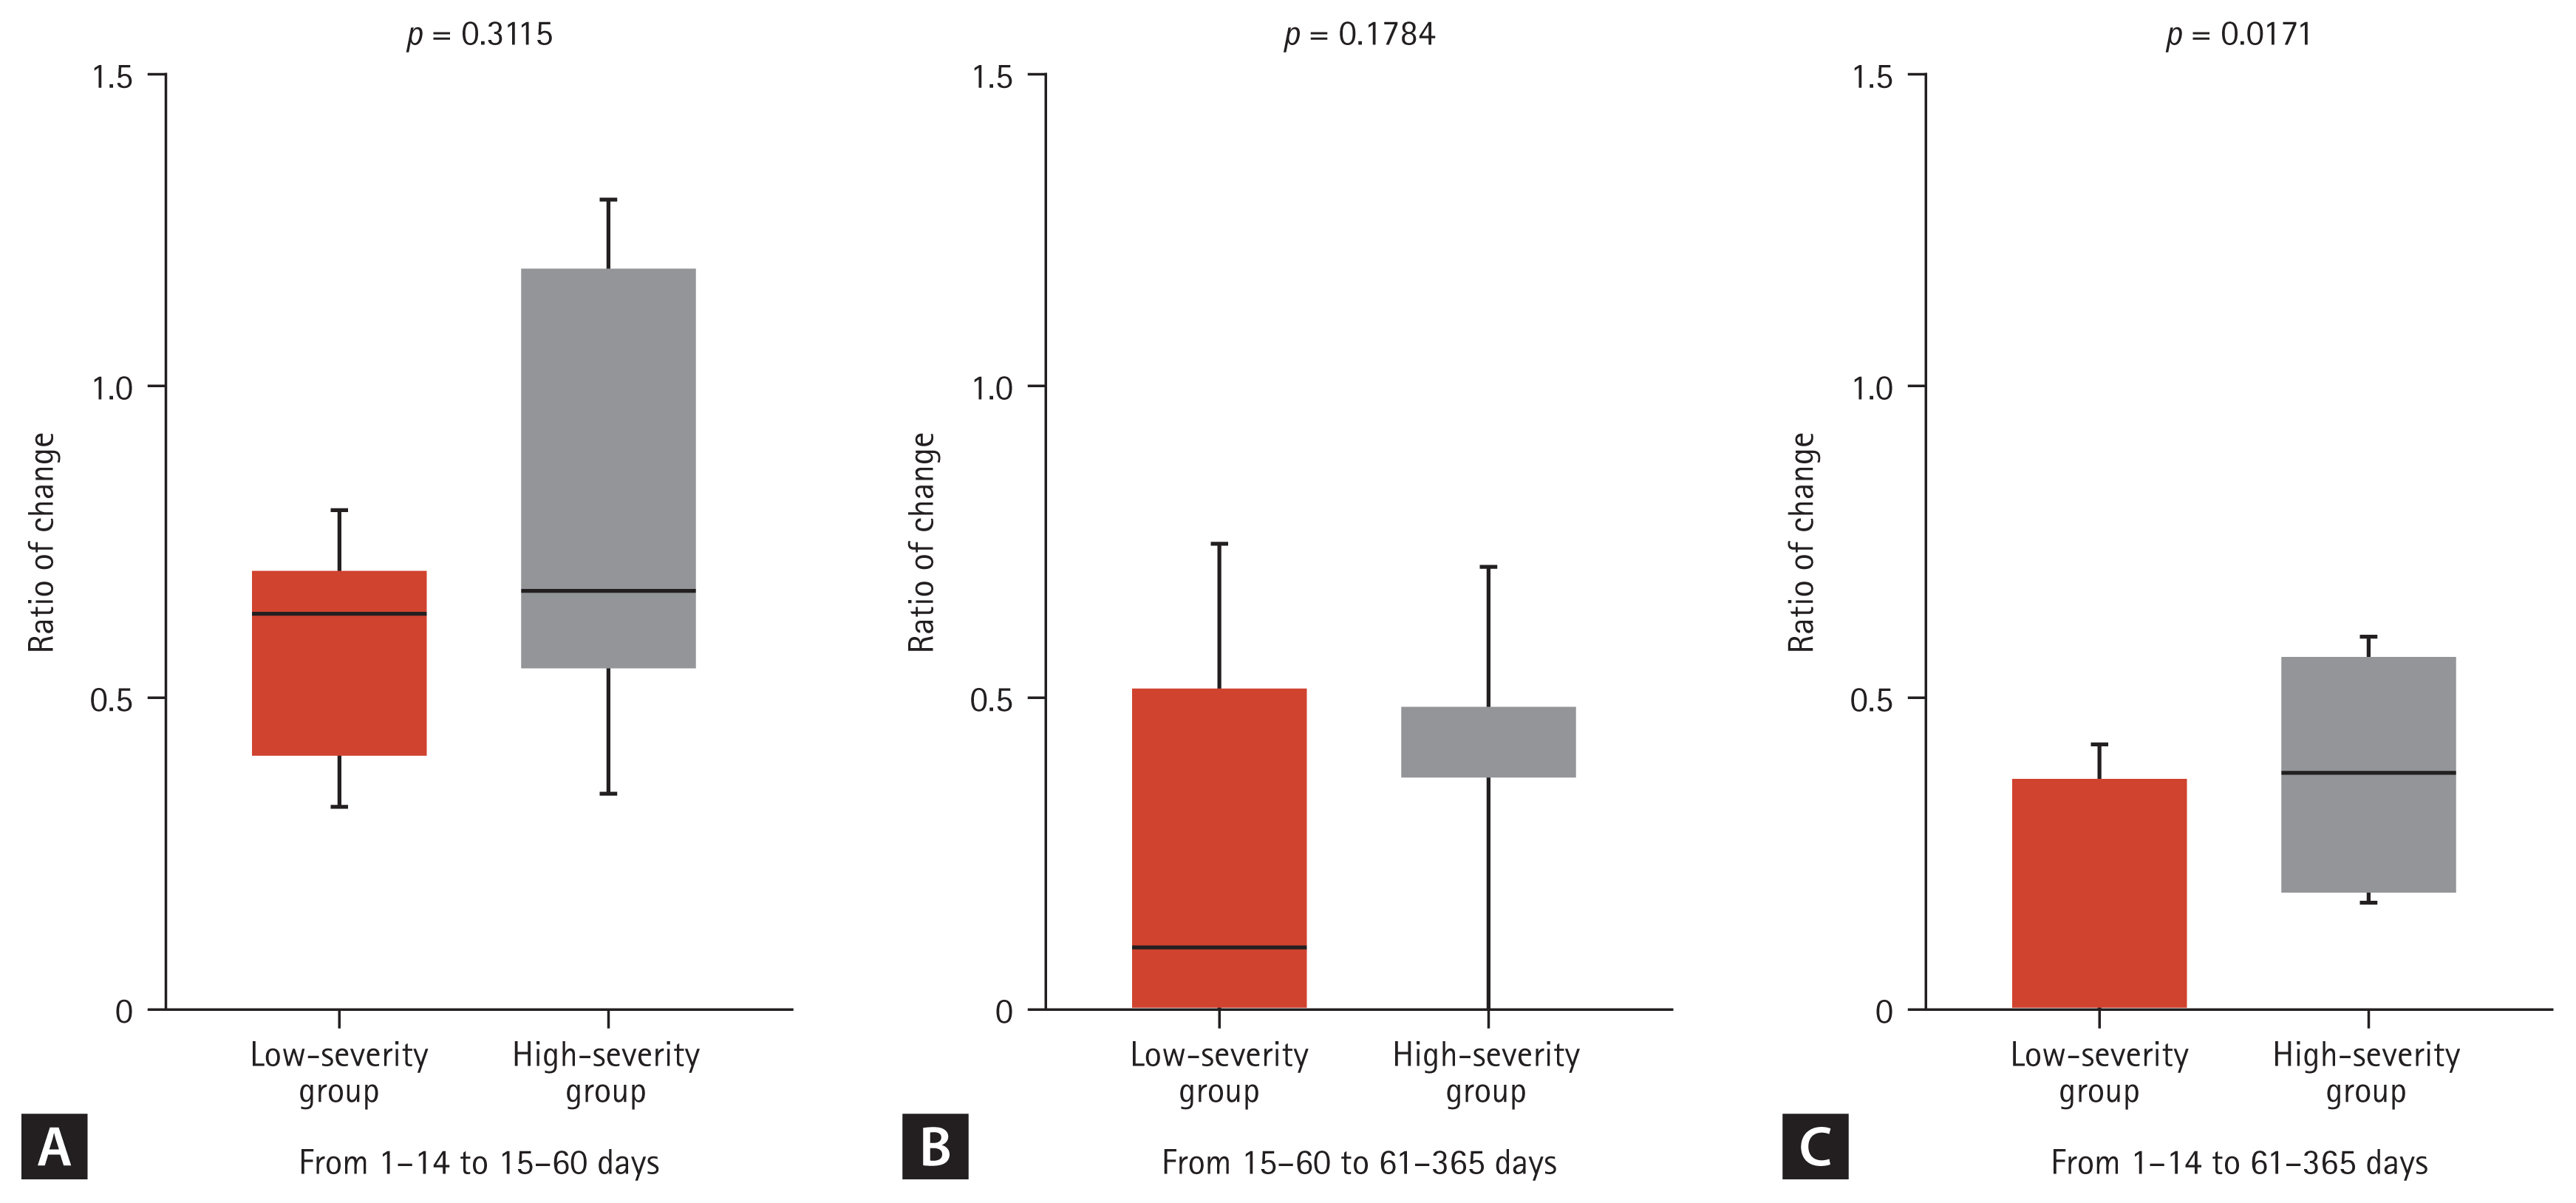
The baseline characteristics of the 35 subjects who underwent HRCT are presented in Table 2. In total, 15 had severity scales of 5–6 (high-severity group). There were no significant differences in age between the high- and low-severity groups (p = 0.064). However, hypertension was significantly more common in the high-severity group compared with the low-severity group (64.3% vs. 15.0%, p = 0.005) (Table 1). The overall median CT score was 6 (IQR, 2.5 to 10), with the high-severity group having a higher median CT score than the low-severity group (8 [IQR, 5.75 to 10.25] vs. 5 [IQR, 0 to 8], p = 0.010). The distribution of CT scores over time after the onset of symptoms is shown in Fig. 1A. To identify the change in CT score over time, the CT score was rearranged into 1–14, 15–60, and 61–365 days after the onset of symptoms (Fig. 1B). We calculated the ratio of changes in CT values between intervals for each patient and obtained the following median values of the ratio of change: 0.65 (the ratio of CT scores at 15–60 to 1–14 days; p = 0.003), 0.39 (the ratio of CT scores at 61–365 to 15– 60 days; p = 0.0002), and 0.20 (the ratio of CT scores at 61–365 to those in 1–14 days; p = 0.0003). These values indicate that the CT score decreases with time. When the ratio of change is divided by severity group, the value of the low-severity group is lower than the high-severity group (Fig. 2). The high-severity group showed a smaller decrease in CT score over time compared with the low-severity group (0.64 vs. 0.68 in Fig. 2A, p = 0.3115; 0.10 vs. 0.48 in Fig. 2B, p = 0.1784; 0.00 vs. 0.38, p = 0.0171), suggesting that the recovery was slower in the high-severity group.
Relationship between chest CT scores and PFT results
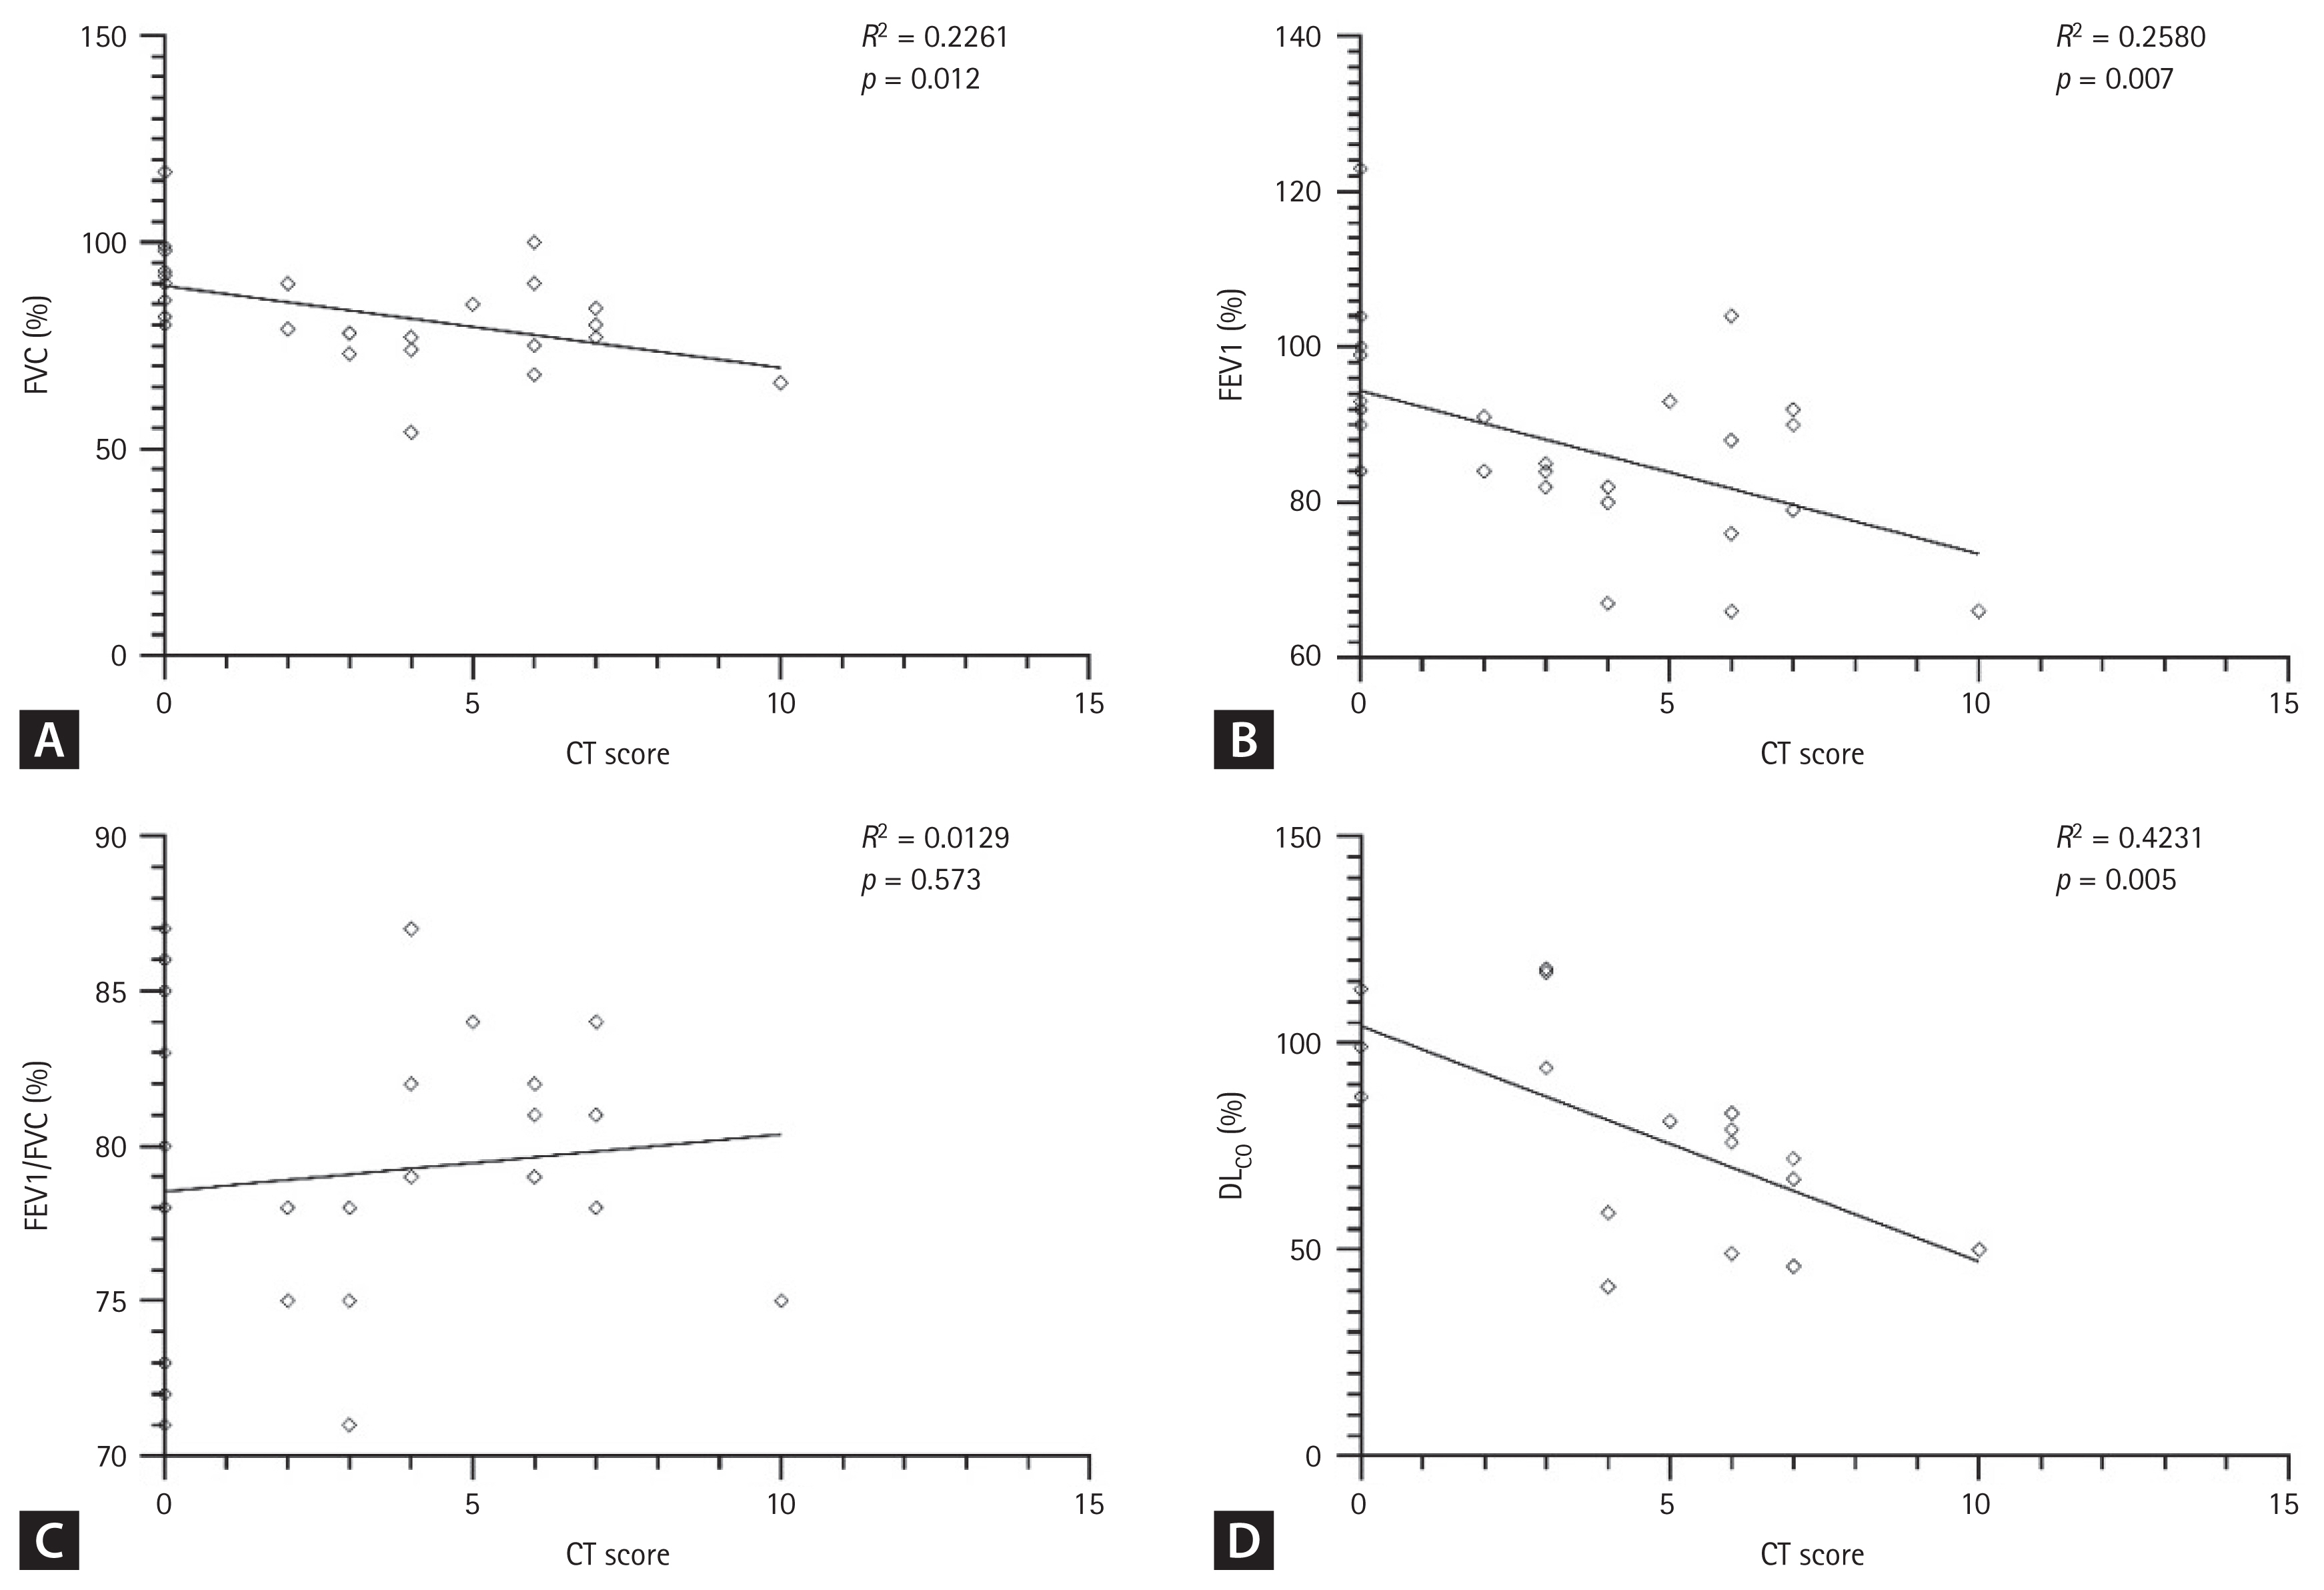
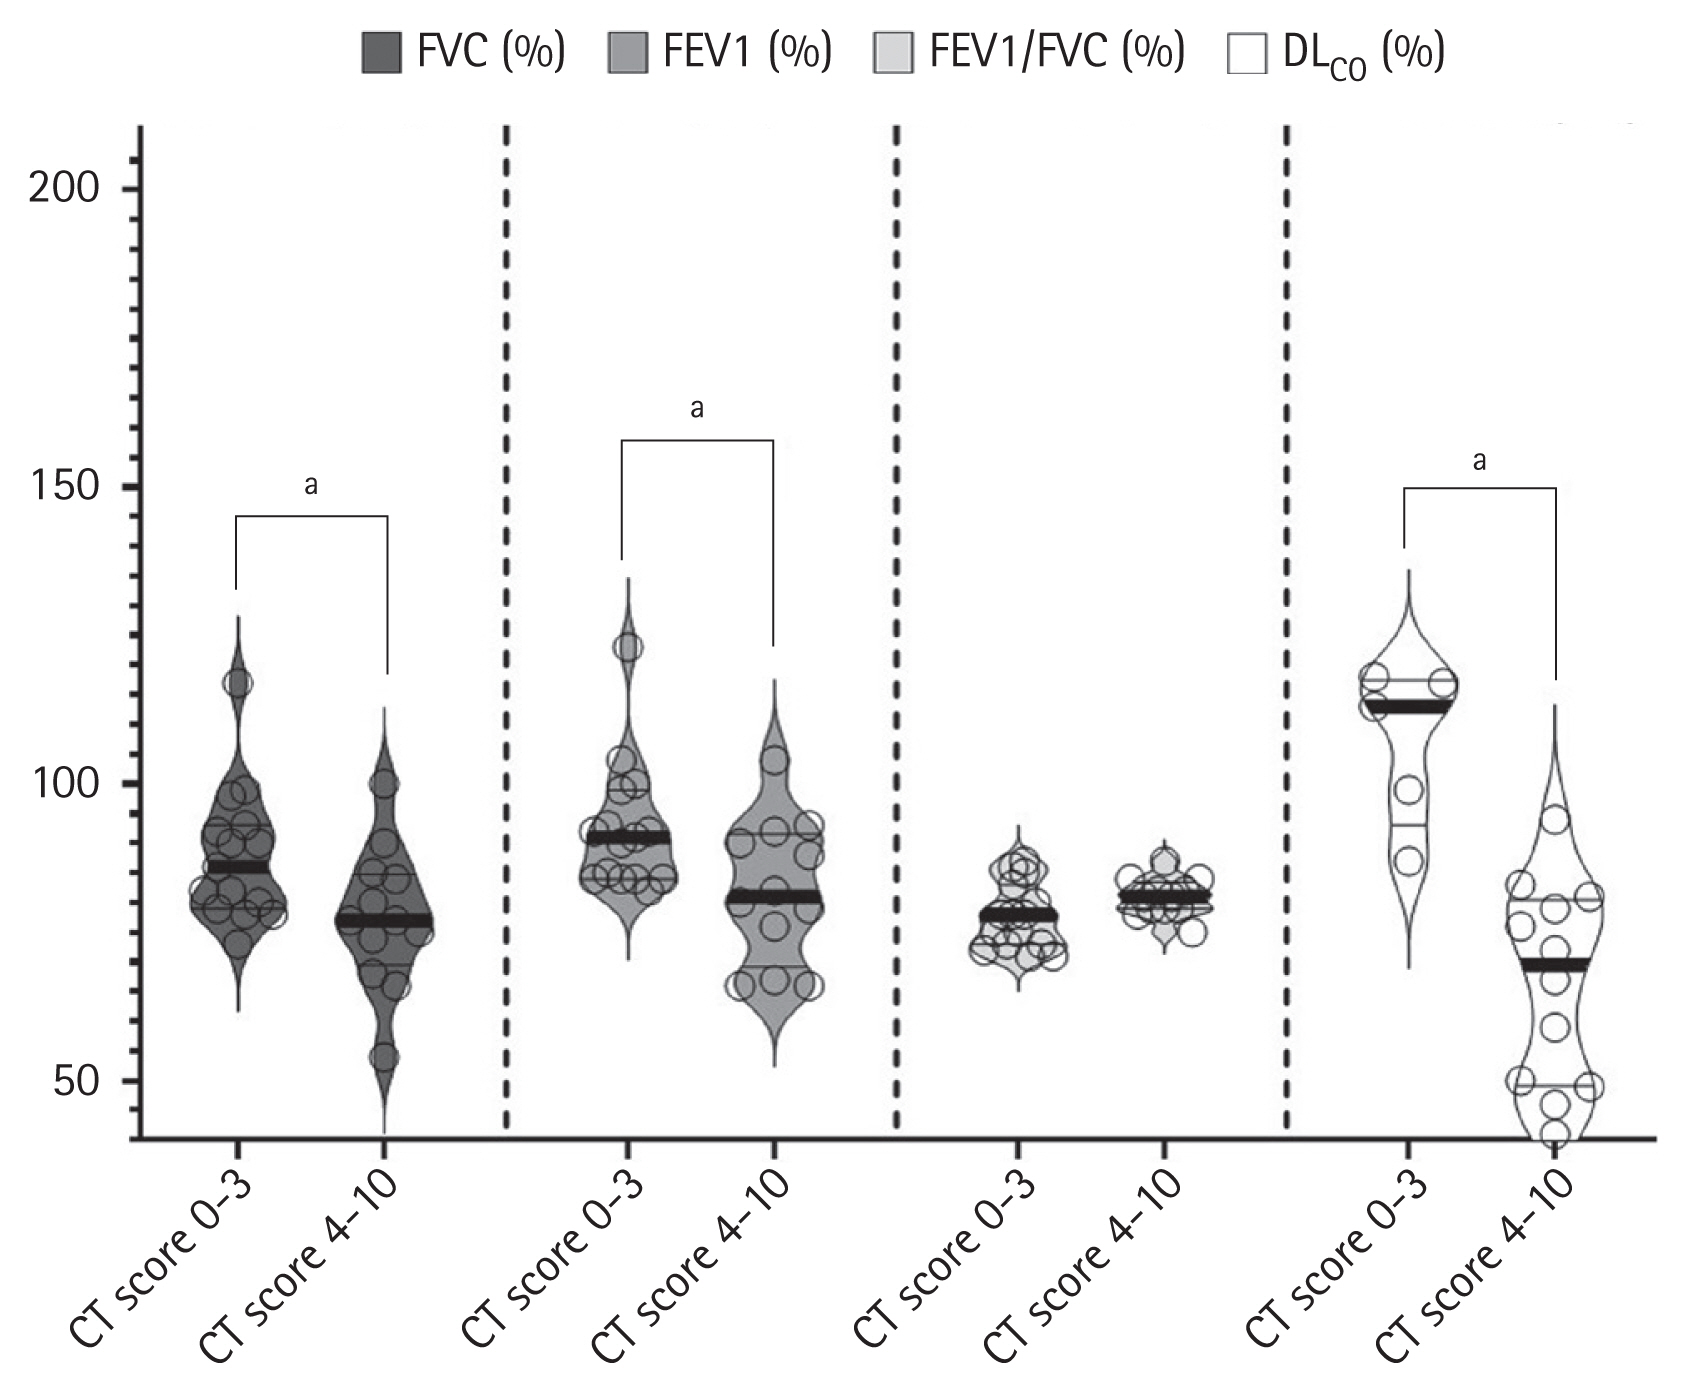
The results of the Spearman’s correlation analysis for the CT scores and PFTs are presented in Fig. 3. Both FVC (R2 = 0.2261, p = 0.012), FEV1 (R2 = 0.2580, p = 0.007), and DLCO (R2 = 0.4231, p = 0.005) were significantly negatively correlated with CT scores. Compared with the low-CT score group, the high-CT score group showed significantly lower FVC (77% vs. 86%, p = 0.031), FEV1 (81% vs. 91%, p = 0.024), and DLCO (69.5% vs. 113%, p < 0.001) values (Fig. 4).
Change of SARS-CoV-2 antibody
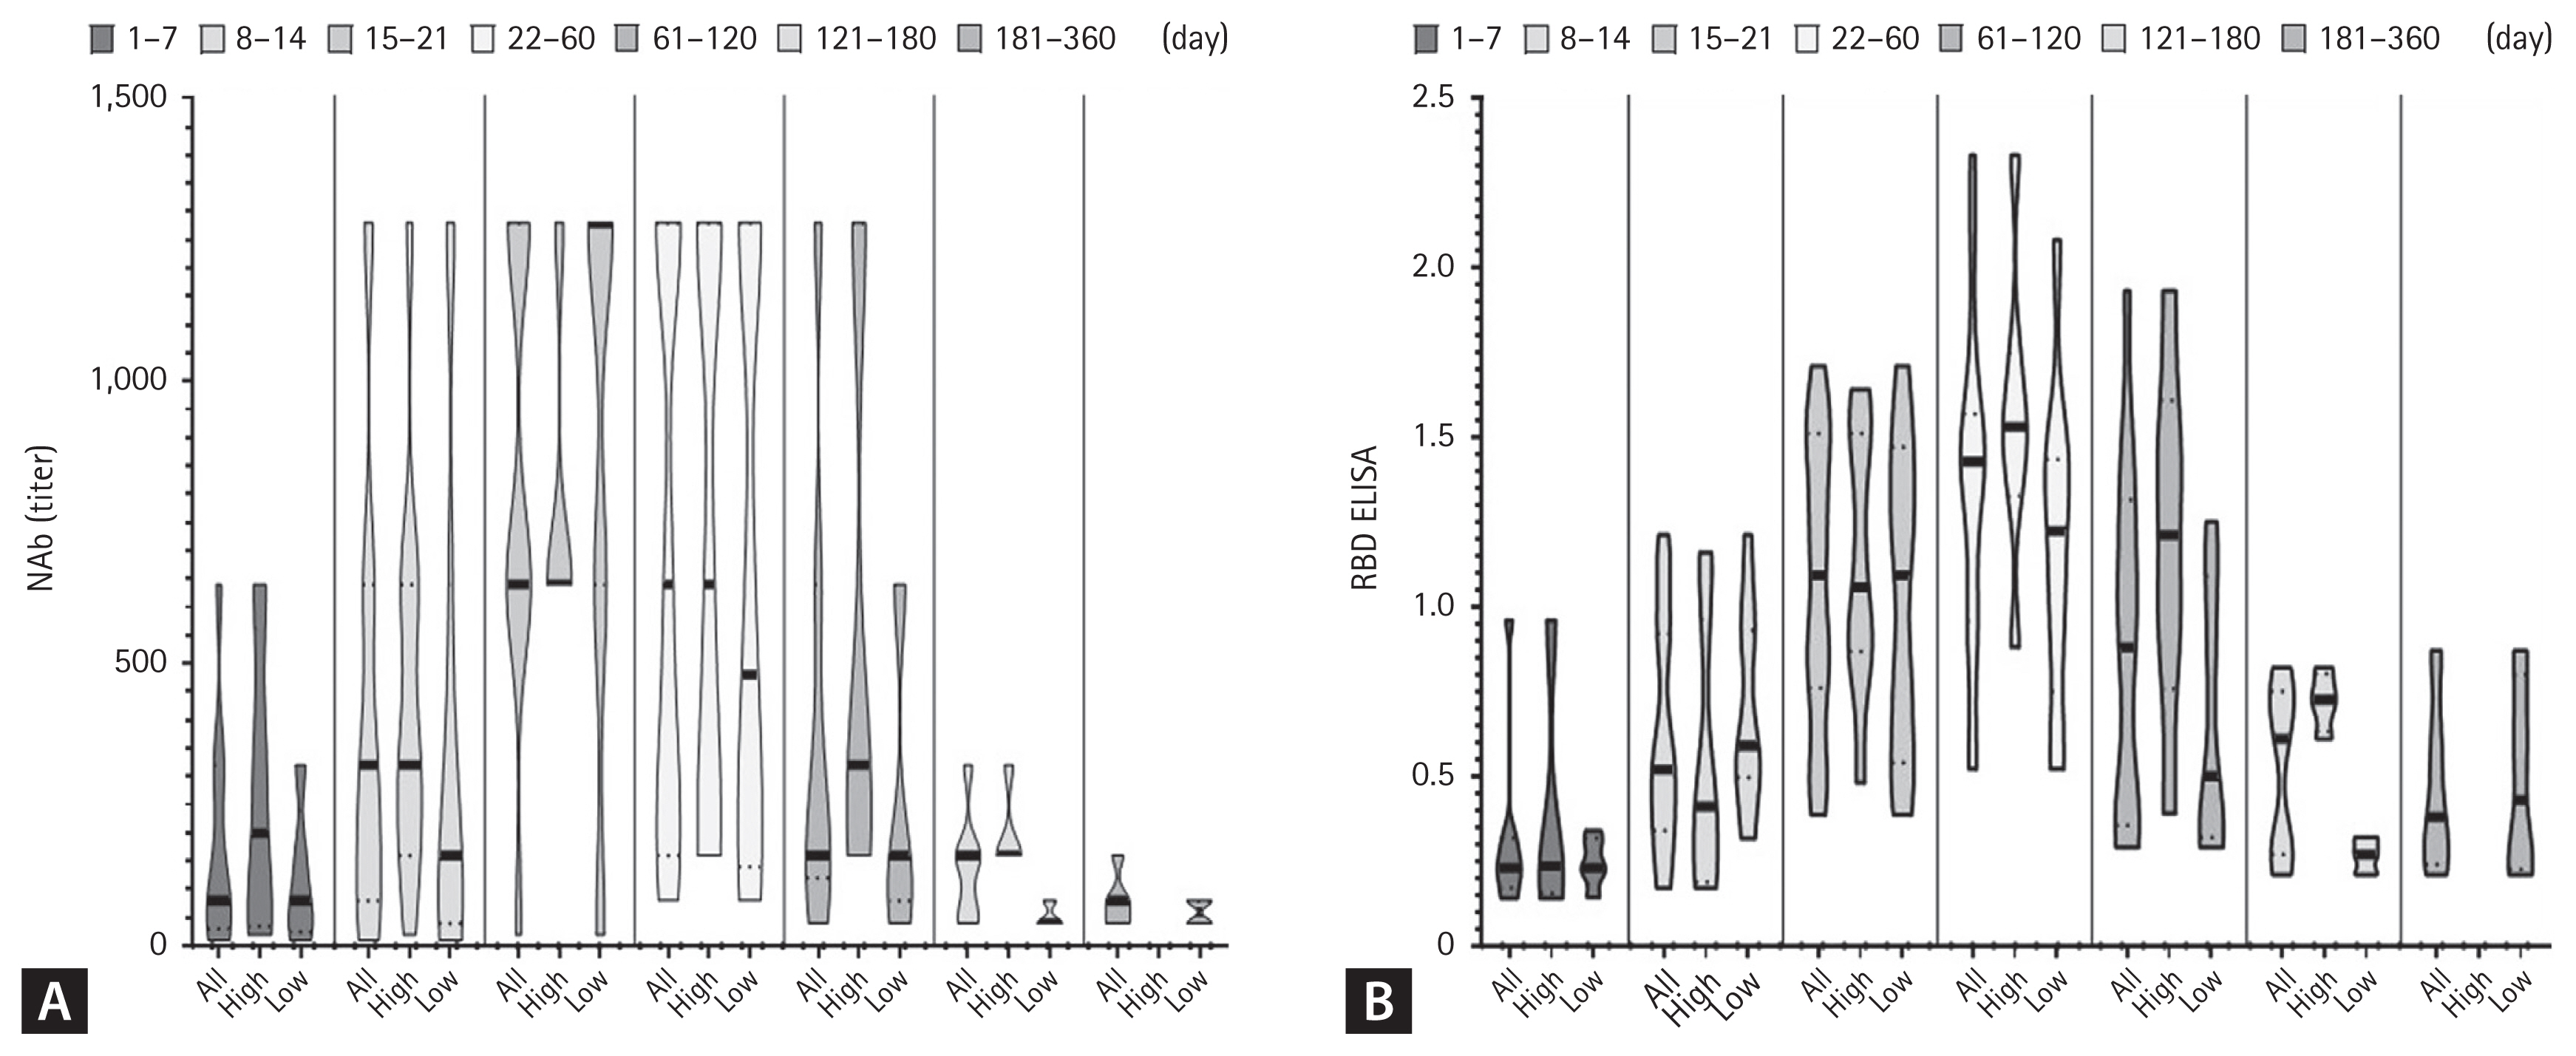
SARS-CoV-2 antibody tests, including neutralizing antibodies and anti-RBD antibodies, were performed, producing 106 samples from 31 patients. When days elapsed after the onset of symptoms were divided into seven intervals (Fig. 5), the antibody titer was highest in the 22 to 60 days, and began decreasing after 120 days. From 22 to 60 days, anti-RBD antibody (RBD ELISA) titers tended to be higher in the high-severity group than in the low-severity group (1.53 vs.1.23 in 22–60 days, p = 0.0907; 1.21 vs. 0.50 in 61–120 days, p = 0.0688; 0.73 vs. 0.27 in 121–180 days, p = 0.0571), although there was no statistical significance when comparing neutralizing antibody titers.
DISCUSSION
The main symptoms in COVID-19 survivors vary depending on the follow-up period. One month after the onset of symptoms, dyspnea was observed in over 70% of patients [17], while 8.6% of patients had dyspnea, 12.4% had anosmia, and 9.7% had fatigue after 4 months [18]. However, in a 1-year follow-up study, the main symptoms were muscle fatigue and insomnia [9]. Thus, acute COVID-19-related symptoms such as dyspnea remained in the convalescence phase, while persistent constitutional symptoms remained over a more prolonged period. In our study, several study participants reported dyspnea and chest discomfort 6 months after COVID-19 onset. The reason the COVID-19 symptoms continued for a prolonged period in this study is thought to be because only a small number of the total patients that were admitted to the study hospitals were included in this study. It is also possible that those with a relatively severe infection may have been enrolled preferentially. As mentioned earlier, various socioeconomic problems such as relationship severance or job losses persisted after discharge, meaning that socioeconomic support may be needed for COVID-19 survivors.
Several studies have described COVID-19 patients with abnormal CT findings, even after discharge of COVID-19 [10,11,19–23]. Follow-up studies have shown that residual CT abnormalities decrease over time. In a recent 1-year follow- up study, CT abnormalities persisted in 39% of subjects after 3 months, 27% after 7 months, and 25% after 1 year [11]. Total CT scores decreased from 8.2 ± 6.1 (at discharge) to 1.8 ± 3.9 (after 1 year). The residual CT abnormalities are associated with disease severity [11,21,23]. Of mechanically ventilated patients with COVID-19 who underwent 3-month follow-up CT scans, 96% showed abnormality and 91% fibrosis [21]. Huang et al. [23] reported that the median CT scores at a 6-month follow-up were higher in the high-severity group (median score of 5) than in the low-severity group (median score of 3). Consistent with these previous studies, the results of our study revealed that the CT scores steadily decreased over time, with the CT scores in the high-severity group decreasing more slowly than in the low-severity group. However, several unanswered questions remain regarding the long-term burden on the healthcare system, and whether the residual CT abnormalities persist as lung fibrotic changes [24]. Therefore, further studies on the long-term health consequences of COVID-19 are warranted.
Even after recovering from COVID-19, many patients experience poor lung function over a considerable period [9,20,23,25–31]. Abnormal DLCO values, which indicate an impaired diffusing capacity, are particularly prevalent in COVID-19 survivors. DLCO impairment (< 80% of the estimated value) was found in 36% to 58% of the patients after 6 months [30]. However, the proportion of patients with abnormal DLCO gradually decreased over time (33% after 8 months and 15% after 1 year) [9,31].
Owing to the small number of patients whose DLCO was tested, the change in DLCO was not significant in our results. However, Orzes et al. [28] reported a significant correlation between chest CT severity score and DLCO after 6 months (R2 = 0.32, p < 0.01). Our study results showed a negative correlation with the follow-up CT score, particularly for DLCO (% predicted) (R2 = 0.42, p = 0.005). For the relationship between PFT and severity, DLCO after 8 months was negatively correlated with severe illnesses requiring prolonged oxygen therapy [31], which was also consistent with our results. However, Zhao et al. [9] reported that persistent DLCO impairment was 14% after 1 year regardless of the severity of the COVID-19 infection. In addition, a 3-month follow-up study showed no significant association between dyspnea and DLCO impairment [32]. Although there was long-term impaired alveolar diffusing capacity remained, its clinical significance is uncertain. Therefore, further study is necessary regarding persistently impaired lung function.
Neutralizing antibodies decreased markedly 4 months after symptom onset (Fig. 3), which is consistent with the results of a previous study [33]. However, recent studies showed that although neutralizing antibodies decrease, they are can persist for up to 8–10 months [34,35]. It was difficult, however, to demonstrate such long-term results in our study, as the number of samples decreased markedly after 6 months. Additionally, we observed that more neutralizing antibodies were generated and decreased more slowly in cases of severe infection, which was consistent with the results of recent studies [35,36]. To further analyze the possibility of reinfection, follow-up studies on levels of neutralizing antibodies in COVID-19 patients are necessary, as well as in those who were subsequently vaccinated.
To the best of our knowledge, this is the first study in Korea to use long-term data for COVID-19, such as physical symptoms, lung function, chest CT scores, and neutralizing antibodies for SARS-CoV-2 up to 1 year after the onset of symptoms. Nonetheless, it has several limitations. First, due to the retrospective study design, some values were missing, and not all participant could be evaluated. Additionally, pre-COVID-19 baseline PFT could not be assessed. Second, selection bias is a possibility because of the small sample size. Third, the questionnaire was not a continuous follow-up of a single patient recovering from COVID-19 but rather a comparison of the responses of different patients at different times after infection. Moreover, symptoms may not have been described accurately because the questionnaire was based on participants’ responses [37].
COVID-19 is becoming increasingly endemic; hence, the long-term consequences of the disease must be further explored. In COVID-19 survivors, chest CT score, which is related to lung function, recovers over time, but recovery is slower in severely ill patients. The neutralizing antibodies in COVID-19 survivors increased and peaked after 2 months and started to decrease after 4 months. Subjects also complained of various ongoing symptoms and socioeconomic problems for several months after their initial diagnosis. More research is necessary regarding survivors’ COVID-19-related symptoms and pulmonary sequelae.
KEY MESSAGE
1. Chest computed tomography (CT) scores of coronavirus disease 2019 (COVID-19) survivors decreased steadily over time.
2. Pulmonary function and chest CT scores were inversely correlated.
3. COVID-19 survivors complained of various symptoms and socioeconomic problems for several months post-diagnosis.
 PDF Links
 PubReader
 ePub Link
 Full text via DOI
 Download Citation
 Supplement 1
 Print
Print


