Kim, Jeong, Ahn, Kim, Hong, Kim, Cho, Han, and KAMIR-NIH Registry Investigators: Sex differences in long-term clinical outcomes of acute myocardial infarction according to the presence of diabetes mellitus

Abstract

Background/Aims

This study compared long-term clinical outcomes between male and female acute myocardial infarction (AMI) patients with and without diabetes mellitus (DM).

Methods

From November 2011 to December 2015, 13,104 patients with AMI were enrolled in the Korea Acute Myocardial Infarction Registry National Institutes of Health (KAMIR-NIH) (4,458 diabetic patients and 8,646 non-diabetic patients). Propensity score matching (PSM) was used to reduce bias due to confounding variables. Following PSM, 2,046 diabetic patients, 1,023 males (69.8 ± 9.4 years) and 1,023 females (69.9 ± 9.4 years); and 3,412 non-diabetic patients, 1,706 males (70.0 ± 10.4 years) and 1,706 females (70.4 ± 10.8 years) were analyzed. Clinical outcomes were compared between male and female patients with and without diabetes over a 3-year clinical follow-up.

Results

In diabetic patients, mortality (21.1% vs. 21.5%, p = 0.813) and major adverse cardiac events (MACE) (30.6% vs. 31.4%, p = 0.698) were not significantly different between males and females. However, mortality (15.8% vs. 12.0%, p = 0.002) and MACE (20.8% vs. 15.6%, p < 0.001) were significantly higher in male non-diabetic patients than in female non-diabetic patients. The predictors of mortality for both males and females in the diabetic and non-diabetic groups were old age, heart failure, renal dysfunction, anemia, and no percutaneous coronary intervention.

Conclusions

The long-term clinical outcomes in AMI patients with DM did not significantly differ by sex. However, the mortality and MACE in non-diabetic male patients were higher than those in females.

INTRODUCTION

The incidence of disease in Korea has shifted from acute to chronic diseases due to the development of the national economy, improvements in residential environment and nutritional status, and improvement in treatments. Mortality due to cardiovascular disease is steadily increasing, and in 2017, the number of deaths due to cardiovascular disease in Korea was 53,597 per year, accounting for approximately 19% of all deaths [1]. In particular, mortality due to heart disease has continued to increase over the past decade. Diabetes mellitus (DM) is a common chronic disease in Korea’s middle-aged population due to changes in diet and lifestyle. In the 2016 National Health and Nutrition Survey, the prevalence of diabetes in their 40s and 50s was 8.7% and 16.0%, respectively. It can be seen that the diabetes awareness rate over the age of 30 is 73.2%, and in particular, the control rate is 26.8%, which is very low. Therefore, screening the high-risk group for diabetes is an important issue in public health [2].
DM is a major risk factor for cardiovascular disease [35]. In addition, a study on the registration of acute myocardial infarction (AMI) in the United States showed that approximately 40% of AMI patients also have DM [6], while in Koreans, up to 41.8% of AMI patients have DM [7]. Mortality due to heart disease and stroke in diabetic patients is two to four times higher than that in non-diabetic patients, while previous studies have also found that mortality in diabetic patients with AMI is higher than that in non-diabetic patients with AMI [810].
The Atherosclerosis Risk in Communities (ARIC) studies of large numbers of people resulted in a total of 4.6% cardiac death or AMI [11]. The incidence of cases varied depending on the presence of DM and the history of AMI: 3.9% had no DM and no history of AMI, 10.8% had DM but no history of AMI, 18.9% had a history of AMI without DM, and 32.2% had DM and a history of AMI. The relationship between DM and AMI also differs by sex. When diabetic patients with coronary artery disease in Finland were compared by sex, the mortality rate due to cardiovascular disease higher in males than in females [12]. In contrast, in other study, the risk of major clinical events was higher in females than in males [13]. In Europe, the short-term prognosis of AMI patients with diabetes did not differ significantly by sex, but the long-term prognosis was different between males and females [14].
However, few studies have investigated sex-based differences in the long-term outcomes of diabetic patients with AMI in Korea [15], and thus, a long-term observational study is necessary. Therefore, this study aimed to compare the clinical characteristics of diabetic and non-diabetic patients with AMI by sex, registered in the Korea Acute Myocardial Infarction Registry-National Institutes of Health (KAMIR-NIH), and to identify the factors affecting major complications. In addition, this study aimed to provide important data for the treatment and management of diabetic and non-diabetic patients with AMI by examining the long-term clinical follow-up data over 3 years.

METHODS

Study design and population

This study was approved by the Institutional Review Board of Chonnam National University Hospital (CNUH-2020-132). The KAMIR-NIH study was also approved by the Institutional Review Board of Chonnam National University Hospital (CNUH 05-49), and was performed after obtaining consents from all subjects. The study was sponsored by the National Institute of Health as a prospective, multicenter, observational, and web-based cohort study for the development of prognosis and management indicators for patients with AMI, and the patients were registered at 20 major centers in Korea from November 2011 to December 2015.
The 13,104 AMI patients enrolled in KAMIR-NIH were as follows. The diabetic group comprised 4,458 patients, of which 3,106 (62.6 ± 11.4 years) were male, and 1,352 (71.7 ± 9.5 years) were female. The non-diabetic group comprised 8,646 patients, of which 6,579 (60.4 ± 12.4 years) were male, and 2,067 (72.3 ± 11.0 years) were female. Propensity score matching (PSM) was used to reduce bias due to variables. After PSM, of the 2,146 diabetic patients, 1,023 (69.8 ± 9.4 years) were male, and 1,023 (69.9 ± 9.4 years) were female. In the 3,412 non-diabetic patients, 1,706 (70.0 ± 10.4 years) were male, and 1,706 (70.4 ± 10.8 years) were female.

Definition and clinical endpoint

Information on general characteristics, including age, body mass index (BMI), Killip class, history, and smoking rate were collected. The clinical characteristics were recorded following hematological tests and echocardiographic examinations conducted during hospitalization to measure the left ventricular injection fraction (LVEF), while the lesion characteristics in coronary artery angiographic findings were classified using the American College of Cardiology/American Heart Association (ACC/AHA) classification [16]. The perfusion rate through coronary artery lesion was classified as thrombolysis in myocardial infarction (TIMI) flow [17].
Major adverse cardiac events (MACE) were defined as all cause death, recurrent myocardial infarction (MI), repeated percutaneous coronary intervention (PCI), and coronary artery bypass graft (CABG) during 3 years of clinical follow-up.

Statistical analysis

Continuous variables are presented as mean ± standard deviation and were compared using the Student’s t test. Discrete variables are expressed as percentages and frequencies and were compared by chi-square test. PSM analysis was performed using a multiple logistic regression model to minimize the selection bias when comparing the effect of sex. The relevant variables were included age, Killip class, hypertension, dyslipidemia, MI, angina, heart failure, cerebrovascular accident, BMI, smoking, pre-PCI, and post-PCI TIMI flow. The propensity score was calculated using logistic regression and matched one-to-one according to the propensity score value. C-statistic for the propensity score was 0.673. Multiple logistic regression and Cox proportional regression analyses were conducted to identify the independent predictors of 3-year mortality. The results are presented as adjusted hazard ratios with 95% confidence intervals. Kaplan–Meier curves were compared for all cause death and MACE, and the log rank test was used to test the differences in the survival curves.
All analyses were performed using SPSS software version 25.0 (IBM Co., Armonk, NY, USA). All analyses were two-tailed, and p values ≤ 0.05 were considered to be statistically significant.

RESULTS

Baseline characteristics and medication

The age of the female diabetic patients was significantly older than that of the male diabetic patients (62.6 ± 11.4 years vs. 71.7 ± 9.5 years, p < 0.001). The BMI was significantly higher in males than in females, and atypical chest pain and dyspnea were more frequently experienced in females than males. At admission, the Killip class was lower in males than in females. With respect to medical history, hypertension, previous angina, heart failure, and cerebrovascular events were significantly more frequent in females than males; however, smoking rates and incidence of ST segment elevation myocardial infarction (STEMI) were higher in males than in females. The use of clopidogrel, calcium channel blockers (CCB), and angiotensin-reflector blockers (ARB) was significantly lower in males, while the use of prasugrel, angiotensin-converting enzyme inhibitors (ACEI), and statins (p = 0.006) was significantly higher in males than females.
After PSM, the age of the diabetic patients (69.8 ± 9.4 years vs. 69.9 ± 9.4 years, p = 0.737) was not significantly different between males and females. The BMI, Killip class, hypertension, dyslipidemia, previous MI and angina, heart failure, cerebrovascular events, and smoking rates were not significantly different between males and females. The use of aspirin, clopidogrel, prasugrel, ticagrelor, CCB, ARB, and statin at hospitalization were also not significantly different between males and females (Table 1).
The age of the non-diabetic patients was significantly older in females than in males (60.4 ± 12.3 vs. 72.2 ± 11.0, p < 0.001). Systolic blood and diastolic blood pressures were higher in males, while the heart rate was higher in females. BMI was significantly higher in males than in females, and atypical chest pain and dyspnea were more frequently observed in females than in males. At admission, high Killip class, a history of hypertension, heart failure, and cerebrovascular events were more frequently noted in females than in males. Previous MI and smoking rates were significantly higher in males than in females, and STEMI was also more common in male. The use of clopidogrel and ARB was significantly lower in males than in females, while the use of prasugrel, ticagrelor, ACEI, and statin was significantly higher in males than in females.
After PSM, the age of the non-diabetic patients (70.0 ± 10.4 years vs. 70.4 ± 10.8 years, p = 0.296) was not significantly different between males and females. There were no significant differences in BMI, Killip class, hypertension, dyslipidemia, previous MI and angina pectoris, heart failure, cerebrovascular events and smoking rates. Use of aspirin, clopidogrel, prasugrel, ticagrelor, CCB, ACEI, and statin was not significantly different between males and females at hospitalization, although ARB were administered significantly more often in females than in males (Table 2).

Echocardiographic and laboratory findings

In the diabetic group, white blood cell (WBC) and lymphocyte counts and hemoglobin, creatinine, triglyceride, low-density lipoprotein cholesterol (LDL-C), creatine kinase-myocardial band (CK-MB), and troponin I levels were higher in males than in females. Neutrophil and platelet counts, platelet reactivity units (PRU), and high-density lipoprotein cholesterol (HDL-C), brain natriuretic peptide, N-terminal pro-brain natriuretic peptide (NT-proBNP), and glucose levels were significantly lower in males than in females. Although hemoglobin A1C (HbA1c) was found at relatively high levels, there was no significant difference between males and females. On echocardiography, there was no significant difference in the LVEF between males and females.
After PSM, in the diabetic group, hemoglobin, creatinine, and troponin I levels were significantly higher in males than in females, while the neutrophil, platelet count and glucose, total cholesterol, triglyceride, HDL-C, LDL-C, HbA1c, and PRU levels were significantly lower in males than in females (Table 1).
In the non-diabetic group, WBC and lymphocyte counts and hemoglobin, creatinine, CK-MB, troponin I, triglyceride, and high sensitivity C-reactive protein levels were higher in males than in females. Neutrophil and platelet counts and HDL-C, NT-proBNP, glucose, HbA1c, and PRU levels were lower in males than in females. On echocardiography, there was no significant difference in LVEF between males and females.
After PSM, in the non-diabetic group, hemoglobin, creatinine, CK-MB, ARU, and troponin I levels were significantly higher in males than in females, while the platelet counts, total cholesterol, HDL-C, LDL-C, PRU, and HbA1c levels were significantly lower in males than in females. The glucose level was not significantly different between males and females. LVEF was significantly lower in males than in females (Table 2).

Coronary angiographic findings

In the diabetic group, PCI was more frequently performed in males than in females. Left main artery involved lesion and post-PCI TIMI flow 3 were significant higher males than females.
After PSM, in the diabetic group, there were no significant differences in lesion characteristics by the ACC/AHA classification and culprit lesion location. The culprit lesions of left main coronary artery was significantly higher in males (Table 3).
In the non-diabetic group, PCI was more frequently performed in males than in females. There were no significant differences in culprit lesions location and lesion characteristics by the ACC/AHA classification in both males and females. The TIMI III flow was higher in males than female after the procedure.
After PSM, in the non-diabetic group, the ACC/AHA lesion characteristics were significantly different between males and females, with more frequent C types in males. The culprit lesions of left main was significantly higher in males than females (Table 4).

Three-year clinical outcomes

In the diabetic group, over all the 3-year clinical follow-up, all cause death (p < 0.001), cardiac death (p < 0.001), non-cardiac death (p < 0.001), and MACE (p < 0.001) were significantly higher in females than in the males.
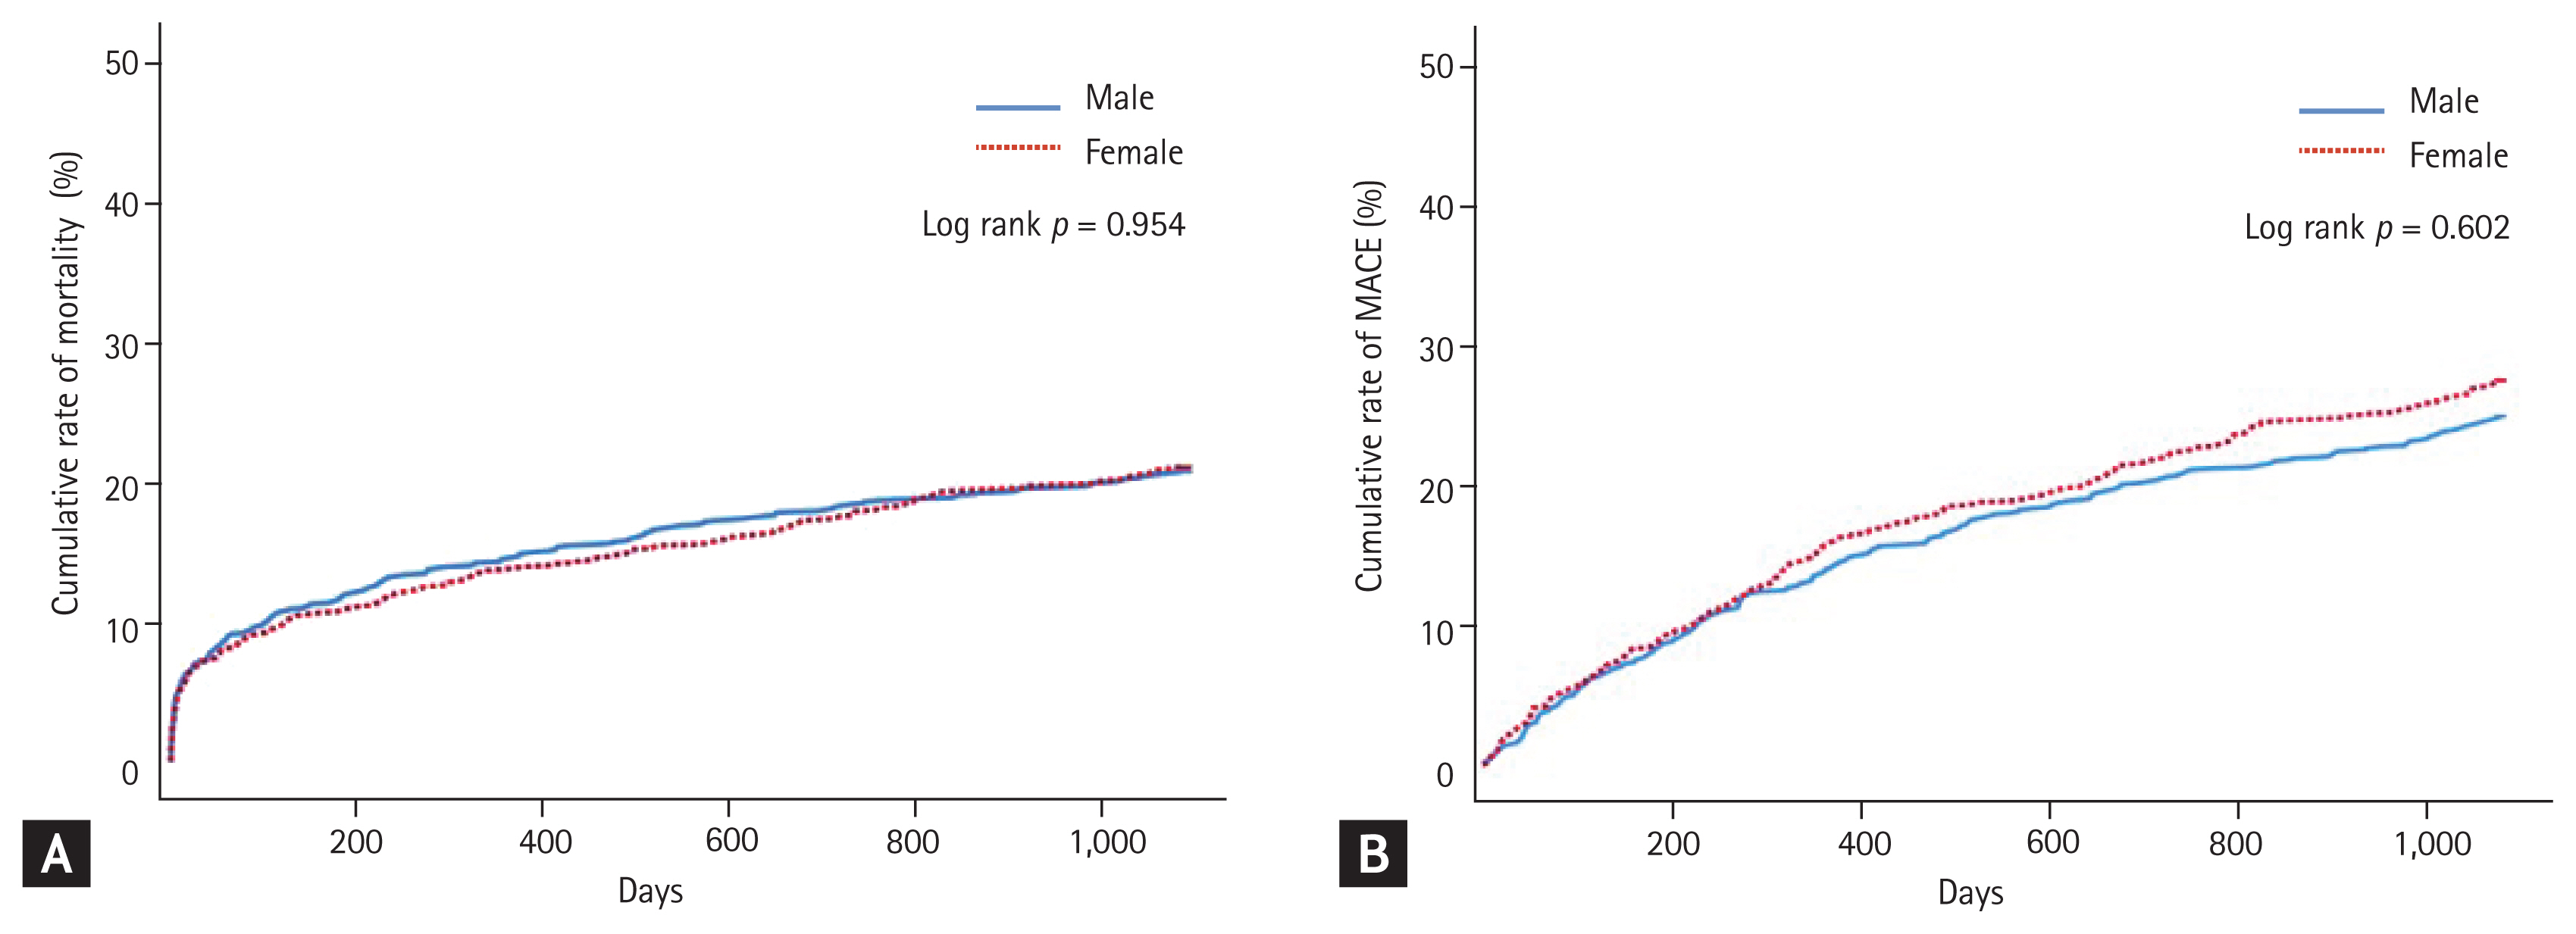
After PSM, in the diabetic group, the all cause death (p = 0.813) and MACE (p = 0.698) were not significantly different between males and females (Table 5). Analysis using Kaplan–Meier survival curves showed no significant difference between mortality and MACE in males and females in the diabetic group (Fig. 1).
In the non-diabetic group, during 3-year follow-up, all cause death (p < 0.001), cardiac death (p < 0.001), non-cardiac death (p = 0.005), MACE (p < 0.001), and repeat PCI (p = 0.002) were significantly higher in females than in males.
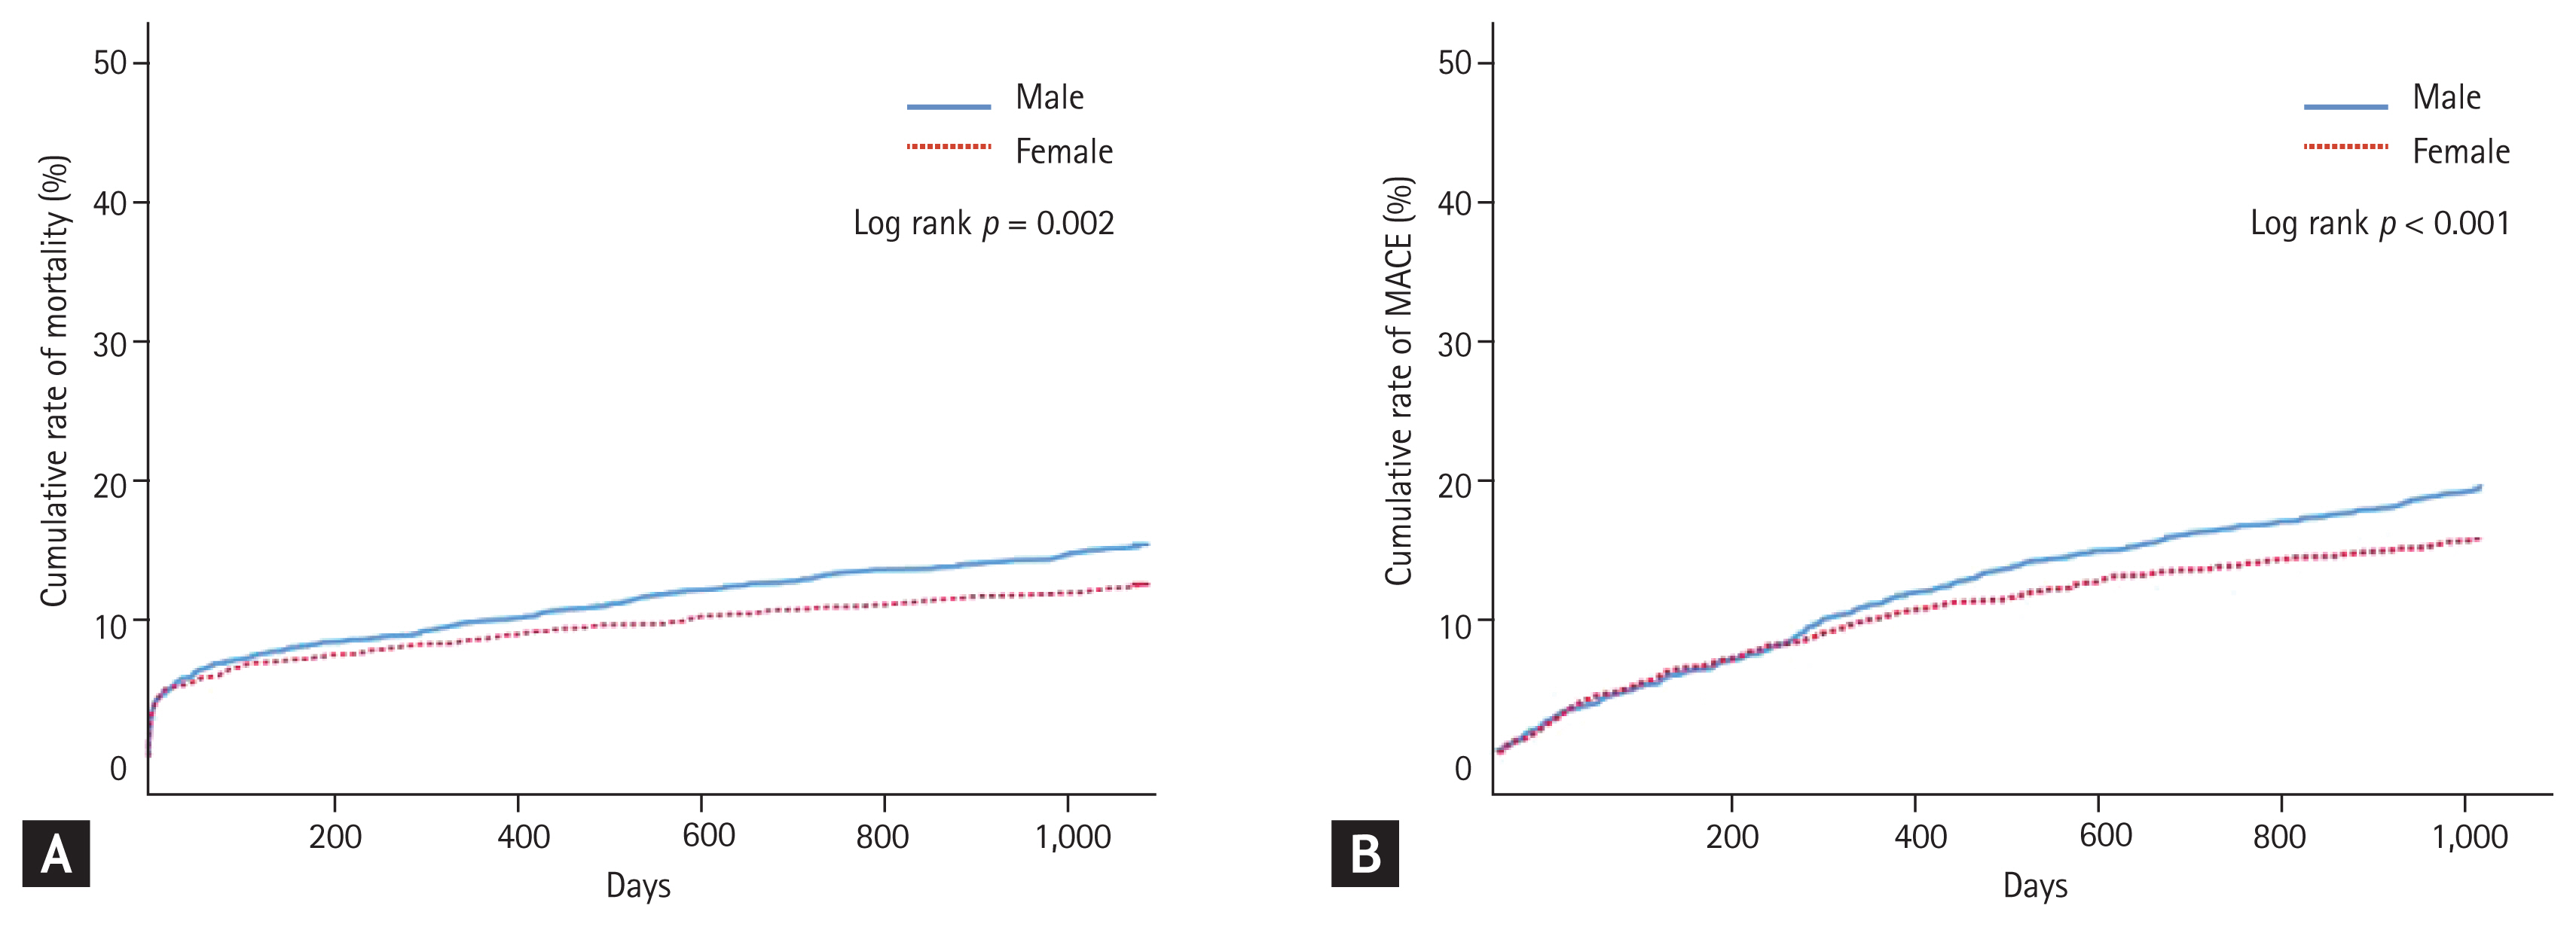
After PSM, in the non-diabetic group, all cause death (p = 0.002), non-cardiac death (p = 0.006), MACE (p < 0.001), repeat PCI (p = 0.03), CABG (p = 0.007) were significantly higher in males than in females (Table 6). Analysis using Kaplan–Meier survival curves showed that mortality and MACE in the non-diabetic group were significantly higher in males than in females (Fig. 2).

Predictive factors of 3-year mortality

Predictors of mortality in males in the PSM diabetic group were old age over 65 years, low LVEF (< 40%), tachycardia (> 100, beats/min), high Killip class, high creatinine level (> 1.3 mg/dL), low hemoglobin level (< 12 g/dL) and no PCI, whereas in females, predictors included age over 65 years, low LVEF (< 40%), high creatinine level (> 1.3 mg/dL), low hemoglobin level (< 12 g/L), and no PCI (Table 7).
Predictors of mortality of males in the PSM non-diabetic group were age over 65 years, no PCI, low LVEF (< 40%), high creatinine level (> 1.3 mg/dL), high Killip class, and low hemoglobin level (< 12 g/dL), whereas in females, they were age over 65 years, low hemoglobin level (< 12 g/dL), low LVEF (< 40%), high creatinine level (> 1.3 mg/dL), tachycardia (> 100, beats/min), high Killip class, low HDL-C level ( > 40 mg/dL), and no PCI (Table 8).

DISCUSSION

In the PSM analysis, male and female AMI patients with DM were comparable in mortality, but male MI patients without DM had higher mortality rate and incidence of MACE than female AMI patients without DM.
According to the 2018 National Statistical Office data [18], the mortality rate of circulatory system disease was 122.7 per 100,000 populations, followed by heart disease, cerebrovascular disease, and hypertensive disease. The mortality rate due to hypertensive disease, heart disease, and cerebrovascular disease increased compared with that in the previous year; among these conditions, ischemic heart disease, including AMI, resulted in a higher mortality rate in males than in females. In a previous study, female AMI patients had a higher mortality rate than males possibly because females were older than males at the time of disease onset [19]. The incidence rates of heart disease, DM, and hypertension in females was also high [20]. Similarly, in the present study, females with and without DM were older than males, and the prevalence rate of underlying diseases was higher in females than in males. Regarding long-term prognosis, females demonstrated a significantly higher mortality rate and incidence of MACE than males.
A European study analyzed the long-term prognosis of patients with AMI and found that the mortality rate was not significantly different between males and females in the age-adjusted analysis [21]. In another study in Europe, no difference was found in the short and long-term mortality rates between male and female AMI patients in PSM analysis [22].
According to the Korean AMI data, females had a significantly higher mortality rate and incidence of MACE than males because female patients tended to be older at the time of disease and have more underlying diseases than male patients [23].
A German study compared the long-term mortality in male and female MI patients with and without DM. In that study, the mortality rate in male and female patients without DM were comparable, but female patients with DM had a significantly higher mortality rate than male patients with DM [24]. In contrast, a study in Finland conducted an age-adjusted analysis of the prevalence of AMI in patients with and without DM and found that males had a significantly higher AMI rate than females [25].
In a European study, the incidence of coronary artery disease was comparable between male and female diabetic patients. However, the incidence of obstructive coronary artery disease was higher in non-diabetic males than in non-diabetic females [26]. Obstructive coronary artery disease has a higher mortality rate than non-obstructive and normal coronary arteries [27]. The results regarding the differences in clinical outcomes between males and females may be related to the intrinsic differences in biology, pathophysiology, and psychosocial factors according to sex [28].
The level of troponin I measured at hospitalization was significantly higher in males than in females in both the diabetic and non-diabetic groups. Troponin I is a myocardium-specific enzyme related to multi-vessel diseases and complex lesions found through coronary angiography [29]. Males with and without DM had significantly more culprit lesions in the left main coronary artery than females; culprit lesions in the left main coronary artery were associated with a high mortality rate in a previous study [30]. In addition, on coronary angiography, type C lesions were significantly more common in non-diabetic males than in non-diabetic females.
For both sexes, factors affecting mortality in the diabetic and non-diabetic groups were old age, heart failure, renal dysfunction, anemia and no PCI. The author also confirmed that the average creatinine level measured at hospitalization was significantly higher in males than in females. Previous studies have also reported that mortality is significantly higher for both cardiac and non-cardiac deaths if the creatinine level is higher than 1.2 mg/dL [31]. In addition, non-diabetic males showed a lower average LVEF than non-diabetic females. In the United States Framingham Heart Study comparing the long-term mortality rates in males and females with heart failure, males had higher mortality rates than females in the age-adjusted and unadjusted analysis [32]. In addition, old age was found to be the independent predictor of mortality, while a preceding study found that old age was a major predictor of mortality in patients with AMI [33]. In particular, the mortality rate in patients with AMI aged ≥ 75 years was found to be higher in males than in females [34].
The present study prospectively enrolled patients with AMI, and some limitations should be considered when interpreting its results. First, since the fasting blood glucose level and HbA1c level were not measured in all patients, patients who were not diagnosed with DM may have been excluded from the diabetic group. Second, it is essential to check whether patients diagnosed with DM after discharge are adhering to the DM treatment regimen.
In conclusion, there was no significant difference in the prognosis of patients with AMI accompanied by DM in terms of sex. However, non-diabetic male AMI patients showed higher mortality and MACE than non-diabetic females AMI patients did.

KEY MESSAGE

Female acute myocardial infarction (AMI) patients with and without diabetes had a higher mortality than male AMI patients with and without diabetes.
After propensity score matching, there was no significant difference in the prognosis of male and female diabetic patients. Mortality and major adverse cardiac events were higher in non-diabetic males than in non-diabetic females.
Old age, renal dysfunction, heart failure, and anemia affected the mortality of the diabetic and non-diabetic groups in both sexes.

Conflict of Interest

Conflict of interest
No potential conflict of interest relevant to this article was reported.

Acknowledgments

This research was supported by a fund (2013-E63005-02) by Research of Korea Centers for Disease Control and Prevention.

Figure 1
Kaplan–Meier curve for major adverse cardiac events (MACE) and mortality in diabetic patients with acute myocardial infarction. Cumulative rate of mortality (A) and MACE (B).
kjim-2020-477f1.jpg
Figure 2
Kaplan–Meier curve for major adverse cardiac events (MACE) and mortality in non-diabetic patients with acute myocardial infarction. Cumulative rate of mortality (A) and MACE (B).
kjim-2020-477f2.jpg
Table 1
Clinical characteristics of diabetic patients
Variable Overall DM patients (n = 4,458) After propensity score matching (n = 2,046)


Male (n = 3,106) Female (n = 1,352) p value Male (n = 1,023) Female (n = 1,023) p value
Baseline clinical characteristic

 Age, yr 62.6 ± 11.4 71.7 ± 9.5 < 0.001 69.8 ± 9.4 69.9 ± 9.4 0.737

 Diastolic BP, mmHg 78.2 ± 18.2 77.4 ± 18.2 0.891 77.4 ± 16.7 77.6 ± 18.3 0.821

 Systolic BP, mmHg 130.3 ± 30.1 131.7 ± 30.9 0.341 131.1 ± 29.4 131.7 ± 31.0 0.640

 Heart rate, /min 80.8 ± 20.1 82.8 ± 20.4 0.326 81.6 ± 19.5 82.6 ± 20.2 0.243

 BMI, kg/m2 24.4 ± 3.2 23.7 ± 3.5 < 0.001 23.7 ± 3.1 23.9 ± 3.5 0.588

 Atypical chest pain 504 (16.2) 300 (22.2) < 0.001 207 (20.2) 224 (21.9) 0.357

 Dyspnea 780 (25.1) 435 (32.2) < 0.001 334 (32.6) 315 (30.8) 0.367

 Killip class

  ≤ 2 2,610 (84) 1,053 (77.9) < 0.001 816 (79.8) 812 (79.4) 0.826

  ≥ 3 496 (16) 299 (22.1) 207 (20.2) 211 (20.6)

 Hypertension 1,813 (58.4) 1,032 (76.3) < 0.001 752 (73.5) 746 (72.9) 0.765

 Dyslipidemia 449 (14.5) 180 (13.3) 0.314 149 (14.6) 136 (13.3) 0.407

 Previous MI 341 (11) 140 (10.4) 0.537 122 (11.9) 118 (11.5) 0.783

 Previous angina 357 (11.5) 198 (14.6) 0.003 164 (16.0) 155 (15.2) 0.583

 Previous HF 54 (1.7) 51 (3.8) < 0.001 28 (2.7) 22 (2.2) 0.390

 Previous CVA 264 (8.5) 162 (12) < 0.001 127 (12.4) 125 (12.2) 0.893

 Current smoking 1,424 (45.8) 89 (6.6) < 0.001 86 (8.4) 89 (8.7) 0.813

 Clinical diagnosis

 STEMI 1,456 (46.9) 495 (36.6) < 0.001 422 (41.3) 381 (37.2) 0.063

Concomitant medication

 Aspirin 3,084 (99.3) 1,341 (99.2) 0.706 1,015 (99.2) 1,013 (99.0) 0.636

 Clopidogrel 2,422 (78) 1,158 (85.7) < 0.001 870 (85.0) 864 (84.5) 0.712

 Prasugrel 407 (13.1) 79 (5.8) < 0.001 73 (7.1) 67 (6.5) 0.599

 Ticagrelor 644 (29.1) 266 (27.9) 0.499 185 (26.7) 216 (30.3) 0.140

 CCB 265 (8.5) 148 (10.9) 0.011 113 (11.0) 111 (10.9) 0.887

 ACEI 1,349 (43.4) 523 (38.7) 0.003 352 (34.4) 408 (39.9) 0.010

 ARB 1,042 (33.5) 518 (38.3) 0.002 403 (39.4) 389 (38.0) 0.525

 Statin 2,755 (88.7) 1,160 (85.8) 0.006 872 (85.2) 880 (86.0) 0.614

Echocardiography findings

 LVEF, % 50.2 ± 11.8 49.9 ± 12.4 0.392 49.2 ± 12.2 49.9 ± 12.3 0.156

Laboratory findings at admission

 WBC, 103/mL 10.9 ± 5.9 10.6 ± 4.3 0.046 10.3 ± 8.3 10.6 ± 4.4 0.350

 Neutrophil, % 67.1 ± 14.8 70.3 ± 13.8 < 0.001 68.7 ± 14.8 70.1 ± 14.0 0.027

 Hemoglobin, g/dL 13.9 ± 2.2 11.9 ± 1.9 < 0.001 13.1 ± 2.3 11.9 ± 1.9 < 0.001

 Platelet, 103/μL 224.5 ± 66.8 249.6 ± 77.5 < 0.001 215.2 ± 68.8 248.8 ± 75.5 < 0.001

 Glucose, mg/dL 220.6 ± 97.5 236.7 ± 114.6 < 0.001 212.2 ± 93.1 237.0 ± 114.1 < 0.001

 Creatinine, mg/dL 1.4 ± 1.6 1.3 ± 1.2 0.001 1.7 ± 1.8 1.3 ± 1.3 < 0.001

 CK-MB, ng/mL 95.1 ± 133.4 71.6 ± 100.7 < 0.001 76.9 ± 104.7 71.1 ± 100.7 0.205

 Troponin I, ng/mL 49.5 ± 93.4 35.6 ± 83.7 < 0.001 50.6 ± 93.8 35.3 ± 89.4 < 0.001

 Total cholesterol, mg/dL 168.4 ± 46.5 171.6 ± 50.9 0.051 156.1 ± 41.9 173.1 ± 51.6 < 0.001

 Triglyceride, mg/dL 148.9 ± 132.1 133 ± 94.1 < 0.001 125.2 ± 110.6 138.0 ± 96.6 0.009

 HDL-C, mg/dL 40.2 ± 11.3 42.9 ± 13.5 < 0.001 40.5 ± 12.0 42.9 ± 13.6 < 0.001

 LDL-C, mg/dL 104.0 ± 39.4 103.5 ± 41.1 0.710 94.9 ± 35.7 104.3 ± 41.4 < 0.001

 hs-CRP, mg/dL 1.9 ± 7.4 2.4 ± 8.4 0.234 2.5 ± 9.1 2.5 ± 9.4 0.988

 NT-proBNP, pg/mL 3,229.8 ± 10,673.2 5,991.7 ± 9,275.8 < 0.001 5,269.9±16,741.8 5,690.5 ± 917.9 0.572

 Hemoglobin A1c, % 7.7 ± 1.7 7.6 ± 1.6 0.112 7.3 ± 1.5 7.6 ± 1.7 < 0.001

 ARU, units 459.3 ± 72.3 466.5 ± 70.7 0.146 469.8 ± 74.8 465.8 ± 71.9 0.561

 PRU, units 195.5 ± 105.4 257.3 ± 98.7 < 0.001 226.6 ± 102.6 252.1 ± 100.7 0.003

Values are presented as mean ± SD or number (%).

DM, diabetes mellitus; BP, blood pressure; BMI, body mass index; MI, myocardial infarction; HF, heart failure; CVA, cardiovascular accident; STEMI, ST-segment elevation myocardial infarction; CCB, calcium channel blocker; AECI, angiotensin-converting enzyme inhibitor; ARB, angiotensin receptor blocker; LVEF, left ventricular ejection fraction; WBC, white blood cell; CK-MB, creatine kinase myocardial band; LDL-C, low-density lipoprotein cholesterol; HDL-C, high-density lipoprotein cholesterol; hs-CRP, high sensitivity C-reactive protein; NT-proBNP, N-terminal pro-brain natriuretic peptide; ARU, aspirin reactivity units; PRU, platelet reactivity units.

Table 2
Clinical characteristics of non-diabetic patients
Variable Overall non-DM patients (n = 8,646) After propensity-score matching (n = 3,412)


Male Female p value Male Female p value
Baseline clinical characteristics

 Age, yr 60.4 ± 12.4 72.3 ± 11.0 < 0.001 70.0 ± 10.4 70.4 ± 10.8 0.296

 Diastolic BP, mmHg 79.8 ± 18.2 76.8 ± 18.6 < 0.001 78.5 ± 17.6 77.16 ± 18.9 0.062

 Systolic BP, mmHg 130.3 ± 29.2 128.5 ± 31.1 0.017 129.9 ± 28.8 128.9 ± 31.3 0.365

 Heart rate, /min 76.9 ± 18.6 78.2 ± 20.2 0.006 77.2 ± 19.2 77.5 ± 19.6 0.634

 BMI, kg/m2 24.2 ± 3.1 23.1 ± 3.5 < 0.001 23.4 ± 3.0 23.4 ± 3.4 0.764

 Atypical chest pain 677 (10.3) 331 (16.0) < 0.001 274 (16.1) 247 (14.5) 0.199

 Dyspnea 1,364 (20.7) 526 (25.4) < 0.001 470 (27.5) 411 (24.1) 0.121

 Killip class

  ≤ 2 5,925 (90.1) 1,766 (85.4) < 0.001 1,480 (86.8) 1,482 (86.9) 0.919

  ≥ 3 654 (9.9) 301 (14.6) 226 (13.2) 224 (13.1)

 HTN 2,604 (39.6) 1,241 (60) < 0.001 927 (54.3) 955 (56.0) 0.335

 Dyslipidemia 652 (9.9) 193 (9.3) 0.444 178 (10.4) 164 (9.6) 0.425

 Previous MI 438 (6.7) 110 (5.3) 0.030 112 (6.6) 100 (5.9) 0.395

 Previous angina 537 (8.2) 187 (9.1) 0.205 198 (11.6) 170 (10.0) 0.122

 Previous HF 65 (1) 43 (2.1) < 0.001 29 (1.7) 32 (1.9) 0.698

 Previous CVA 310 (4.7) 152 (7.4) < 0.001 121 (7.1) 13 (7.7) 0.472

 Current smoking 3,431 (52.2) 168 (8.1) < 0.001 140 (8.2) 168 (9.8) 0.094

 Clinical diagnosis

 STEMI 3,459 (52.6) 915 (44.3) < 0.001 805 (47.2) 764 (44.8) 0.159

Concomitant medication

 Aspirin 6,551 (99.6) 2,057 (99.5) 0.727 1,697 (99.5) 1,698 (99.5) 0.808

 Clopidogrel 4,942 (75.1) 1,739 (84.1) < 0.001 1,433 (84.0) 1,425 (83.5) 0.710

 Prasugrel 961 (14.6) 117 (5.7) < 0.001 118 (6.9) 105 (6.2) 0.368

 Ticagrelor 1,591 (33.4) 415 (28.7) 0.001 341 (28.4) 351 (29.5) 0.552

 CCB 507 (7.7) 161 (7.8) 0.902 141 (8.3) 138 (8.1) 0.851

 ACEI 3,285 (49.9) 865 (41.9) < 0.001 721 (42.3) 725 (42.5) 0.890

 ARB 1,844 (28) 694 (33.6) < 0.001 509 (29.8) 580 (34.0) 0.009

 Statin 6,090 (92.6) 1,836 (88.8) < 0.001 1,530 (89.7) 1,533 (89.9) 0.865

Echocardiography findings

 LVEF, % 52.9 ± 10.5 52.4 ± 11.5 0.063 51.9 ± 11.2 52.8 ± 11.1 0.015

Laboratory findings at admission

 WBC, 103/mL 10.5 ± 3.9 9.8 ± 4.3 < 0.001 9.5 ± 3.6 9.6 ± 4.3 0.055

 Neutrophil, % 65.1 ± 15.4 67.4 ± 15.4 < 0.001 66.6 ± 15.3 66.8 ± 15.3 0.794

 Hemoglobin, g/dL 14.5 ± 1.8 12.4 ± 1.6 < 0.001 13.8 ± 2.1 12.5 ± 1.6 < 0.001

 Platelet, 103/μL 228.1 ± 62.3 246.5 ± 74.8 < 0.001 214.3 ± 63.1 247.0 ± 72.4 < 0.001

 Glucose, mg/dL 139.8 ± 45.2 145.0 ± 57.8 < 0.001 141.9 ± 48.5 144.72 ± 57.7 0.129

 Creatinine, mg/dL 1.0 ± 0.8 0.9 ± 0.7 < 0.001 1.2 ± 1.1 0.9 ± 0.7 < 0.001

 CK-MB, ng/mL 127.8 ± 168.7 96.7 ± 137.7 < 0.001 110.7 ± 166.4 99.5 ± 141.8 0.035

 Tn I, ng/mL 51.3 ± 120.0 36.5 ± 85.0 < 0.001 53.6 ± 100.8 34.8 ± 64.1 < 0.001

 Total cholesterol, mg/dL 181.9 ± 44.3 183.1 ± 46.3 0.296 169.6 ± 40.0 184.3 ± 45.9 < 0.001

 Triglyceride, mg/dL 134.3 ± 115.6 107.9 ± 81.6 < 0.001 104.8 ± 69.2 109.6 ± 84.0 0.081

 HDL-C, mg/dL 42.8 ± 11.3 46.4 ± 12.6 < 0.001 43.8 ± 11.8 46.4 ± 12.5 < 0.001

 LDL-C, mg/dL 115.7 ± 38.6 116.0 ± 40.0 0.753 106.5 ± 35.2 116.9 ± 40.0 < 0.001

 hs-CRP, mg/dL 1.2 ± 4.1 1.5 ± 5.73 0.026 1.50 ± 4.1 1.3 ± 5.8 0.359

 NT-proBNP, pg/mL 1,306.1 ± 4,659.0 3,617.9 ± 6,823.7 < 0.001 2,799.3 ± 7,694.2 2,976.6 ± 5,967.6 0.507

 Hemoglobin A1c, % 5.6 ± 0.4 5.7 ± 0.4 0.002 5.6 ± 0.4 5.7 ± 0.4 0.017

 ARU, units 458.0 ± 76.9 463.0 ± 69.5 0.217 465.9 ± 74.8 459.2 ± 69.1 < 0.001

 PRU, units 176.8 ± 104.8 237.0 ± 115.0 < 0.001 207.3 ± 102.5 236.1 ± 112.7 0.015

Values are presented as mean ± SD or number (%).

DM, diabetes mellitus; BP, blood pressure; BMI, body mass index; HTN, hypertension; MI, myocardial infarction; HF, heart failure; CVA, cardiovascular accident; STEMI, ST-segment elevation myocardial infarction; CCB, calcium channel blocker; AECI, angiotensin-converting enzyme inhibitor; ARB, angiotensin receptor blocker; LVEF, left ventricular ejection fraction; WBC, white blood cell; CK-MB, creatine kinase myocardial band; Tn I, troponin-I; HDL-C, high-density lipoprotein cholesterol; LDL-C, low-density lipoprotein cholesterol; hs-CRP, high sensitivity C-reactive protein; NT-proBNP, N-terminal pro-brain natriuretic peptide; ARU, aspirin reactivity units; PRU, platelet reactivity units.

Table 3
Coronary angiographic findings and procedural characteristics for diabetic patients
Variable Overall DM patients (n = 4,458) After propensity-score matching (n = 2,046)


Male (n = 3,106) Female (n = 1,352) p value Male (n = 1,023) Female (n = 1,023) p value
PCI 2,755 (88.7) 1,152 (85.2) 0.001 874 (85.4) 873 (85.3) 0.950

ACC/AHA type

 A 35 (1.3) 15 (1.3) 0.650 20 (2.2) 14 (1.6) 0.721

 B1 311 (11.2) 135 (11.7) 109 (12.2) 104 (11.8)

 B2 1,018 (36.6) 444 (38.4) 316 (35.5) 325 (37.0)

 C 1,414 (50.9) 563 (48.7) 445 (50.0) 435 (49.5)

Target vessel

 LM 87 (3.15) 28 (2.4) 0.130 35 (3.9) 22 (2.5) 0.008

 LAD 1,248 (44.9) 542 (46.8) 385 (43.3) 421 (47.9)

 RCA 990 (35.6) 378 (32.7) 344 (38.7) 286 (32.6)

 LCX 453 (16.3) 209 (18.1) 126 (14.2) 149 (17.0)

Number of involved vessels

 LM (simple) 20 (0.7) 2 (0.2) 0.009 5 (0.5) 2 (0.2) 0.023

 LM (complex) 187 (6.3) 57 (4.6) 82 (8.5) 46 (4.9)

 Singe vessel disease 1,212 (40.7) 479 (38.5) 359 (37.0) 371 (39.6)

 Two vessel disease 900 (30.2) 396 (31.9) 299 (30.8) 289 (30.8)

 Three vessel disease 657 (22.1) 309 (24.9) 225 (23.2) 230 (24.5)

 Pre-PCI TIMI flow ≤ 2 2,313 (74.5) 999 (73.9) 0.685 780 (76.2) 754 (73.7) 0.185

 Post-PCI TIMI flow 3 2,673 (86.1) 1,115 (82.5) 0.002 845 (82.6) 843 (82.4) 0.907

Values are presented as number (%).

DM, diabetes mellitus; PCI, percutaneous coronary intervention; ACC/AHA, American College of Cardiology/American Heart Association; LM, left main; LAD, left anterior descending; RCA, right coronary artery; LCX, left circumflex artery; TIMI, thrombolysis in myocardial infarction.

Table 4
Coronary angiographic findings and procedural characteristics for non-diabetic patients
Variable Overall non-DM patients (n = 8,646) After propensity-score matching (n = 3,412)


Male (n = 6,579) Female (n = 2,067) p value Male (n = 1,706) Female (n = 1,706) p value
PCI 6,018 (91.5) 1,746 (84.5) < 0.001 1,485 (87.0) 1,486 (87.1) 0.959

ACC/AHA type

 A 91 (1.5) 27 (1.5) 0.100 47 (3.1) 26 (1.7) < 0.001

 B1 729 (12) 232 (13.1) 190 (12.6) 205 (13.7)

 B2 2,214 (36.6) 690 (39.1) 477 (31.8) 567 (37.8)

 C 3,019 (49.9) 817 (46.3) 788 (52.5) 703 (46.8)

Target vessel

 LM 126 (2.1) 33 (1.9) 0.400 51 (3.4) 27 (1.8) 0.012

 LAD 2,823 (46.6) 863 (48.9) 684 (45.5) 739 (49.2)

 RCA 2,025 (33.5) 558 (31.6) 505 (33.6) 468 (31.2)

 LCX 1,079 (17.8) 312 (17.7) 262 (17.4) 267 (17.8)

Number of involved vessels

 LM (simple) 29 (0.5) 8 (0.4) < 0.001 12 (0.7) 8 (0.5) < 0.001

 LM (complex) 274 (4.4) 78 (4.2) 114 (7.1) 63 (4.0)

 Singe vessel disease 3,336 (53) 943 (50.3) 742 (46.3) 816 (51.9)

 Two vessel disease 1,743 (27.7) 516 (27.5) 458 (28.6) 432 (27.5)

 Three vessel disease 913 (14.5) 329 (17.6) 278 (17.3) 254 (16.1)

 Pre-PCI TIMI flow ≤ 2 5,049 (76.7) 1,606 (77.7) 0.369 1,368 (80.2) 1,319 (77.3) 0.040

 Post-PCI TIMI flow 3 5,867 (89.2) 1,675 (81) < 0.001 1,429 (83.8) 1,434 (84.1) 0.816

Values are presented as number (%).

DM, diabetes mellitus; PCI, percutaneous coronary intervention; ACC/AHA, American College of Cardiology/American Heart Association; LM, left main; LAD, left anterior descending; RCA, right coronary artery; LCX, left circumflex artery; TIMI, thrombolysis in myocardial infarction.

Table 5
Clinical outcomes at the 3-year follow-up in diabetic patients
Variable Overall DM patients (n = 4,458) After propensity-score matching (n = 2,046)


Male (n = 3,106) Female (n = 1,352) p value Male (n = 1,023) Female (n = 1,023) p value
All-cause death 449 (14.6) 303 (22.7) < 0.001 213 (21.1) 218 (21.5) 0.813

Cardiac death 304 (9.9) 204 (15.3) < 0.001 142 (14.1) 141 (13.9) 0.927

Non-cardiac death 145 (4.7) 99 (7.4) < 0.001 71 (7.0) 77 (7.6) 0.622

Recurrent MI 123 (4.2) 63 (5.0) 0.248 43 (4.6) 44 (4.6) 0.965

Repeat PCI 202 (6.9) 74 (5.1) 0.221 63 (6.7) 6.4 (61) 0.791

CABG 16 (0.5) 7 (1.6) 0.970 7 (0.7) 7 (0.7) 0.979

MACE 615 (21) 354 (28.1) < 0.001 309 (30.6) 318 (31.4) 0.698

Values are presented as number (%).

DM, diabetes mellitus; MI, myocardial infarction; PCI, percutaneous coronary intervention; CABG, coronary artery bypass graft; MACE, major adverse cardiac events.

Table 6
Clinical outcomes at the 3-year follow-up in non-diabetic patients
Variable Overall non-DM patients (n = 8,646) After propensity-score matching (n = 3,412)


Male (n = 6,579) Female (n = 2,067) p value Male (n = 1,023) Female (n = 1,023) p value
All cause death 552 (8.5) 305 (15) < 0.001 265 (15.8) 203 (12.0) 0.002

Cardiac death 373 (5.7) 224 (11) < 0.001 178 (10.6) 148 (8.8) 0.078

Non-cardiac death 179 (2.8) 81 (4) 0.005 87 (5.2) 55 (3.3) 0.006

Recurrent MI 151 (2.4) 57 (3) 0.167 36 (2.2) 50 (3.1) 0.135

Repeat PCI 410 (6.5) 89 (4.6) 0.002 107 (6.7) 79 (4.9) 0.030

CABG 24 (0.4) 3 (1.2) 0.131 12 (0.7) 2 (0.1) 0.007

MACE 935 (14.8) 336 (17.4) 0.005 333 (20.8) 251 (15.6) < 0.001

Values are presented as number (%).

DM, diabetes mellitus; MI, myocardial infarction; PCI, percutaneous coronary intervention; CABG, coronary artery bypass graft; MACE, major adverse cardiac events.

Table 7
Cox regression analysis for independent predictors of 3-year mortality in diabetic patients
Variable Diabetic male patients (n = 1,023, respectively)

Univariate analysis Multivariate analysis


HR 95% CI p value HR 95% CI p value
Male

 Age ≥ 65 years 3.044 1.958–4.735 < 0.001 3.149 1.636–6.062 0.001

 Killip class ≥ 3 4.603 3.510–6.037 < 0.001 2.028 1.346–3.056 0.001

 Heart rate ≥ 100/min 0.536 0.364–0.789 0.002 2.758 1.289–5.902 0.009

 Current smoking 0.777 0.452–1.336 0.362

 Hemoglobin < 12 g/dL 3.271 2.496–4.288 < 0.001 1.656 1.163–2.356 0.005

 Creatinine > 1.3 mg/dL 3.549 2.7–4.667 < 0.001 1.768 1.192–2.625 0.005

 Triglyceride > 150 mg/dL 1.311 0.992–1.732 0.057

 Total cholesterol > 200 mg/dL 1.062 0.755–1.493 0.731

 HDL-C < 40 mg/dL 1.290 0.985–1.690 0.064

 LDL-C > 130 mg/dL 0.543 0.307–0.959 0.036 1.122 0.562–2.243 0.744

 LVEF < 40% 3.753 2.782–5.064 < 0.001 2.899 1.984–4.237 < 0.001

 No PCI 2.856 2.120–3.847 < 0.001 2.104 1.468–3.014 < 0.001

 SBP ≥ 140 mmHg 0.663 0.495–0.888 0.006 0.618 0.419–0.912 0.015

 BMI ≥ 25 kg/m2 0.627 0.459–0.858 0.004 0.713 0.473–1.073 0.104

Female

 Age ≥ 65 years 2.530 1.690–3.787 < 0.001 3.067 1.882–5.000 < 0.001

 Killip class ≥ 3 3.179 2.422–4.174 < 0.001 1.248 0.862–1.806 0.241

 Heart rate ≥ 100/min 0.327 0.233–0.460 < 0.001 0.627 0.390–1.010 0.055

 Current smoking 0.811 0.487–1.349 0.420

 Hemoglobin < 12 g/dL 2.497 1.887–3.305 < 0.001 1.551 1.086–2.214 0.016

 Creatinine > 1.3 mg/dL 3.451 2.636–4.518 < 0.001 2.111 1.491–2.989 < 0.001

 Triglyceride > 150 mg/dL 1.036 0.788–1.361 0.800

 Total cholesterol > 200 mg/dL 0.856 0.636–1.153 0.306

 HDL-C < 40 mg/dL 1.246 0.954–1.629 0.107

 LDL-C > 130 mg/dL 0.707 0.478–1.045 0.082

 LVEF < 40% 3.272 2.445–4.380 < 0.001 2.505 1.777–3.531 < 0.001

 No PCI 2.385 1.764–3.224 < 0.001 1.974 1.359–2.866 < 0.001

 SBP ≥ 140 mmHg 0.586 0.439–0.782 < 0.001 0.753 0.535–1.061 0.105

 BMI ≥ 25 kg/m2 0.870 0.646–1.172 0.360

HR was calculated by Cox regression analysis.

HR, hazard ratio; CI, confidence interval; HDL-C, high-density lipoprotein cholesterol; LDL-C, low-density lipoprotein cholesterol; LVEF, left ventricular ejection fraction; PCI, percutaneous coronary intervention; SBP, systolic blood pressure; BMI, body mass index.

Table 8
Cox regression analysis for independent predictors of 3-year mortality in non-diabetic patients
Variable Non-diabetic patients (n = 1,706, respectively)

Univariate analysis Multivariate analysis


HR 95% CI p value HR 95% CI p value
Male

 Age ≥ 65 years 4.201 2.761–6.393 < 0.001 3.871 2.129–7.038 < 0.001

 Killip class ≥ 3 5.230 4.065–6.730 < 0.001 1.905 1.358–2.671 < 0.001

 Heart rate ≥ 100/min 2.464 1.843–3.294 < 0.001 1.155 0.789–1.689 0.459

 Current smoking 0.865 0.520–1.381 0.545

 Hemoglobin < 12 g/dL 3.935 3.073–5.038 < 0.001 1.867 1.356–2.571 < 0.001

 Creatinine > 1.3 mg/dL 3.916 3.039–5.046 < 0.001 1.998 1.442–2.766 < 0.001

 Triglyceride > 150 mg/dL 1.256 0.965–1.635 0.090

 Total cholesterol > 200 mg/dL 0.824 0.615–1.102 0.192

 HDL-C < 40 mg/dL 0.747 0.559–1.000 0.510

 LDL-C > 130 mg/dL 0.641 0.445–0.922 0.017 1.298 0.814–2.070 0.273

 LVEF < 40% 4.414 3.317–5.874 < 0.001 2.041 1.455–2.863 < 0.001

 No PCI 2.320 1.744–3.083 < 0.001 2.060 1.480–2.865 < 0.001

 SBP ≥ 140 mmHg 0.688 0.530–0.894 0.005 0.942 0.703–1.264 0.692

 BMI ≥ 25 kg/m2 0.309 0.210–0.455 < 0.001 0.561 0.360–0.875 0.051

Female

 Age ≥ 65 years 3.729 2.324–5.983 < 0.001 2.964 1.502–4.833 0.001

 Killip class ≥ 3 4.013 2.997–5.375 < 0.001 1.780 1.182–2.682 0.006

 Heart rate ≥ 100/min 2.910 2.111–4.011 < 0.001 1.791 1.170–2.742 0.007

 Current smoking 1.422 0.947–2.135 0.089

 Hemoglobin < 12 g/dL 2.995 2.264–3.691 < 0.001 2.080 1.439–3.008 < 0.001

 Creatinine > 1.3 mg/dL 4.866 3.478–6.806 < 0.001 1.895 1.134–3.167 0.015

 Triglyceride > 150 mg/dL 1.322 0.979–1.784 0.069

 Total cholesterol > 200 mg/dL 0.744 0.550–1.007 0.055

 HDL-C < 40 mg/dL 1.591 1.247–2.030 < 0.001 1.406 1.028–1.922 0.033

 LDL-C > 130 mg/dL 0.634 0.439–0.915 0.015 0.940 0.606–1.456 0.780

 LVEF < 40% 3.480 2.464–4.915 < 0.001 2.009 1.384–2.916 < 0.001

 No PCI 2.101 1.510–2.923 < 0.001 1.853 1.290–2.663 0.001

 SBP ≥ 140 mmHg 0.454 0.326–0.631 < 0.001 0.818 0.560–1.195 0.299
 BMI ≥ 25 kg/m2 0.537 0.372–0.773 0.001 0.770 0.501–1.182 0.231

HR was calculated by Cox regression analysis.

HR, hazard ratio; CI, confidence interval; HDL-C, high-density lipoprotein cholesterol; LDL-C, low-density lipoprotein cholesterol; LVEF, left ventricular ejection fraction; PCI, percutaneous coronary intervention; SBP, systolic blood pressure; BMI, body mass index.

REFERENCES

1. Korea Centers for Disease Control. 2018 Disease Management White Paper. Cheongju (KR): KDCA, 2018.

2. Korea Centers for Disease Control. 2017 Disease Management White Paper. Cheongju (KR): KDCA, 2017.

3. Kannel WB, McGee DL. Diabetes and cardiovascular disease: the Framingham study. JAMA 1979;241:2035–2038.
crossref pmid
4. Yusuf S, Hawken S, Ounpuu S, et al. Effect of potentially modifiable risk factors associated with myocardial infarction in 52 countries (the INTERHEART study): case-control study. Lancet 2004;364:937–952.
crossref pmid
5. Wei CC, Shyu KG, Cheng JJ, Lo HM, Chiu CZ. Diabetes and adverse cardiovascular outcomes in patients with acute coronary syndrome: data from Taiwan’s acute coronary syndrome full spectrum data registry. Acta Cardiol Sin 2016;32:31–38.
pmid pmc
6. Arnold SV, Lipska KJ, Li Y, et al. Prevalence of glucose abnormalities among patients presenting with an acute myocardial infarction. Am Heart J 2014;168:466–470.
crossref pmid pmc
7. Kim Y, Ahn Y, Cho MC, Kim CJ, Kim YJ, Jeong MH. Current status of acute myocardial infarction in Korea. Korean J Intern Med 2019;34:1–10.
crossref pmid
8. Centers for Disease Control and Prevention. National Diabetes Fact Sheet: National Estimates and General Information on Diabetes and Prediabetes in the United States. Atlanta (GA): CDC, 2011.

9. Park KH, Ahn Y, Jeong MH, et al. Different impact of diabetes mellitus on in-hospital and 1-year mortality in patients with acute myocardial infarction who underwent successful percutaneous coronary intervention: results from the Korean Acute Myocardial Infarction Registry. Korean J Intern Med 2012;27:180–188.
crossref pmid pmc
10. Vega G, Martinez S, Jimenez PA, Navarro A, Bernad F. Effect of cardiovascular risk factors on long-term morbidity and mortality following acute myocardial infarction. Rev Esp Cardiol 2007;60:703–713.
crossref pmid
11. Bensen JT, Li R, Hutchinson RG, Province MA, Tyroler HA. Family history of coronary heart disease and pre-clinical carotid artery atherosclerosis in African-Americans and whites: the ARIC study: atherosclerosis risk in communities. Genet Epidemiol 1999;16:165–178.
crossref pmid
12. Hu G, Jousilahti P, Qiao Q, Peltonen M, Katoh S, Tuomilehto J. The gender-specific impact of diabetes and myocardial infarction at baseline and during follow-up on mortality from all causes and coronary heart disease. J Am Coll Cardiol 2005;45:1413–1418.
crossref pmid
13. Juutilainen A, Kortelainen S, Lehto S, Ronnemaa T, Pyorala K, Laakso M. Gender difference in the impact of type 2 diabetes on coronary heart disease risk. Diabetes Care 2004;27:2898–2904.
crossref pmid
14. Melchior T, Kober L, Madsen CR, et al. Accelerating impact of diabetes mellitus on mortality in the years following an acute myocardial infarction. TRACE Study Group. Trandolapril Cardiac Evaluation. Eur Heart J 1999;20:973–978.
crossref pmid
15. Scanlon PJ, Faxon DP, Audet AM, et al. ACC/AHA guidelines for coronary angiography: a report of the American College of Cardiology/American Heart Association Task Force on practice guidelines (Committee on Coronary Angiography). Developed in collaboration with the Society for Cardiac Angiography and Interventions. J Am Coll Cardiol 1999;33:1756–1824.
crossref pmid
16. Ellis SG, Vandormael MG, Cowley MJ, et al. Coronary morphologic and clinical determinants of procedural outcome with angioplasty for multivessel coronary disease. Implications for patient selection. Multivessel Angioplasty Prognosis Study Group. Circulation 1990;82:1193–1202.
crossref pmid
17. Kini AS. Coronary angiography, lesion classification and severity assessment. Cardiol Clin 2006;24:153–162.
crossref pmid
18. Statistical Office. Cause of death statistics [Internet] Daejeon (KR): Statistical Office, 2018. [cited 2020 Dec 14]. Available from: http://kosis.kr/statisticsList .

19. Pyun WB. The differences of acute myocardial infarction in women in clinical characteristics and treatment. Korean Circ J 2007;37:49–50.
crossref
20. Milner KA, Vaccarino V, Arnold AL, Funk M, Goldberg RJ. Gender and age differences in chief complaints of acute myocardial infarction (Worcester Heart Attack Study). Am J Cardiol 2004;93:606–608.
crossref pmid
21. Bonarjee VV, Rosengren A, Snapinn SM, James MK, Dickstein K. OPTIMAAL study group. Sex-based short- and long-term survival in patients following complicated myocardial infarction. Eur Heart J 2006;27:2177–2183.
crossref pmid
22. Kanic V, Vollrath M, Tapajner A, Sinkovic A. Sex-related 30-day and long-term mortality in acute myocardial infarction patients treated with percutaneous coronary intervention. J Womens Health (Larchmt) 2017;26:374–379.
crossref pmid
23. Korea Acute Myocardial Infarction Registry (KAMIR) Investigators. Lee KH, Jeong MH, et al. Gender differences of success rate of percutaneous coronary intervention and short term cardiac events in Korea Acute Myocardial Infarction Registry. Int J Cardiol 2008;130:227–234.
crossref pmid
24. Meisinger C, Heier M, von Scheidt W, Kirchberger I, Hormann A, Kuch B. Gender-specific short and long-term mortality in diabetic versus nondiabetic patients with incident acute myocardial infarction in the reperfusion era (the MONICA/KORA Myocardial Infarction Registry). Am J Cardiol 2010;106:1680–1684.
crossref pmid
25. Hu G, Jousilahti P, Qiao Q, Katoh S, Tuomilehto J. Sex differences in cardiovascular and total mortality among diabetic and non-diabetic individuals with or without history of myocardial infarction. Diabetologia 2005;48:856–861.
crossref pmid
26. Manfrini O, Yoon J, van der Schaar M, et al. Sex differences in modifiable risk factors and severity of coronary artery disease. J Am Heart Assoc 2020;9:e017235.
crossref pmid pmc
27. Kissel CK, Chen G, Southern DA, Galbraith PD, Anderson TJ. APPROACH investigators. Impact of clinical presentation and presence of coronary sclerosis on long-term outcome of patients with non-obstructive coronary artery disease. BMC Cardiovasc Disord 2018;18:173.
crossref pmid pmc
28. Andreotti F, Marchese N. Women and coronary disease. Heart 2008;94:108–116.
crossref pmid
29. deFilippi CR, Tocchi M, Parmar RJ, et al. Cardiac troponin T in chest pain unit patients without ischemic electrocardiographic changes: angiographic correlates and long-term clinical outcomes. J Am Coll Cardiol 2000;35:1827–1834.
crossref pmid
30. Sim DS, Ahn Y, Jeong MH, et al. Clinical outcome of unprotected left main coronary artery disease in patients with acute myocardial infarction. Int Heart J 2013;54:185–191.
crossref pmid
31. Yamaguchi J, Kasanuki H, Ishii Y, et al. Serum creatinine on admission predicts long-term mortality in acute myocardial infarction patients undergoing successful primary angioplasty: data from the Heart Institute of Japan Acute Myocardial Infarction (HIJAMI) Registry. Circ J 2007;71:1354–1359.
crossref pmid
32. Ho KK, Anderson KM, Kannel WB, Grossman W, Levy D. Survival after the onset of congestive heart failure in Framingham Heart Study subjects. Circulation 1993;88:107–115.
crossref pmid
33. Halkin A, Singh M, Nikolsky E, et al. Prediction of mortality after primary percutaneous coronary intervention for acute myocardial infarction: the CADILLAC risk score. J Am Coll Cardiol 2005;45:1397–1405.
crossref pmid
34. Seol SY, Jeong MH, Lee SH, et al. Impact of gender differences in elderly patients with acute myocardial infarction. Korean J Med 2019;94:96–106.
crossref

Editorial Office
101-2501, Lotte Castle President, 109 Mapo-daero, Mapo-gu, Seoul 04146, Korea
Tel: +82-2-2271-6792    Fax: +82-2-790-0993    E-mail: kaim@kams.or.kr                

Copyright © 2024 by Korean Association of Internal Medicine.

Close layer
prev next