


INTRODUCTION
Obesity is a major global health concern that is strongly associated with metabolic disorders such as type 2 diabetes, cardiovascular disease, fatty liver, and higher mortality rates [1,2]. For obese individuals, the approach to achieving weight loss is widely acknowledged to improve metabolic complications and reduce mortality rates [3,4].
Recent studies on obesity-related metabolic disorders have highlighted the critical role of fibrosis in adipose tissue [5]. In the field of adipose tissue biology, previous research has focused extensively on inflammation; however, adipose tissue fibrosis remains somewhat unexplored [5].
The Swedish Obese Subjects (SOS) Study, which identified a reduction in metabolic effects following bariatric weight loss, revealed that over a median follow-up period of 24 years, obese individuals who underwent bariatric surgery experienced an increase in life expectancy [6]. In the same cohort study, which included a 10-year follow-up in 2004 [7] and a 15-year follow-up on diabetes prevention effects in 2012 [8], it was consistently demonstrated that weight loss in individuals with obesity is associated with a reduction in cardiovascular disease, a decreased risk of future diabetes development, and lower mortality rates [6–8]. However, weight regain is observed in a significant number of patients even after bariatric surgery, and it has been reported that the metabolic improvement effects and mortality reduction benefits are lost in this group of patients [9,10].
In patients with obesity, adipose tissue dysfunction is linked to several pathophysiological mechanisms, including fibrosis, chronic inflammation, adipocyte enlargement, and altered adipokine secretion [11]. Traditionally, inflammation within adipose tissue has been considered the primary cause of metabolic disorders and insulin resistance [12]. However, recent studies have proposed a new sequence of events in which fibrosis in adipose tissue may precede inflammation and metabolic dysfunction [13]. Initially, fibrosis is induced, which facilitates the infiltration of inflammatory cells, leading to tissue dysfunction [13]. As fibrosis and inflammation together contribute to adipose tissue remodeling, insulin resistance, and the progression of metabolic diseases, it has recently been suggested that fibrosis may be the central mechanism driving adipose tissue dysfunction [13].
In addition, recent research has focused on the molecular biological processes and alterations in adipose tissue biology that lead to weight regain following significant weight loss [1,14]. Growing evidence suggests that fibrosis in adipose tissue, which has not been extensively studied, may serve as a predictor of metabolic flexibility, weight loss responsiveness, and subsequent weight regain [12,15].
Adipose tissue fibrosis refers to a condition in which the structure and function of the adipose tissue are compromised due to excessive extracellular matrix (ECM) accumulation in obesity [12]. It involves a series of complex pathophysiological processes, including adipocyte hypertrophy, hypoxia, inflammation, and fibroblast activation [13]. Thus, fibrotic changes in adipose tissue are linked to the exacerbation of insulin resistance, adipose tissue dysfunction, and ectopic fat accumulation, ultimately contributing to the progression of obesity-related metabolic diseases [13].
Consequently, a growing number of researchers are concentrating on developing therapies aimed at facilitating the transformation of adipose tissue and altering fibrotic changes [16]. Current investigations are centered on the analysis of structural and functional alterations in the adipose tissue induced by pharmacological interventions, including anti-obesity and anti-diabetic medications, as well as the effects observed pre- and post-bariatric surgery [16]. These factors may serve as significant indicators for predicting the long-term sustainability of weight loss and metabolic improvement [1].
This review thoroughly explores the scientific viewpoints on the molecular and cellular processes involved in adipose tissue fibrosis and the clinical research findings related to changes in adipose tissue before and after bariatric surgery and anti-diabetic therapies.
Our objective was to identify adipose tissue fibrosis as a critical determinant of weight loss treatment efficacy and long-term prognosis in obese patients, particularly weight loss responsiveness and subsequent weight regain, and propose novel diagnostic and therapeutic strategies targeting this pathway.
ADIPOSE TISSUE FIBROSIS MECHANISMS AND RECENT TRENDS IN BASIC RESEARCH
Adipose tissue fibrosis is characterized by the pathological accumulation and cross-linking of ECM proteins, mainly collagen, within white, beige, and brown adipose depots. This process leads to increased tissue stiffness, impaired expandability, and the disruption of endocrine functions. Fibrosis restricts healthy adipose tissue remodeling, aggravates hypoxia and inflammation, and contributes to insulin resistance and cardiometabolic disease [1,13,17,18]. Understanding the mechanisms underlying adipose fibrosis, particularly the integration of ECM components, cellular contributors, and signaling pathways, is essential for identifying new therapeutic strategies.
ECM composition and organization in adipose tissue
The ECM provides a structural and biochemical framework for the adipose tissue that regulates its expansion, differentiation, and repair. It consists of collagens, glycoproteins, and proteoglycans that form a dynamic mechanochemical network that governs adipocyte function and intercellular communication. Structurally, ECM is divided into a basement membrane, which anchors adipocytes and endothelial cells, and an interstitial matrix, which provides tensile strength and mechanical resilience [13].
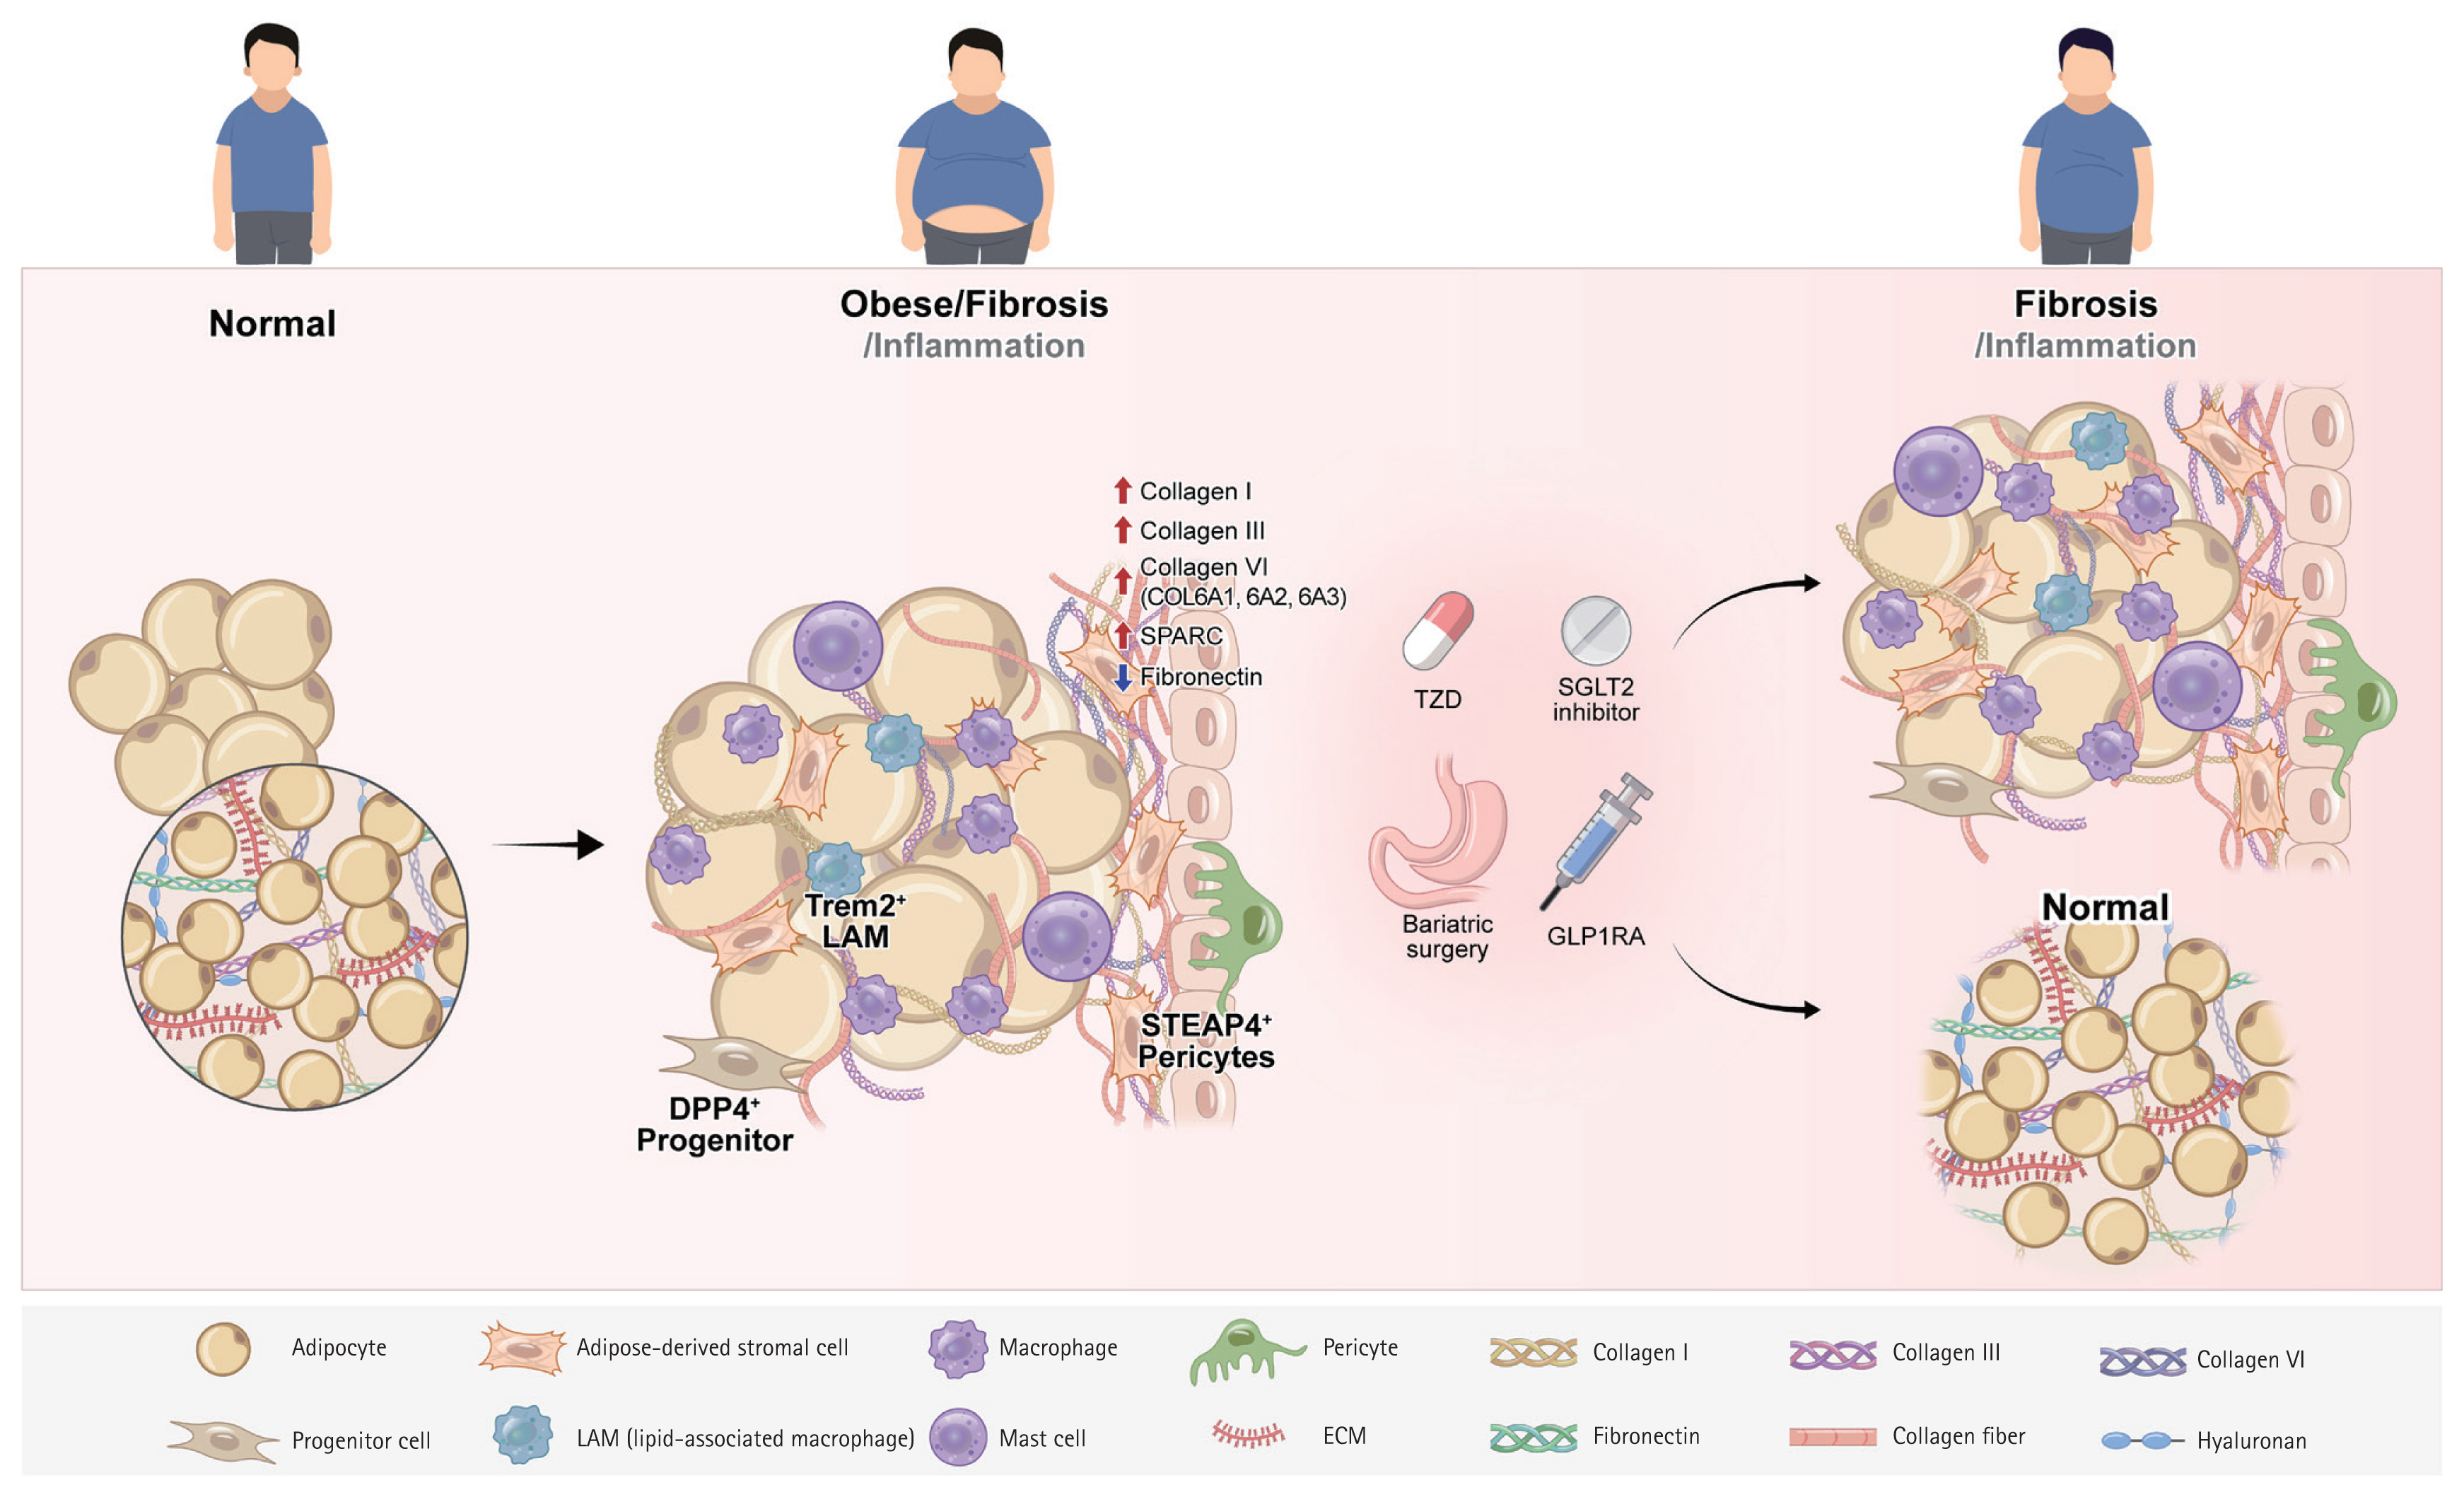
Proteomic profiling of human and rodent adipose tissues revealed depot-specific ECM signatures that distinguished metabolically healthy from fibrotic adipose tissues. Among the most prominent components, the collagen VI complex (COL6A1, COL6A2, and COL6A3) exhibits strong positive correlations with glycemia, HbA1c levels, and visceral fat mass [19]. Elevated collagen VI expression increases tissue rigidity and limits adipocyte expandability, promoting hypoxia and inflammation. Their high abundance in type 2 diabetes establishes a molecular link between ECM stiffness and metabolic dysfunction [19].
In fibrotic adipose tissue, basement membrane proteins such as collagen IV and heparan sulfate proteoglycans are enriched, reflecting the hierarchical remodeling of the microvascular niche [20]. Laminin complexes show dynamic expression during fibrosis progression, suggesting ongoing basement membrane adaptation rather than terminal scarring [21].
In addition to collagen, non-collagenous ECM components play critical regulatory roles. Fibronectin supports preadipocyte adhesion, cytoskeletal organization, and integrin-mediated mechanotransduction, thereby maintaining adipogenic potential. However, fibronectin levels decline in obesity, weaken ECM integrity, and impairing remodeling [22,23]. Conversely, secreted protein acidic and rich in cysteine (SPARC), which is upregulated in obesity, promotes ECM deposition and collagen cross-linking [24]. SPARC deficiency shortens the collagen fibrils, reduces tensile strength, and increases adiposity, indicating that SPARC maintains ECM tension and prevents pathological expansion [25].
Together, fibronectin and SPARC exemplify how non-collagenous ECM proteins modulate adipose tissue plasticity. Their reciprocal regulation, in which fibronectin decreases and SPARC increases in obesity, marks a shift from an adaptive to a fibrotic ECM network. Although ECM turnover involves proteolytic systems such as matrix metalloproteinases (MMPs), tissue inhibitors of metalloproteinases (TIMPs), and a disintegrin and metalloproteinases with thrombospondin motifs (ADAMTS), these enzymatic pathways have been reviewed in detail previously [13,18]. The following sections focus on the cellular contributors and signaling networks that drive adipose fibrosis, reflecting the most recent findings from single-cell and spatial omics studies.
Cellular contributors to adipose tissue fibrosis
The adipose tissue is a heterogeneous organ composed of adipocytes, fibroblasts, progenitors, macrophages, pericytes, and mast cells, all of which participate in ECM synthesis and remodeling. Recently, single-cell RNA sequencing and spatial transcriptomics have clarified how metabolic stress reshapes this multicellular ecosystem, promoting fibrogenic activation of stromal and immune compartments. The key cellular populations contributing to adipose tissue fibrosis, along with their experimental sources, depot localization, molecular markers, and functional characteristics are summarized in Table 1 [26–33].
Progenitor and fibroblast populations
Adipose progenitor cells expressing platelet-derived growth factor receptor alpha and beta (PDGFRα and PDGFRβ) serve as precursors for both adipogenic and fibrogenic lineages. Under obesogenic stress, these progenitors acquire a profibrotic phenotype, with elevated ECM gene expression and reduced adipogenic potential. A PDGFRα+ dipeptidyl peptidase-4+ (DPP4+) subset acts as a major fibrogenic driver, comprising nearly 60% of progenitors under fibrotic conditions (versus ~27% in lean tissue). These cells activate transforming growth factor-beta/mothers against decapentaplegic homolog (TGF-β/SMAD) signaling and differentiate into collagen-producing fibroblasts, whereas DPP4− progenitors retain adipogenic capacity [26].
Single-cell mapping identifies fibrosis-associated fibroblast subtypes ranging from early ECM-secreting fibroblasts to mature myofibroblasts enriched in collagens I and VI [34]. These cells localize to hypoxic and perivascular niches surrounding crown-like structures (CLSs), suggesting spatially coordinated ECM synthesis driven by Wnt/β-catenin and TGF-β/SMAD pathways [34,35].
Adipocytes
Adipocytes actively contribute to ECM remodeling. During early differentiation, collagens I/III/V predominate, whereas mature adipocytes synthesize collagens IV/VI to stabilize the basement membrane [36]. Adipocyte-derived TGF-β, connective tissue growth factor (CTGF), lysyl oxidase (LOX), and osteopontin (OPN) promote fibroblast activation and collagen stabilization [27,37–39]. OPN deletion reduces TGF-β and MMP expression, attenuating fibrosis [40], underscoring adipocytes’ dual role as ECM producers and paracrine regulators.
Macrophages
Macrophages exert dual functions in adipose fibrosis by promoting ECM deposition and degradation [41]. Mincle-expressing macrophages, although only ~2–3% of stromal vascular cells, localize to CLSs and potently induce fibroblast activation via TGF-β1 [28]. Triggering receptor expressed on myeloid cells 2 (TREM2)-high lipid-associated macrophages (LAMs) represent a metabolic–fibrotic continuum and function in lipid clearance and remodeling [29,42]. M2-like macrophages enhance ECM deposition via STAT6 activation, whereas classically activated macrophages secrete MMPs (MMP2/9/12) that promote fibrolysis [41,43], reflecting the complex macrophage balance within the fibrotic adipose tissue.
Pericytes and mast cells
Pericytes, particularly six-transmembrane epithelial antigen of prostate 4+ (STEAP4+) subsets, detach from the microvasculature under metabolic stress and differentiate into collagen-producing myofibroblast-like cells. This process, driven by TGF-β1 signaling, is linked to vascular dysfunction and stromal fibrosis [30]. Mast cells also accumulate in obese adipose tissue, releasing monocyte chemoattractant protein-6 (MCP-6) to induce collagen V and restrict pre-adipocyte differentiation, further amplifying fibrosis and metabolic inflexibility [31].
ECM remodeling pathways: from cellular crosstalk to network integration
Adipose fibrosis arises from the coordinated interactions between stromal and immune cells that regulate ECM turnover and mechanotransduction. Among these, macrophage–fibroblast communication via the oncostatin M (OSM) axis plays a central role. Mincle+ macrophages secrete OSM, which suppresses fibroblast collagen transcription; OSM deficiency abrogates this brake, leading to exaggerated fibrosis [28].
Spatial transcriptomics shows that macrophage–fibroblast crosstalk is concentrated within CLSs, where gradients of TGF-β, PDGF, and OSM activity shape localized fibrotic niches [28]. Pericyte-derived myofibroblasts expand around vessels through TGF-β1-induced COL3A1, FN1, and LOX expression, linking microvascular injury to matrix accumulation [30].
At the progenitor level, PDGFRα+ DPP4+ cells integrate BMP–TGF-β signaling via matrix Gla protein (MGP). MGP deficiency enhances TGF-β signaling and fibrogenic differentiation, whereas DPP4 inhibition restores adipogenic capacity [26]. These paracrine and mechanical feedback loops, reinforced by integrin–FAK and YAP/TAZ activation, establish a self-perpetuating fibrotic circuit that stiffens the ECM and limits adipose tissue plasticity.
Depot- and adipocyte-subtype differences in fibrosis dynamics
Adipose fibrosis displays strong depot- and cell-type-specific variations linked to developmental origin, vascularity, and metabolic function. Subcutaneous white adipose tissue (sWAT) has greater expandability and regenerative potential than visceral WAT (vWAT), which is prone to fibrosis, inflammation, and metabolic dysfunction [13]. Brown adipose tissue (BAT), rich in mitochondria and vasculature, is relatively resistant but can undergo “whitening” under chronic stress [13].
Single-cell and spatial transcriptomics demonstrated that vWAT exhibits hypertrophic adipocytes, elevated LAM density, and extensive CLS formation, whereas sWAT maintains heterogeneous adipocytes and beige precursors with angiogenic and anti-fibrotic profiles [32,44,45]. Despite reduced inflammation, sWAT accumulates profibrotic fibroblast subsets, correlating with visceral adiposity and insulin resistance [33].
Across depots, shared pathways, including TGF-β/SMAD, integrin–FAK, and LOX-mediated cross-linking, drive ECM remodeling. However, functional outcomes differ: WAT fibrosis impairs lipid buffering and endocrine signaling, whereas BAT fibrosis blunts thermogenic capacity. These differences underscore the need for depot-tailored anti-fibrotic strategies that enhance expandability in WAT versus preserving thermogenesis in BAT [46].
Emerging perspectives and integrative approaches
Recent single-cell and spatial omics studies have refined our understanding of adipose fibrosis by delineating stromal and immune heterogeneities. Integrative analyses highlighted non-coding RNAs (miR-29, miR-30a, and lncRNA H19) and epigenetic markers as regulators of fibroblast activation and collagen synthesis [47–50]. Fibrosis–inflammation cross-talk is bidirectional: ECM stiffness polarizes macrophages toward inflammatory phenotypes, while macrophage-derived cytokines (TGF-β, interleukin [IL]-1β, and IL-6) enhance fibroblast activation and suppress adipogenesis [51,52].
Fibrotic WAT exhibits a reduced lipid storage capacity, leading to ectopic lipid spillover and systemic insulin resistance. In preclinical models, attenuation of TGF-β or LOX signaling improves insulin sensitivity, supporting fibrosis as a mechanistic driver of metabolic disease [53,54]. Despite partial reversibility with weight loss or anti-diabetic therapies, residual fibrotic “scars” persist, implying a form of metabolic memory [55–57]. Future longitudinal human studies combining imaging and multi-omics will be critical for defining reversible versus persistent fibrosis and guiding precision treatment.
CLINICAL AND TRANSLATIONAL PERSPECTIVES
Circulating biomarkers of adipose tissue fibrosis in humans
Sun et al. [58] identified endotrophin, a pro-peptide derived from collagen VI, as a circulating biomarker that facilitates adipose tissue fibrosis and insulin resistance. Their study demonstrated that endotrophins are released into the bloodstream during excessive ECM remodeling and can be used to evaluate the progression and prognosis of metabolic diseases [58].
In models of obesity and metabolic diseases, elevated endotrophin levels are associated with an increased severity of adipose tissue fibrosis and greater metabolic dysfunction. The authors suggested that the modulation of endotrophin levels could serve as a molecular target for managing disease progression [59,60]. Henriksen et al. [61] reported that adipose tissue and blood endotropin levels are strongly correlated with fibrosis in both obese patients and animal models. Their findings indicated that the administration of antibodies that neutralize endotrophins significantly reduced fibrosis and inflammation [61]. They highlighted that endotrophin accelerates the progression of adipose tissue fibrosis and, as a circulating biomarker in the blood, offers potential clinical utility for predicting disease and evaluating treatment responses [61].
Gliniak et al. [1] conducted a review indicating that blood markers in obese patients, such as elevated inflammatory cytokines (leptin, TNF-α, and TGF-β) and decreased adiponectin levels, are correlated with an increased risk of adipose tissue fibrosis. Nonetheless, they concluded that the diagnostic precision of non-invasive blood biomarkers alone for fibrosis remains inadequate [1]. Ezzati-Mobaser et al. [62] identified a positive correlation between blood visfatin and endotrophin concentrations, and adipose tissue fibrosis markers in obese children and adolescents.
Their experimental findings demonstrated that visfatin facilitates the expression of fibrosis-initiating genes, such as Col6 and Opn, through pathways including PI3K/JNK/nuclear factor kappa B (NF-κB) [62].
In a recent study, Samovski et al. [63] investigated the biology of the adipose tissue in 10 obese patients with type 2 diabetes by analyzing subcutaneous adipose tissue biopsies obtained during surgery, both before and after weight loss. After achieving a significant weight loss of 16–20%, a reduction in the expression of genes associated with the ECM in the adipose tissue was observed [63]. This reduction prominently included the SERPINE1 gene, which encodes plasminogen activator inhibitor-1 (PAI-1), and is correlated with an approximately 70% decrease in plasma PAI-1 levels [63]. This study relied on gene expression analysis through invasive tissue biopsy and did not offer a direct biomarker for adipose tissue fibrosis that could be detected in circulating blood [63].
Thus, the development of a circulating biomarker for noninvasive assessment of fibrosis in human adipose tissue remains a crucial research challenge.
Imaging-based assessment of adipose tissue fibrosis in humans
Non-invasive imaging modalities, including magnetic resonance elastography (MRE), ultrasound elastography, and magnetic resonance imaging (MRI)-based fat fraction analyses, are currently being actively developed for the assessment of adipose tissue fibrosis [13]. These techniques may be instrumental in quantifying the extent of fibrosis within the adipose tissue and in non-invasively evaluating disease status [13].
In addition, Abdennour et al. [64] developed the Adiposcan device, which is based on the FibroScan principle, offering a method for the non-invasive assessment of stiffness and fibrosis levels in subcutaneous adipose tissue. Quantitative assessments of adipose tissue fibrosis using high-resolution ex vivo MRI are being conducted as indicators of pathological changes in the adipose tissue among obese patients and have demonstrated correlations with histopathological findings [65].
Recent advancements in research have focused on the quantification of adipose tissue fibrosis using high-resolution ex vivo MRI, which serves as an indicator of pathological alterations in the adipose tissue among obese individuals [13]. This approach demonstrated significant correlations with histopathological analysis [65]. Bouazizi et al. [65] successfully quantified subcutaneous adipose fibrosis using high-resolution ex vivo MRI, revealing a strong correlation with histopathological findings.
Gliniak et al. [1] published a comprehensive review comparing and analyzing various imaging techniques, including ultrasound-based elastography, 3D MRI, and MRE, and summarized the key features of the major clinical imaging techniques in table.
In 2023, Jensen et al. [66] conducted a study that assessed the stiffness and level of fibrosis in the adipose tissue in vivo using MRE techniques without invasive procedures. Chen et al. [67] authored a review paper that explored research trends in the non-invasive early detection of fibrosis using molecular imaging probes.
Fibrosis as a predictor of metabolic flexibility, weight loss response, and weight regain
Lanyon et al. [9] reported a range of clinical variables, including sex, age, history of diabetes, and genetic and psychological characteristics, as potential indicators for predicting weight loss outcomes after bariatric surgery. However, the predictive efficacy of these variables remains unclear.
Lee et al. [68] investigated the early clinical application of artificial neural networks for predicting weight loss success following bariatric surgery. These findings indicate that a range of clinical and genetic variables, such as sex, insulin levels, albumin levels, and specific genotypes, could serve as significant predictors of postoperative weight loss outcomes [68].
Divoux et al. [69] investigated the depot-specific effects of adipose tissue fibrosis after bariatric metabolic surgery and revealed divergent clinical outcomes in subcutaneous and omental fat. Fibrosis in the omental fat is linked to the suppression of adipocyte hypertrophy and enhanced lipid metabolism, whereas fibrosis in the subcutaneous fat is associated with the inhibition of postoperative body fat reduction [69]. These findings indicate that the anatomical location and extent of adipose tissue fibrosis can substantially affect postoperative weight loss and metabolic improvement [69]. This study marked a significant shift in the view of adipose tissue fibrosis, transforming it from merely a pathological observation to a predictive tool for assessing clinical outcomes and postoperative weight loss [69].
Cancello et al. [70] reported that in subcutaneous adipose tissue from patients whose body mass index (BMI) normalized to an average of 27.2 kg/m2 following bariatric surgery, an improvement was observed in adipocyte hypertrophy and macrophage infiltration, although fibrosis persisted. Notably, their transcriptome profiles exhibited a pattern more similar to that of the severely obese group (BMI ≥ 40 kg/m2) than to the normal-weight group, with metallothionein over-expression identified as a prominent characteristic [70]. Research findings imply that adipose tissue fibrosis is an irreversible structural modification that persists even after weight loss, potentially limiting the recovery of metabolic flexibility after surgery [70]. Thus, adipose tissue fibrosis may be recognized as an independent biomarker for predicting long-term metabolic health outcomes regardless of successful weight reduction [1].
Although the recurrence and exacerbation of inflammation in the adipose tissue during weight regain have been extensively documented, a significant gap in research regarding the development of adipose tissue fibrosis remains [15]. In addition, recent research indicates that fibrosis in the adipose tissue persists even after weight loss and is linked to the epigenetic memory of obesity [71].
Further investigation is necessary to understand how fibrosis patterns change and influence metabolic function during periods of weight regain. Therefore, understanding the role of adipose tissue fibrosis in response to weight fluctuation is crucial for developing long-term weight management solutions.
Integration of adipose fibrosis assessment in metabolic clinical studies
Recent research on the assessment methods for adipose tissue fibrosis is predominantly divided into three domains: investigation of underlying mechanisms, development of models, and analysis of clinical significance. A comprehensive evaluation is crucial to determine the clinical significance of adipose tissue fibrosis.
This includes the application of circulating biomarkers; imaging techniques such as MRI and MRE; tissue and cellular analyses; and multi-omics approaches, including transcriptomics, proteomics, and lipidomics [1,28]. The application of multi-omics technologies facilitates the precise analysis of large patient cohorts, elucidating the correlation between diverse metabolic pathways and cellular functional heterogeneity, such as inflammation and fibrosis, within adipocytes and the development of metabolic diseases [28,63]. In addition, important developments in the field include the transition from traditional BMI-based diagnostic methods to the direct prediction and assessment of various pathophysiological alterations in adipose tissues [71].
This progress has been enabled by the utilization of novel biomarkers, such as endotrophins and adiponectin, along with advanced imaging techniques like MRI and MRE, in conjunction with advancements in omics and single-cell research.
Cartwright et al. [71] recently demonstrated that variability in inflammation and fibrosis within adipose tissue is a critical factor in predicting health outcomes associated with metabolic diseases in individuals with obesity. Cartwright et al. [71] also found that inflammation and fibrosis resulting from excessive adipocyte hypertrophy and ECM remodeling are more significant pathophysiological mechanisms for predicting metabolic syndrome than BMI. Furthermore, they demonstrated that the cellular heterogeneity of adipose tissue, as revealed through biomarkers (e.g., endotrophin and adiponectin) and omics/single-cell analyses, directly influences the risk of metabolic diseases [71]. These findings indicate that heterogeneity in adipose tissue development and function is a critical factor influencing complications and treatment responses, not only in adults but also in pediatric obesity [71].
The adoption of integrated, multi-layer diagnostic and evaluation strategies is becoming increasingly crucial for the effective management of next-generation obesity-related metabolic disorders and the enhancement of clinical decision-making processes.
IMPACT OF THERAPEUTIC INTERVENTIONS
Bariatric surgery: histological and functional changes in adipose tissue fibrosis after weight loss surgery
Recent research has indicated that the extent of fibrosis in subcutaneous adipose tissue following bariatric surgery may affect weight loss outcomes [64,69]. Table 2 [64,69,70,72–79] summarizes the histological and functional changes associated with adipose tissue fibrosis following weight loss due to bariatric surgery.
Divoux et al. [69] demonstrated that fibrosis increases in both subcutaneous and visceral fat in severely obese patients. They found that patients with greater preoperative subcutaneous fat fibrosis experienced reduced fat loss at 3, 6, and 12 months post-surgery [69]. The findings of this study indicate that fibrotic tissue, with particular emphasis on pericellular fibrosis, may serve as a prognostic marker in clinical practice, surpassing its traditional role as a histological feature [69]. Furthermore, using real-time PCR, we confirmed that the expression levels of collagen types I, III, and VI were higher in the stromal vascular fraction compared with adipocytes [69].
Furthermore, Pasarica et al. [80] demonstrated that the expression of COL6A3 in the abdominal subcutaneous adipose tissue is elevated in obese individuals and is significantly correlated with both BMI and total fat mass. These studies suggested that COL6 and collagen family genes and proteins are integral to the pathophysiology of obesity-associated adipose tissue fibrosis [69,80].
Subsequent investigations by numerous researchers have examined the histological and functional alterations in adipose tissue fibrosis associated with bariatric surgery [72–74]. These studies suggest that the extent of preoperative fibrosis may serve as a predictive factor for weight loss outcomes.
Research evidence suggests that adipose tissue fibrosis may have clinical significance as a key biomarker and predictive tool for the management of future metabolic diseases and determination of surgical prognosis.
Thus, numerous studies investigating the alterations in adipose tissue after bariatric surgery have elucidated the key mechanisms contributing to effective weight loss.
Recent studies have conducted an in-depth exploration of the pathophysiological mechanisms at the molecular and cellular levels, with a particular focus on alterations in mitochondrial function, regulation of gene expression, and interactions among stromal cells in the context of adipose tissue fibrosis and bariatric surgery.
Chabot et al. [72] observed that fibrosis within the subcutaneous adipose tissue did not exhibit significant changes six months after bariatric surgery. Furthermore, they identified only a transient correlation between adipose tissue fibrosis and insulin resistance [72].
Camastra et al. [75] conducted an analysis to assess the impact of bariatric surgery on the morphology of muscle and adipose tissues as well as on insulin sensitivity and beta-cell function in both diabetic and non-diabetic individuals with obesity. Before surgical intervention, adipose tissue develops fibrosis, necrosis, and abnormalities in mitochondrial structure [75].
The investigation by Osorio-Conles et al. [76] holds particular importance as it revealed that the preoperative expression of genes related to the ECM, specifically COL5A1 and COL6A3, in subcutaneous adipose tissue can act as a biomarker for forecasting weight loss following surgery.
Ledoux et al. [74] identified the size of stromal cells in subcutaneous adipose tissue and adipocytes in visceral fat as determinants of metabolic flexibility in obesity, correlating these factors with weight loss and enhanced insulin resistance following bariatric surgery.
Current investigations using mouse models examine the underlying mechanisms and assess potential therapeutic interventions to mitigate fibrosis in adipose tissue.
Recent studies using mouse models have investigated the underlying mechanisms and possible therapeutic strategies for fibrosis in adipose tissues. Table 3 [28,50,81,82] summarizes the histological and functional alterations in adipose tissue fibrosis observed in obese animal models.
According to a study by Saha et al. [50], microRNA-30a inhibits the expression of PAI-1 and various fibrosis markers in subcutaneous adipocytes from both high-fat diet-fed models and obese humans, thereby preventing adipose tissue fibrosis. This action contributes to the maintenance of insulin sensitivity and suppression of fatty liver development [50]. These studies conducted in mice provided significant scientific insights into the histological and functional changes in adipose tissue fibrosis, their link to obesity-related metabolic disorders, and the discovery of therapeutic targets [50].
Enhanced angiogenesis in 11β-hydroxysteroid dehydrogenase type 1 knockout mice mitigates adipose tissue hypoxia and the progression of fibrosis, thereby promoting a favorable metabolic state [81].
In mice on a high-fat diet, the flavonoid isoliquiritigenin, sourced from licorice, was found to decrease the expression of key fibrosis markers, including TNF-α, collagen type I, transforming growth factor-β, and tissue inhibitor of metalloproteinases-1 [82]. This effect is mediated by the inhibition of NF-κB signaling, highlighting its potential to mitigate adipose tissue fibrosis [82].
In mice with diet-induced obesity, the macrophage-inducible C-type lectin and OSM pathways, which facilitate interactions between macrophages and fibroblasts, play a crucial role in regulating adipose tissue fibrosis and alterations in ECM gene expression [28]. Notably, the absence of OSM results in increased adipose tissue fibrosis [28].
Anti-diabetic therapies (glucagon-like peptide-1 [GLP-1] receptor agonists, sodium-glucose cotransporter 2 [SGLT2] inhibitors, and thiazolidinediones [TZDs])
GLP-1 receptor agonists on adipose tissue fibrosis
Exenatide, a GLP-1 receptor agonist, has been shown to reduce the expression of genes associated with inflammation and fibrosis in the adipose tissue, such as Tnfa and Timp1, in animal models, particularly those pertaining to non-alcoholic steatohepatitis and obesity [83]. Human studies have reported that exenatide may ameliorate subcutaneous fat pain and fibrosis in patients with lipedema [84]. However, robust clinical evidence supporting the regression of established adipose tissue fibrosis remains insufficient [84].
Studies on human tissues indicated that liraglutide, a GLP-1 receptor agonist, does not significantly reduce pericellular fibrosis in subcutaneous fat [85]. Although the efficacy of GLP-1 receptor agonists in ameliorating hepatic fibrosis and metabolic abnormalities is well-documented, there is a lack of direct animal and clinical data specifically addressing their effects on adipose tissue fibrosis.
Moreover, a review of the literature over the past decade indicated that studies, both animal and clinical, specifically addressing adipose tissue fibrosis using semaglutide or tirzepatide are limited.
Thus, Exenatide, liraglutide, and related agents may be effective in both animal and human studies, as they inhibit the progression of inflammation and fibrosis in adipose tissue and enhance specific metabolic markers. However, these conclusions were drawn from a relatively small number of studies and that the overall results of the evidence remain limited.
Therapies based on GLP-1 receptor agonists, including semaglutide and tirzepatide, have recently garnered significant attention in the field of metabolic diseases such as obesity and type 2 diabetes.
Consequently, undertaking both foundational (preclinical and animal model) and clinical (human subject) investigations, with particular emphasis on understanding how these treatments reduce adipose tissue fibrosis and inflammatory processes is crucial, especially in the context of weight regain after the discontinuation of these pharmacological interventions. In addition, exploring the molecular and cellular processes through which therapies based on GLP-1 receptor agonists modulate metabolic and inflammatory pathways and prevent fibrosis, along with evaluating their potential clinical applications, are promising directions for future studies.
SGLT2 inhibitors on adipose tissue fibrosis
SGLT2 inhibitors, including dapagliflozin and empagliflozin, have recently emerged as significant agents for the exploration of the pathophysiology of adipose tissue fibrosis and therapeutic interventions [86]. Table 4 [87–90] demonstrates that SGLT2 inhibitors influence fibrosis within the adipose tissue.
These drugs are known for their ability to improve metabolic diseases (such as type 2 diabetes, cardiovascular disease, and chronic kidney disease) through various molecular and cellular mechanisms [91]. Interestingly, they contribute to the reduction of inflammatory cytokines, influence macrophage polarization within adipose tissue, enhance metabolic flexibility, and modulate the expression of fibrosis markers in adipose tissue [92].
Several animal models and clinical studies have specifically investigated the effects of SGLT2 inhibitors in alleviating adipose tissue fibrosis and dysfunction [92]. Table 4 [87–90] presents the effects of SGLT2 inhibitors on adipose tissue fibrosis.
Sato et al. [87] demonstrated that dapagliflozin positively influences cardiac adipose tissue-related metabolic markers in patients with type 2 diabetes and coronary artery disease by diminishing pericardial fat tissue mass and reducing inflammatory markers such as TNF-α and PAI-1.
In a subsequent investigation, Sato et al. [88] demonstrated that the administration of dapagliflozin resulted in a reduction in plasma TNF-α concentration and perivascular adipose tissue volume. These modifications are correlated with changes in the perivascular adipose tissue volume [88]. Takano et al. [89] showed that empagliflozin inhibited the differentiation and maturation of human epicardial preadipocytes. This inhibition leads to enhancement of the paracrine secretome profile, which in turn improves the functionality of the epicardial adipose tissue [89].
The EMPA-TROPISM study conducted by Requena-Ibáñez et al. [93] provided novel insights into the cardiovascular protective mechanisms of SGLT2 inhibitors. This study demonstrated that empagliflozin significantly enhanced aortic stiffness and inflammatory markers in non-diabetic patients with heart failure [93]. These findings indicate that SGLT2 inhibitors may serve as promising therapeutic targets for metabolic diseases by ameliorating adipose tissue fibrosis and mitigating inflammation [93].
TZD on adipose tissue fibrosis
Pioglitazone, as a peroxisome proliferator-activated receptor gamma (PPARγ) agonist, such as TZD exhibits anti-fibrotic effects across various organs. Studies have suggested that it reduces collagen expression in adipose tissue, thereby decreasing the ECM content and ameliorating the diabetic phenotype [94]. Table 5 [59,94–96] illustrates the effects of TZD on adipose tissue fibrosis.
Other studies demonstrated that pioglitazone plays a crucial role in adipose tissue fibrosis by reducing the population of adipocytes and macrophages in the adipose tissue of insulin-resistant individuals. This reduction facilitates angiogenesis, which in turn alleviates both inflammation and fibrosis. In particular, this study demonstrated that increased elastin allows adipocytes to expand flexibly without cell necrosis or inflammatory responses, thereby enhancing the structural and metabolic health of adipose tissues [59]. In addition, rosiglitazone enhances insulin sensitivity in patients with type 2 diabetes and is correlated with alterations in adipocyte size [97].
In a study conducted by Dankel et al. [98], the expression of COL6A3 was 2.6 times higher in adipocytes derived from obese patients who exhibited insulin resistance. Furthermore, the study confirmed that a decrease in PPARγ activity leads to an increase in COL6A3 expression [98]. This finding implies that PPARγ agonists, such as TZD, may have the potential to suppress COL6A3 expression, thereby mitigating fibrosis in adipose tissue [98]. This may facilitate adipocyte development and enhance insulin sensitivity [98].
In the study conducted by Guglielmi et al. [99], 40 patients with severe obesity were assessed using a glucose clamp technique. These findings indicated that as insulin resistance became more pronounced, a significant increase was observed in the expression of collagen types I, III, and VI within the omental adipose tissue [99]. This fibrotic response was positively correlated with inflammatory mediators (IL-6, TGF-β1, activin A, and CTGF), hypoxia-inducible factor (HIF-1α), and macrophage markers (CD68 and MCP-1) [99]. Consequently, adipose tissue fibrosis in conjunction with chronic inflammatory responses constitutes a critical pathophysiological mechanism underlying obesity-related metabolic complications [99]. These results suggest that targeting fibrosis inhibition may represent a novel therapeutic strategy for ameliorating insulin resistance [99].
Thus, TZD medications are well-established agents for ameliorating insulin resistance, with the potential to significantly improve insulin sensitivity and metabolic health by mitigating fibrosis and inflammation in the adipose tissue. Additionally, they facilitate the remodeling of the ECM and promote angiogenesis. However, further research is necessary to precisely delineate their therapeutic potential.
FUTURE DIRECTIONS AND CONCLUSION
Integrative multi-omics approaches to study adipose remodeling: translational and therapeutic implications
The integration of multi-omics technologies, including single-cell transcriptomics, spatial genomics, metabolomics, and proteomics, has transformed the understanding of adipose tissue fibrosis from a structural pathology to a multidimensional, metabolically regulated process. These approaches enable the dissection of cellular networks that coordinate ECM remodeling, inflammation, and metabolic reprogramming, thereby uncovering the cellular heterogeneity and signaling hierarchies that drive fibrotic progression.
Recent studies employing combined single-cell and metabolomic analyses have revealed the key metabolic-fibrotic circuits that link adipose dysfunction to systemic metabolic diseases. Dysregulated sphingolipid metabolism, characterized by elevated ceramide and sphingosine-1-phosphate (S1P) levels, promotes TGF-β activation, macrophage recruitment, and fibroblast differentiation [100]. Parallel pathways involving branched-chain amino acid (BCAA) catabolism demonstrate that reduced BCAA oxidation augments TGF-β/SMAD signaling and collagen synthesis, while restoring BCAA utilization can mitigate fibrosis [101,102]. These cell-type–specific interactions, particularly within PDGFRα+ DPP4+ fibroblasts and Mincle+ macrophages, highlight the metabolic specialization of stromal and immune compartments in shaping the fibrotic niche [26,28].
Proteomic mapping complements these findings by defining molecular signatures of disease severity. The collagen VI complex (COL6A1–A3) correlates with glycemia and visceral adiposity, whereas basement membrane components such as collagen IV and laminin exhibit dynamic regulation during fibrosis progression [19,20]. Key regulatory nodes, including PAI-1 and MMP–TIMP networks, integrate the proteolytic balance with the metabolic state and serve as potential biomarkers for therapeutic responses [17,50,103]. Integrative pathway analyses consistently converge on TGF-β/SMAD and ECM–receptor interaction signaling as central frameworks connecting metabolic stress to fibroblast activation and matrix remodeling.
Together, these multi-omics approaches have reframed adipose tissue fibrosis as a complex, metabolically driven network rather than a static consequence of chronic obesity. By bridging single-cell mechanistic data with systemic metabolic phenotypes, they provided a translational framework for identifying cell-specific therapeutic targets, stratifying patient responses, and guiding precise interventions for metabolic diseases.
Development of novel anti-fibrotic therapeutic strategies for obesity management
The development of diagnostic and therapeutic strategies for obesity-related adipose tissue fibrosis is currently based on three principal approaches.
First, establishing a multilayered diagnostic platform is crucial. Prospective clinical studies have underscored the importance of a comprehensive diagnostic system that integrates histological fibrosis assessment through adipose tissue biopsy, blood biomarkers such as endotrophin and PAI-1, non-invasive imaging techniques such as MRI T1 mapping or MR elastography, and single-cell analysis. This integration of tissue-, molecular-, and imaging-based diagnostics along with emerging technologies is expected to enhance the diagnostic precision of obesity-related fibrosis and augment the potential for personalized treatment.
Secondly, the application of spatial transcriptomics and intercellular interaction network analysis is gaining prominence. Multidimensional strategies that incorporate spatial context are advancing beyond the constraints of traditional single-cell analyses. Kohda et al. [28] employed spatial transcriptomics to elucidate macrophage-fibroblast interactions within CLSs in the adipose tissue of obese patients and identified the Mincle-OSM signaling pathway as pivotal for fibrosis regulation. Additionally, Saha et al. [50] demonstrated in the Journal of Clinical Investigation that miR-30a mitigates fibrosis in subcutaneous adipose tissue by inhibiting PAI-1, serving as a regulator predictive of a metabolically healthy obesity phenotype. Dahdah et al. [104] reassessed the role of diverse macrophage phenotypes beyond the conventional M1/M2 classification in adipose tissue remodeling contingent on the microenvironment. These research trends have fostered an integrated understanding of the spatial and molecular heterogeneity of adipose tissue fibrosis, thereby laying the foundation for the development of miRNA-based precision therapeutic strategies.
Third, anti-fibrotic therapies that incorporate weight loss as a core component are currently being evaluated. Preclinical and clinical studies are actively investigating GLP-1 receptor agonists (semaglutide and tirzepatide) and bariatric surgery, which exhibit significant weight loss effects exceeding 10–15%. The application of previously developed anti-fibrotic biomarkers or omics-based analytical techniques in these studies is expected to facilitate an integrated approach that encompasses the improvement of adipose tissue fibrosis, elucidation of molecular mechanisms, and prediction of treatment responses.
CONCLUSIONS
In conclusion, comprehensive and detailed research is crucial to thoroughly elucidate the molecular mechanisms underlying adipose tissue fibrosis and enhance its clinical applicability. In particular, the establishment of a multilayered diagnostic platform integrating histological analysis, molecular biomarkers, imaging diagnostics, single-cell and spatial transcriptomic analyses, and the development of precision medicine approaches based on this platform will play a pivotal role in establishing personalized anti-fibrotic treatment strategies for obesity and metabolic diseases. This is expected to contribute to the prevention of obesity-related metabolic complications and improve treatment outcomes.
 PDF Links
 PubReader
 ePub Link
 Full text via DOI
 Download Citation
 Print
Print


